
Abstract
The stability of potentially toppling rock blocks has been typically addressed for the case of regular block geometries showing symmetry planes and resting on surfaces aligned with the slope face, i.e., the strike of the slope is parallel to the block sides and their basal planes. However, these simple geometries with ideally oriented blocks are not often found in nature. This study aims to bridge this knowledge gap through analytical and experimental approaches, in the form of laboratory physical models, to study toppling cases for non-conventional scenarios. An engineering geology review was first conducted, identifying potential non-standard cases in nature. Then, the current analytical solutions for both the factor of safety and critical toppling angle were modified for these misaligned cases, focusing on single block and standard block toppling, and considering the effect of block-edge rounding. Physical models support the analytical approach. It is concluded that toppling stability is slightly improved when the orientation of the basal plane of the blocks differs with the strike of the slope. In this way, for single blocks, the critical toppling angle increases a few tenths of a degree when the difference between strikes is 10°, about 1° with strike differences about 20° and 2 to 3° for misalignments about 30°. Similar increases are observed for block toppling cases. Accordingly, small differences in strike of basal planes and the slope contribute to slightly increasing the factor of safety of slopes prone to block toppling. This approach improves practical engineering toppling stability analyses.
Introduction
The analytical resolution of rock mechanics problems often resorts to a number of initial hypotheses or assumptions. They allow a correct mathematical and physical definition of the problem, and eventually to produce a rigorous analytical solution. Due to the variable nature of rock masses, these assumptions may not strictly hold something that could compromise the reliability of the solution found. One of the main tasks of rock engineers is to assess how variations in the assumptions used in their solutions may affect the computed results, considering the actual circumstances. In this study, the authors address this issue, trying to analytically quantify the impact of the orientation of the base of the blocks with respect to that of the slope on toppling stability.
Priest (1993), in line with Goodman (1975), highlighted the importance of discontinuities for the detection of potential failure instabilities. An obvious and direct consequence of the discontinuous nature of a rock mass is the potential existence of rock blocks, which may be near an existing or future free rock face, having the possibility of falling, sliding, or toppling. It is also clear that the fracture geometry and the variability of rock joint properties influence the fractured rock-mass slope stability (Tang et al. 2017; Jia et al. 2023).
The mechanism of toppling typically involves the rotation of rectangular or slab-like-shaped rock blocks or columns around a fixed axis. According to the number of elements involved, it is possible to differentiate between single and multiple block toppling. The analysis of single block toppling in regular cases is a relatively simple matter (Ashby 1971; Hoek and Bray 1974; Sagaseta 1986), although it is necessary to know a priori whether the block is already detached from the rock mass (block toppling) or remains attached (flexural toppling). In nature, typical toppling failures involve several blocks, producing different kinds of mechanisms. According to Goodman and Bray (1976), block toppling, flexural toppling, and block flexural toppling are the most frequent types of mechanisms. Some more complex phenomena involving irregular geometries may take place, generally known as secondary toppling.
Wyllie and Mah (2004) stated that block toppling takes place in hard rock when individual blocks or columns are formed from two perpendicular joint sets, with the main one dipping steeply into the face. The upper blocks tend to topple and push forward onto the short columns at the slope toe. Flexural toppling occurs when continuous rock columns dipping steeply towards the slope break due to flexure and tilt forward. Finally, block flexural toppling is a mixed-mode mechanism characterized by pseudo-continuous flexure along long blocks that are divided by several cross-joints. The object of this study focuses on block toppling, that is, the case in which one or more blocks are already detached from the rock mass.
The necessary but not sufficient condition for the occurrence of toppling instability phenomena in rock slopes is the presence of a tightly spaced discontinuity set striking parallel to the slope but steeply dipping towards it (Goodman and Bray 1976; Brideau and Stead 2012), as shown in Fig. 1 a. Particularly, block toppling occurs when the individual columns present basal joints that release every single block from the rest of the rock mass. In what concerns the geometry of the block setup, the strike of the main joint set should not differ in more than 10° from that of the slope (Goodman and Bray 1976; Goodman and Kieffer 2000), condition represented in stereographic projection in Fig. 1 b. Nevertheless, Cruden (1989) proposed that this angle could be extended to higher values, even if no mathematical expression was provided to quantify this in a rigorous way. Romana (1985) implicitly acknowledged that this angle should be under 20° when proposing the slope mass rating (SMR) classification system. As defined in Fig. 1, γ will be used to denote the angle between the slope strike and that of the basal planes, normal to the main joint set.

a Sketch of a slope prone to block toppling, with a continuous joint set whose strike is parallel to the slope and dipping gently against it, b stereographic representation of the previous slope and the necessary but not sufficient condition proposed by Goodman and Bray (1976) for block toppling, stating that the poles of the main joint set falls within the shaded area. c Sketch of a slope prone to block toppling where the strike of the joint set is not parallel to the slope face. d Stereographic representation of the previous slope and extension of the condition for block toppling analyzed in this study
Goodman and Bray (1976) stated two geometrical assumptions permitting the analytical evaluation of block toppling stability: (i) the block/column-forming discontinuity set is perpendicular to the basal plane and (ii) the strike of the discontinuity set is strictly parallel to that of the slope (Fig. 1a, b). This implies a slab-like geometry and an axis of rotation that coincides with the inclined plane on which they rest. As put forward by Vanneschi et al. (2019), the simple two-dimensional conceptual model may often oversimplify the instability mechanisms, ignoring potential critical factors specifically related to orientations and the three-dimensional component. This can also be relevant when analyzing the stability of precariously balanced rock boulders (Pérez-Rey et al. 2019).
The main objective of this study is to analyze what happens when this hypothesis is not fulfilled, that is, when the strike of the main joint set and that of the slope face are not parallel but they form an angle γ (Fig. 1c, d). Based on the authors’ experience, this may occur quite often in nature. However, this issue has not been extensively studied in an independent manner so far, even if some authors have remarked on the relevance of not considering this assumption (Freitas and Watters 1973; Kimber et al. 1998; Sagaseta et al. 2001; Brideau and Stead 2010).
For instance, Brideau and Stead (2012), based on numerical models analyzing various scenarios for different orientations of the rear, lateral, and basal planes, concluded that changes in the dip direction of the basal surfaces beyond 20° led to increased stability, even if they did not formalize this in an analytical manner. These numerical models were not able though to clearly identify and quantify, independently, the influence of different dip directions between basal planes and the slope, which is the main object of the present study.
There exist three main approaches to analyze the stability of slopes prone to block toppling, namely, analytical limit equilibrium-based methods or LEM, numerical modeling in 2D or 3D and physical modeling by means of tilt tests. These methods are tabulated and referenced in Table 1, where their pros and cons are synthetized.
At a practical level and for a flexural toppling case, Sagaseta et al. (2001) studied a rock cut at a motorway with a strike N-70°, forming an angle of 40° with the strike of the bedding planes dipping towards the slope. Though it was initially considered that this obliquity was enough to prevent toppling failure, several problems associated with changes in a zone of the slope were reported. Also, Alejano et al. (2010, 2019) presented slope instability case studies, where toppling of blocks occurring in certain areas contributed to making the slopes unstable due to mixed mechanisms, including sliding.
In the present study, the authors try to quantify the impact of assumed joint geometry conditions for the study of block toppling phenomena in rock masses, by means of simple limit equilibrium analytical calculations and laboratory physical models (Adhikary et al. 1997; Dong et al. 2020). In particular, the difference in the dip direction of the basal planes of the blocks and that of the slope is quantified. This divergence changes the position of the rotation axis, and therefore the kinematics of the phenomenon. This study takes also into account the role of the block corner rounding.
Engineering geology context
The formal analysis of block toppling, as defined by Goodman and Bray (1976), is founded on various assumptions, some of which do sometimes not hold in practice. These hypotheses include constant spacing of the block joints, perpendicularity between the basal planes and joints, occurrence of lateral separation surfaces, and parallelism between the joint set and the slope face. The last both do often affect the reliability of block toppling stability estimates, according to the authors’ experience.
Therefore, it is pertinent to consider the actual orientation of the basal plane in relation to that of the slope when studying the stability of a slab-like block or its interaction with neighbor blocks (Fig. 2).

Picture and sketch of a rock slope in quartzite (Taramundi, Asturias, Spain) with three joint sets and a fallen block marked in blue in its original position. An orientation sketch showing the different dip directions of the slope and the basal planes is also illustrated
These divergences in the orientation of the potential toppling basal plane and the slope face are not uncommon. They have been observed by the authors in a good number of cases in the field, as the one depicted in Fig. 3 and the group of cases illustrated in Fig. 4 for the three main rock types.

Picture of a mountain slope in granitic rock in the Peneda-Gêres National Park (North Portugal) where a block toppling phenomena can be identified. The authors have marked in white color the estimated original block disposition and in red and blue the estimated dip directions of the slope and the basal plane, which do not coincide

Pictures of various natural slopes or structures, where toppling of blocks is observed or identified and where the toppling basal planes do not follow the same strike as that of the slope. a Eclogite in Cariño, A Coruña, Spain; b granite in O Pindo, A Coruña, Spain; c sandstone associated to the so-called Courthouse Towers in Arches National Park, Utah, USA. On the left lower corner at the bottom of the picture, the potential failure mechanism is illustrated; d limestone in the Pyrenees near the sky resort of Candanchú, Huesca, Spain
So, toppling of blocks is prone to take place also when the strike of the block joints does not coincide with that of the slope face. In such a case, the intersection of the slope face with these discontinuities will produce lines gently dipping towards one side of the slope face, as illustrated in the sketch of Fig. 1 c, but can also be appreciated in the slope presented in Fig. 2. It must be noticed that, when the main discontinuity set direction is oblique to the slope (γ > 30°) and very steep (45° < dip ≤ 70°), care should be taken to properly select the actual dip and not the apparent dip of the slope, observable on the lateral side of the slope (Fig. 1c).
It is also known that when a block toppling phenomenon takes place and due to the overturning trends (Fig. 5a) of blocks, counter-slope escarpments are commonly observed (Alejano 2021). Figure 5 b illustrates the eastern slope of Meirama mine in NW Spain (Bassa et al. 2014), where these counter-slope escarpments can be well observed, associated to the block toppling phenomena described in this mine. The oblique trends of these escarpments indicate that the slope and the block planes are not parallel. The example also illustrates how this situation does not avoid the occurrence of a block toppling phenomena, as already pointed out by Goodman and Bray (1976).

a Cross-cut section of a slope prone to block toppling before and after suffering movements, where counter-slope escarpments or steps are illustrated; b east wall of the Meirama lignite mine in Galicia, Spain in 2013, where oblique counter-slope escarpments marked with blue arrows can be observed
The presented examples confirm that, as stressed by Cruden (1989) and others, block toppling can occur even when the block joints do not strike parallel to the slope face. In what follows, different approaches will be resorted to with the aim of better understanding and quantifying this phenomenon from a rock slope engineering point of view.
Basic previous studies
The theoretical stability analysis against toppling of a slab-like regular block was traditionally addressed in the form of a factor of safety (FoS) by computing the stabilizing and overturning moments of all the forces acting on the block related to the potential rotation axis, which was defined as the origin of the calculating coordinate system. This approach needs to have a prior recognition of the potential rotating axis. The factor of safety can then be computed based on the general Eq. (1).
For a regular block with sharp corners resting on a tilted plane (Fig. 6a), Ashby (1971) did the first study on toppling failure mechanisms of this type of block by means of carrying out laboratory tests on physical models. A theoretical 2D formula was proposed:
where W refers to the weight of the block and Δx and y to its width and height, respectively, and Δx/y is defined as the inverse of slenderness. The dipping angle of the platform is denoted as α.

Sketches of a single block resting on a dipping platform for toppling mechanism analysis: a standard block with sharp corners; b block with rounded corners of r-radius
It is possible to carry out tests of toppling blocks by means of a tilting table (Pérez-Rey et al. 2021), following a procedure similar to that used to estimate the basic friction angle of rock discontinuities (Alejano et al. 2018a).
Sagaseta (1986) extended the approach providing a graph of the possible failure mechanisms of a single block towards sliding, toppling, or sliding and toppling, based on dynamic calculations.
Considering that the dip angle of the platform is smaller than the friction angle of the contact base (to avoid sliding), the FoS against toppling can be computed by relating the stabilizing and overturning moments, and thus, the critical toppling angle, αcrit., can be derived by equating FoS, as in Eq. (2), to 1.
Alejano et al. (2015, 2018b) noticed that eroded blocks tend to show rounded corners in natural rock masses, and notably in granitic ones. Also, saw-cut rock block samples typically present irregular edges in rock mechanics labs. In both cases, these imperfect specimens tend to produce lower critical toppling angles than those predicted for the case of perfect edges as for Eq. (3). Thus, they proposed resorting to an equivalent radius of the corners to account for this effect. Accordingly, when rock columns or blocks present rounded corners, the position of potential rotation pivot will move up against the tilting direction in a length equivalent to this round corner radius. Therefore, the eroded or irregular-edge block is less stable than an equal-sized block with perfectly sharp corners. Its stability can be calculated by introducing an equivalent radius r (Fig. 6b) to generate Eq. (4). If the moment equilibrium calculation is conducted, the critical angle can be obtained as in Eq. (5).
This round corner analysis is relevant at lab scale, too. When testing physical toppling models in the lab, it is difficult to produce rock specimens with perfectly sharp corners, notably when cutting small blocks. Therefore, specimens’ corners tend to show some defects and irregularities in line with natural erosion phenomena, and these corners do affect test results. With the help of an equivalent round corner radius r, it is generally possible to have better accuracy when comparing analytical and laboratory results.
On the other hand, the radius of the corner in the block toe is the one controlling the toppling behavior. However, the processes producing rounding of the blocks’ corners tend to produce similar curvature radii in all corners of the block. In this way and for computation purposes, the average radius is considered a good estimate.
Alejano et al. (2015) experimentally obtained that the curvature radius, r to be input in Eqs. (4) or (5), can be estimated as 2/3 of the average curvature radius \({r}_{c}^{av}\). This is due to the fact that at the center of the edges, the operating radius will be smaller than the average one due to differential erosion of the block (larger in the corners than in the center of the edges).
This radius \({r}_{c}^{av}\) will be the average radius of all the corners of the block to produce the volume (V) computed based on the dry weight (Wdry) and submersed weight (Wsubm.) of the sample applying the Archimedes’ principle (Eq. 6)
where γwater is the specific weight of water.
The theoretical volume of the slab-like block with rounded corners can be expressed in terms of Eq. (7).
where Δx is the thickness of the block, Δy is the height, and Δz is the breadth of the block. The volume in Eq. (7) is equal to the addition of volumes of seven rectangular prisms for the core of the block, twelve quarters of a cylinder for all edges and eight eighths of a sphere for all corners, being the size of all these geometrical figures dependent on the average curvature radius, \(r_{c}^{av}\). To compute this value, it is recommended to compute the volume by inputting Eq. (7) in a spreadsheet depending on \({r}_{c}^{av}\), and increasing values of \({r}_{c}^{av}\) starting from 0, to find the one that produces the computed volume in Eq. (6).
Coming back to the general stability against toppling of a block, some of the authors of this paper have studied the influence of regularly rough bases on the stability of typical slab-like blocks (Gui et al. 2023), an aspect that could be analytically incorporated into some of the stability estimates introduced in this text. The present approach can also be applied to blocks with more complex shapes, including realistic boulders (Pérez-Rey et al. 2019, 2021).
In both cases analyzed in this section, an implicit assumption is that the slab-like sample tested is parallel to the strike of the tilting plane, but this condition may not hold in nature.
Stability of a slab-like block with a base differently oriented than the tilting plane
As shown in Fig. 7, when the potential rotation axis of the block at stake is not parallel to the strike of the dip plane (in practice, the strike of the slope), but forms an angle γ with it, the component of the block weight parallel to the plane (W·sinα) will not fully contribute to toppling.

A single slab-like block resting on a platform where its orientation forms an angle γ with the platform strike line. Force decomposition based on the block weight
Only the part perpendicular to the rotation axis (W·sinα·cosγ) will act as toppling force. The part normal to the rotation axis (W·sinα·sinγ) will be counteracted by some friction in the block base. Therefore, in this case, the FoS against toppling of the block can be computed based on Eq. (8).
Then, the critical toppling angle for this case can be derived by equating Eq. (8) to 1, so Eq. (9) is derived:
If we consider the case in which the block presents round corners, as explained in the previous section, Eq. (9) now reads as Eq. (10) as derived from Eq. (5).
According to this mechanically sound approach, the impact of orientation on the toppling of a block can be relevant. To illustrate that, we have graphed the values of the FoS against toppling of two sharp-edged blocks with two slenderness (2 and 3) against the inclination or dip of the tilted base for different values of the rotation angle of the block γ marking the orientation. The graph of Fig. 8 presents these results.

Graph presenting the FoS against toppling for blocks with slenderness 3 and 2 respectively for different values of γ, according to the dip of the basal plane, as computed by means of Eq. (8). Increasing the value of γ, produces increasing stability
As this graph shows, a block with slenderness 3 would topple for an inclination angle of roughly 18.5°. However, if the block is rotated 20, 30, or 40° in relation to the basal plane strike, this toppling angle will increase to 19.3, 21, and 23.4°, respectively, therefore making the block more stable in these circumstances. Indeed, a block with slenderness 3 resting in an inclined 18.5° base will have FoS of 1.06, 1.15, and 1.3 for rotations of γ = 20, 30, and 40° respectively, instead of 1 and as the graph of Fig. 8 shows.
Similar increases in stability can be derived for the block with slenderness 2. Therefore, the authors deem important to account for these effects when the strike of the slope differs from that of the basal plane, even if for very small orientation variations (i.e., γ up to 10°) the influence is rather small, as implicitly recognized by Goodman and Bray (1976).
Experimental program
In the present section, a group of tilt tests involving plastic (3D-printed) and rock physical models was carried out in order to analyze the accuracy of the theoretical approach described in the previous sections. The effect of misalignment between the rotation axis of the block and the strike of the tilting plane has been replicated in the testing program herein presented for the physical models.
Tilt tests with 3D-printed blocks
First, the analytical approach was experimentally tested by resorting to two plastic blocks (one representative of the standard case with rather sharp corners, and the other one with rounded corners) both fabricated with a 3D printer. The dimensions of the block with straight corners were ∆xs = 40 mm, ∆ys = 120 mm, and ∆zs = 40 mm and, in the case of that with rounded corners, ∆xr = 80 mm, ∆yr = 100 mm, and ∆zr = 60 mm, with a radius of curvature, r = 20 mm, as presented in Fig. 9. Remark that for this block faces C and D are normal to axis x, and faces A and B are normal to axis y and faces 1 and 2 to axis z.

Diagrams and picture of the two blocks: a plastic block with square cross-section and straight corners; b, c two views of the block with rectangular cross-section and rounded corners and d picture of both plastic 3D printed blocks
To compute an estimative radius in the corners of the prismatic block depicted in Fig. 9 a, the authors have followed the procedure described in the “Basic previous studies” section. In this way, they measured the submersed and dry weight to compute its volume according to Eq. (6). Then, based on the measured dimensions and Eq. (7), an average curvature radius of 1.21 mm was computed, corresponding as explained in the “Basic previous studies” section to an operating radius r = 0.8 mm, equivalent to 2/3 of the average one as suggested by Alejano et al. (2015). The block toppling response is computed analytically and empirically for four scenarios for each block position, considering different orientations of the block (γ equal to 10°, 20°, 30°, and 40°). To orientate the block on the tilting platform, four dedicated plastic wedges were 3D printed, as shown in Fig. 10.

Test arrangement for a plastic block rotated γ degrees, and wedges used for positioning the block. Remark, once the block is positioned, the small plastic wedge is removed before starting to tilt the table
For the block with square base (Fig. 9a), it was possible to carry out eight groups of three tilt tests (one per each edge of the top (A) and bottom (B) block faces, Fig. 9a) for the four rotation angles
(γ), implemented through the corresponding plastic wedge. So, 32 groups of three tests were carried out for this block, whose average experimental critical toppling angles are presented in Table 2. Remark that for all the experimental tilt tests mentioned in this study, the presented result is the average of three tests, where experimental critical angles have been measured with an accuracy of 0.1°.
In Table 2, the experimental critical angle (\({\alpha }_{crit}^{{\text{exp}}.}\)) observed in every test group is also compared to the theoretical critical angle considering it a sharp-edged block (\({\alpha }_{crit}^{theor.}\)) as in Eq. (9) or a rounded corner block (\({\alpha }_{crit}^{theor.-r}\)) as in Eq. (10), for the estimated curvature radius r = 0.8 mm. To assess accuracy, the error is computed as the difference between the theoretical and the average experimental critical angles, in each case of sharp-edged and rounded corners.
The experimental results were also graphed (Fig. 11) against the theoretical ones for perfectly square corners or sharp-edged blocks (“without r”) and by considering the possible effect of slight rounding, by introducing a round corner (“with r”). A 1:1 line is provided for comparative purposes.

As this graph illustrates, the theoretical change in critical angle varies in some degrees according to the level of misalignment (γ). Remark that the average error for the sharp edge block theoretical approach is 0.7°, less than 1°, which is the typical measurement accuracy in the field. However, when considering the small possible curvature of the edges, the error becomes even smaller and close to 0°. In both cases, the standard deviation is around 0.46°, which means that 0.5° error can be associated to the irregularities of the edges, which are necessarily not too relevant in this 3D printed element.
The plastic block with rectangular cross-section and rounded edges (r = 20 mm) was also tested with its axis of rotation misaligned with that of the tilting table, by considering the four values of γ as previously explained. The geometrical features of this block make necessary the study of the testing positions in advance: as the block has a rectangular cross-section and rounded edges, it may not achieve some of the toppling scenarios studied for the case of the block with straight corners, resulting in a change of the axis of rotation when tilted, if certain values of γ are exceeded.
According to Fig. 9 b and c, these γ critical values (γcrit.) can be defined for the three possible positions, including the block toppling around x-axis with Eq. (11), the block toppling around y-axis with Eq. (12), and the block toppling around z-axis with Eq. (13).
Equation (13) means that if we try to topple the block rotating around axis z, it will eventually topple if γ is smaller than 26.6°. If γ is larger than this (i.e., γ = 30°), the block will topple around axis x, as illustrated in Fig. 12.

Illustration of tilt test of the plastic block rotating the tilt table around axis z for γ = 30°, with base in face A. Since the γ critical is exceeded, the block will topple around axis x of the sample, as the picture is showing
Adapting Eq. (10) to the geometry names given to this plastic block, we will obtain the corresponding critical angles for toppling according to the rotation axis and to basal face of the block applying Eq. (14). For the cases of rotating axis x and basal faces 1 and 2, rotating axis y and basal faces 1 and 2 and rotating axis z and basal faces C and D (see Fig. 9b, c), the computed critical toppling angle will be over 33° (larger than the measured friction angle), so in all these cases the block will tend to topple. This trend is due to the plumpness (small slenderness) of the block when orientated in these positions.
For the rest of the cases (rotating axis x and basal faces A and B, rotating axis y and basal faces C and D, and rotating axis z and basal faces A and B), the critical toppling angle is below 30°, so the block tends to topple.
For the case of rotation against axis z (basal faces A and B), as explained above, the critical γ value is 26.6°, so when γ is over this value, for example 30 or 40°, the block will topple around sample axis x, and the critical angle should be computed according to Eq. (15):
Results of tilt tests (every case the average of 3) comparing to theoretical solutions as in Eqs. (14) and (15), when needed, are presented in Table 3, where it is observed again how the theoretical and experimental changes in critical angle vary in some degrees according to the level of misalignment (γ). Remark that the average error for the 24 groups of three tilt tests is less than 0.6°, again smaller than the typical accuracy of field measurements with a similar value of standard deviation. Errors will tend to be somewhat larger when analyzing actual rock blocks in the field where the geometry is not so well controlled.
Results reported in Table 3 are graphed in Fig. 13. The plotted points fall quite close to the 1:1 line, representing the ideal case (experimental and theoretical results equal). As observed, theoretical results tend to be slightly higher than the experimental ones, something that can be attributed to imperfections in the block’s real shape due to the printing process.

Experimental critical toppling angles represented against theoretical critical toppling angles for a model with square cross-section and rounded corners, as determined from Eq. (11)
Comparison of experimental and theoretical results for this engineered block shows a good accuracy of the presented analytical approaches. Remark that average errors and most individual test errors are below 1°, which is the typical accuracy when measuring field discontinuity orientations.
Tilt tests with rock blocks
The experimental program was complemented with tilt tests carried out with rock blocks of various igneous and metamorphic rock types. Eight slab-like specimens with different dimensions were prepared, as shown in Fig. 14 a.

a Rock slabs used in the experimental program and position of the axes for determining ∆x, ∆y, and ∆z. b Arrangement of the specimen during the test: (i) Plastic wedge to ensure the angle of deviation from the axis of rotation of the tilting table (removed before starting the test); (ii) electronic inclinometer; (iii) rock plate for friction control (avoid sliding)
Mean width, height, and breadth (∆x, ∆y, and ∆z, correspondingly, as depicted in Fig. 14a) of each block were obtained by averaging three caliper measurements. Weights of the block dry and submersed permitted to obtain the dry density, and also the difference between actual and theoretical volumes (ΔV), so the average curvature radius, rcav, was also obtained by means of Eq. (7) for each block. These data are shown in Table 4.
The test arrangement is described in Fig. 14 b. For each test, the rock slab is positioned on the tilting table in contact with a rock plate. The block is rotated γ degrees with respect to the rotation axis of the table, ensuring an accurate position with the dedicated corresponding plastic wedge, which is removed later on, as done with the 3D-printed models described in the “Tilt tests with 3D-printed blocks” section. The platform is then swiftly tilted until toppling is observed. The critical experimental toppling angle (\(\alpha_{crit}^{\exp .}\)) of the block is registered and the average of three individual tests eventually computed.
The geometry of the rock blocks used in this study allowed only block rotations (γ values) in the range of 0° to 30°, to prevent the change of the axis of rotation, as previously explained. Results for all blocks are presented in Table 5, where a correction considering certain roundness of the block corners was applied, with r = 2/3 rcav, following recommendations presented by Alejano et al. (2018b).
The error Ea is computed as the difference between the theoretical and the experimental critical angle results, as presented in Table 4, both for straight and for rounded corners, with r = 2/3 rcav. The mean Ea for the case of straight corners is 2°, whereas for rounded corners lowers to − 0.68°, being the standard deviation around 1°. Again, when considering the curvature radius as a means to account for edge irregularity, the accuracy is below measurement field accuracy.
Following the line of previous tests, the experimental results are also plotted against the theoretical ones for all the studied rock blocks (Fig. 15), where a better fit of the results can be seen when the effect of rounding is taken into account (results are closer to the 1:1 line).

Experimental critical toppling angles represented against theoretical critical toppling angles for the eight studied rock models. Plotted are results compared with straight (blue) and rounded corners (red), with rc = 2/3 rcav
From these results, one can conclude that first, the effect of rounding on results improves the performance of the equations for analyzing block toppling behavior. Moreover, when the rotation of the block is taken into account, the new expression presented in Eq. 10 is able to accurately capture the toppling behavior of different 3D-printed plastic models and actual rock slab-like samples, for the range of γ values studied.
Application to multiple block toppling
The analysis of slope stability against general block toppling affecting some blocks has been traditionally founded on the limit equilibrium method–based approach proposed by Goodman and Bray (1976). This approach has been studied theoretically for varying parameters (Muralha 2002) and tested both with physical model studies including centrifuge tests (Zhang et al. 2007; Alejano et al. 2018b) and in the interpretation of actual cases (Wyllie 1980; Pritchard and Savigny 1991; Bye and Bell 2001; Alejano et al. 2010). Tatone and Grasselli (2010) developed a spreadsheet approach presenting an easy application of the Goodman and Bray (1976) approach, which was later implemented in a friendly user code developed by Rocscience (2021) named Roc-Topple.
Some authors have studied the limitations of this approach and provided ways to account for these limitations related to non-normality of blocks, occurrence of lateral separation surfaces, blocks with rounded corners, etc. (Cruden 1989; Liu et al. 2008; Brideau and Stead 2010; Alejano et al. 2018b; Cai et al. 2022).
In this section, we present the extension of the Goodman and Bray approach to the case where the base planes of the potentially toppling blocks present a different strike than that of the slope, being the difference γ. Remark this is an extension of the approach presented for the case of single blocks in the previous sections.
Authors of this paper prepared a scaled physical model of a typical block toppling case for the case of standard (sharp-edged) and rounded blocks (Alejano et al. 2018b). These models were tested on a tilting table following the procedure presented in more detail by Pérez-Rey et al. (2021) to compute the experimental critical angles, which sensibly coincide with those derived from the Goodman and Bray (1976) theoretical approach. Both groups of blocks and a regular stair-like surface were used to check the extended theoretical approach, which are presented in the following paragraphs.
The authors revisited the limit equilibrium block toppling stability analysis proposed by Goodman and Bray (1976) for sharp-edged blocks. These authors proposed the relevant computations regarding the estimate of the force that has to be applied to the lower face of block n to keep it stable against toppling Pn-1,t (Eq. 16) and against sliding Pn-1,s (Eq. 17) for the standard case. See Fig. 16 for a reference to the considered forces and angles.
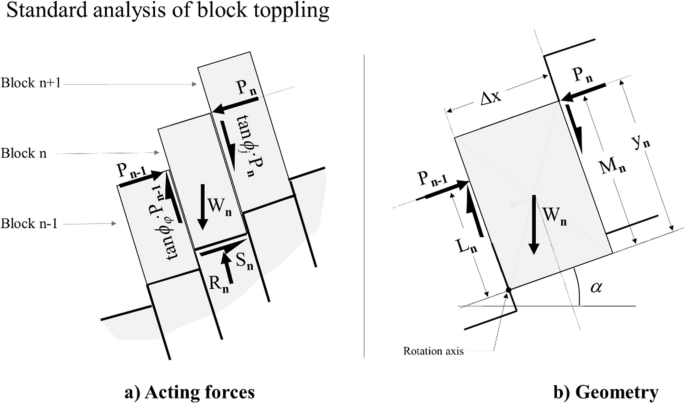
Geometry and forces acting on a standard block within the block toppling ones, modified from Goodman and Bray (1976)
Remark that Pn-1 refers to the force to be applied in the lower face of block n, which, according to the principle of reaction, will then be transmitted to the upper face of block n-1 (detailed information is presented in Goodman and Bray (1976)):
where ϕb and ϕj refer to the friction angle of the basal plane and lateral joints of the blocks at stake. Alejano et al. (2015) demonstrated that the impact of rounded corners on the sliding mechanism is negligible, so Eq. (16) still holds in this case. Nevertheless, the axis of rotation for every block for rounded-corner case moves towards the base of the block r (the radius of the rounded corner). Accordingly, Eq. (16) needs to be modified in this case to calculate the force necessary to prevent a block from toppling, producing Eq. (18) according to Alejano et al. (2018b):
If we consider now the case where the basal planes present a dip direction rotated γ in relation to that of the slope (or that of the tilting plane for the case of the physical models at stake), both Eqs. (16) and (17) must be updated to this contingency, and based on the individual analysis of Eq. (8) and Fig. 7, they become now Eqs. (19) and (20) for sharp-edged blocks:
Additionally, in the case of blocks with rounded edges for different orientation, this should be considered in the computations and even if Eq. (20) will still hold, Eq. (21) will substitute Eq. (19) in this case:
Equations (16) and (17) in the one hand and Eqs. (18) and (17) in the other, were tested by Alejano et al. (2018b) for the case of a physical model, which will also be used here. In what follows, we will extend this testing for the case of an orientation of the basal planes different than that of the slope; that is, we will check Eqs. (19) and (20), and (21) and (20), for the case of sharp-edged blocks and rounded blocks, respectively, by comparing physical model results to analytical ones.
Two groups of 10 sharp-edged and 10 round-cornered blocks each were initially prepared as described and presented in Alejano et al. (2018b) to physically represent a small physical model of a block toppling slope (Fig. 17a, b). Additionally, a stepped surface with steps of the same size of these blocks’ breadth was also prepared (Fig. 17c). Using this material and a tilting table, both assemblies were tilt tested (Fig. 17d, e) and results were reported by the mentioned authors.

Physical model images: a group of sharp-edged blocks, b group of round-edged blocks, c stepped base, d test of the assembly of sharp-edged blocks when toppling, e test of the assembly of rounded blocks when toppling, and f geometry and parameters, where α refer to the tilt table dip
In this study, and with the aim of ensuring reproducibility, the geometries produced by these assemblies are measured and fit for the simplest case (sharp-edged blocks oriented normal to the tilting table rotation axis) that can be computed by means of a standard Goodman and Bray approach and therefore also by means of the program Roc-Topple (Rocscience 2021). This geometry in the form of angles is represented in Fig. 17 f. Other relevant parameters include the width of the block Δx, its specific weight, and the friction angles of the contacts between blocks, and between block bases and wood of the stepped surface. All these values are presented in Fig. 17 f. Remark that the friction angle of the bases (contact granite-wood) varies significantly from the sharp-edged blocks (less friction) to the rounded blocks (more friction). For the case of the rounded blocks, the average operating radius, r, has been computed to be 2.09 mm following the procedure described in the “Basic previous studies” section.
Based on these geometries and always for the standard case, by inputting the corresponding parameters and varying the inclination of the tilting table (α), we have looked for the value of αcrit. that produces the instability of the assembly. This value corresponds to a FoS < 1.00 (FoS = 0.999 in this case), which according to Roc-Topple (Fig. 18) and to a spreadsheet prepared by the authors with the pertinent calculations corresponds to an inclination angle α = 18.75° that will basically coincide with the observed critical angle. The same result is obtained with a dedicated Excel sheet implementing the standard Goodman and Bray’s (1976) approach, which will be later adapted to the cases to be studied, including round corners and different orientations of table and planes according to Eqs. (19) to (21).

Results and images of the application of the program Roc-Topple to the case of the assembly of sharp edge blocks for α = 18.75°, indicating instability (FoS < 1). Remark that in this case, due to geometry constraints 14 blocks appear, but the last six ones remain stable, which coincides mechanically with the ten blocks of the model with the two higher ones stable. It is relevant to note that minor changes in geometry may produce important variations on the FoS
Once checked, these results in line with those obtained by Alejano et al. (2018b) and specifically for this study, both assemblies have been tilted, locating them forming γ angles of 0° (standard case as tested in 2018b), 10°, 20°, and 30° respectively in relation to the axis of rotation of the tilting table by means of plastic wedges, as illustrated for two cases in Fig. 19.

Assemblies of blocks ready to be tilt tested. a Sharp-edged group rotated 30° in relation with the axis of rotation of the tilting table and b rounded edge assembly rotated 20° in relation with the tilt table rotation axis
The average angles (based on three tilt tests) at which instability was observed for every type of tests are presented in Table 6. Also included are the corresponding critical angles analytically derived based on the corresponding Eqs. (16) to (21) implemented in Goodman and Bray’s (1976) approach by means of different dedicated spreadsheets for the cases of standard and rotated (10, 20, and 30°) assemblies, for sharp-edged and rounded blocks. In particular, for the sharp-edged case without rotation (γ = 0°), the Goodman and Bray (1976) approach was used (Eqs. 16 and 17). For the round corner case non-rotated (γ = 0°), the approach by Alejano et al. (2018b) was resorted to (Eqs. 18 and 17). For the rotated cases, the approach presented in this study is used. In this way, for sharp-edged rotated cases (γ = 10 to 30°), Eqs. (19) and (20) were used, and for the equivalent round-edged cases, Eqs. (21) and (20) were resorted to.
The errors taken as the difference between the critical angle obtained from experiments and from the analytical approach are also included in Table 6, showing values in the range of − 0.2° to 0.6°, which can be considered rather accurate in rock engineering terms. Also, the difference in critical angles for the sharp-edged and rounded assemblies are tabulated for each case, being around 2° in average.
As an indicative example, if we are analyzing in practice a case with the orientation of the base planes rotated 30° in relation to the slope, it will be generally more stable (2.5° steeper critical angle) than the standard case (equal orientation) as derived from the values of critical angles obtained for γ = 30° and 0° (standard case), respectively.
The presented results put forward the fact that neglecting a possible misalignment of the main toppling prone block forming a joint set with the slope strike may produce (conservative) changes in the estimate of the critical angle or the FoS obtained (one to some tenths of unit). So it is recommended to apply this corrected approach, when analyzing the stability of these types of slopes. Indeed, the range of application of the method presented widely exceeds the more stringent assumptions required for a rigorous application of the Goodman and Bray’s (1976) method.
Examples of these slopes include for instance, the eastern slope of the Meirama mine (NW Spain) where toppling related problems were reported (Bassa et al. 2014) or the slopes prone to toppling of the Melbur Pit in Cornwall (Vanneschi et al. 2019), where the basal planes are misaligned in relation to slope faces. This would be a more rigorous but less conservative approach. It is obviously better to have an accurate computation method. For slope design purposes, the FoS used will be decided by the engineer based on experience, knowledge and reliability of available data, assumptions, and used approach.
Conclusions
In this study, the authors revisit the equation for stability analysis against toppling of single block blocks with straight edges and with rounded edges. These equations do not take into account the possible deviation (γ) between the dip direction of the slope and that of the basal plane of the potentially toppling block. An updated version of this equation is proposed, by including the aforementioned deviation (γ). Analytical results estimated with this equation are comparable with those observed from physical models of blocks tilted in the laboratory.
Furthermore, it has been observed that the results obtained by means of the equation considering a certain rounding of the edges better fit with the experimental ones obtained with test specimens without previous artificial alteration (apparently, straight edges). In this line, the geometric defects (parallelism between faces or defects on the edges and corners) attributed to the cutting process can be represented by means of a positive radius of curvature. The relationship r = 2/3·rcav considered has shown to reasonably represent average results with sufficient accuracy.
The formulation has been extended to the case of block toppling, complementing classic approaches, for scenarios where the basal planes of the blocks are rotated with respect to the slope strike. Physical tilt tests of convenient sharp-edged and rounded block assemblies have demonstrated that the formulations herein presented are appropriate to obtain reasonably accurate results of critical toppling angles.
Both for single and multiple block toppling, it is seen that when the orientation of the basal planes deviates up to 10° or 15°, the results are scarcely affected, but when this strike difference is over 20°, the results of critical angle or factor or safety can be relevantly affected. Such consideration could be appropriate to fine-tune stability analysis of precariously balanced rock boulders.
Even if previous studies have analyzed altogether the role of different orientation parameters (rear, basal, and lateral surface of toppling blocks) and lateral release surfaces, the presented approach allows to analyze, independently and in a rigorous manner, the relevant influence of the orientation of the basal plane. This can be of help to individuate the different impacts on the stability of various geometrical and geomechanical features. Moreover, the orientation of the foliation planes is relevant too for flexural toppling cases, where cracks will tend to open normally to these planes, so an extension of this approach could also contribute to analyze such cases in a more rigorous manner.
References
Adhikary DP, Dyskin AV, Jewell RJ, Stewart DP (1997) A study of the mechanism of flexural toppling failure of rock slopes. Rock Mech Rock Eng 30(2):75–93. https://doi.org/10.1007/BF01020126
Alejano LR (2021) Considerations on failure mechanisms of rock slopes involving toppling. IOP Conf Ser Earth Environ Sci 833(1):1. https://doi.org/10.1088/1755-1315/833/1/012004
Alejano LR, Carranza-Torres C, Giani GP, Arzúa J (2015) Study of the stability against toppling of rock blocks with rounded edges based on analytical and experimental approaches. Eng Geol 195:172–184. https://doi.org/10.1016/j.enggeo.2015.05.030
Alejano LR, Gómez-Márquez I, Martínez-Alegría R (2010) Analysis of a complex toppling-circular slope failure. Eng Geol 114(1–2):93–104. https://doi.org/10.1016/j.enggeo.2010.03.005
Alejano LR, Muralha J, Ulusay R, Li CC, Pérez-Rey I, Karakul H, Chryssanthakis P, Aydan Ö (2018a) ISRM suggested method for determining the basic friction angle of planar rock surfaces by means of tilt tests. Rock Mech Rock Eng 51(12):3853–3859. https://doi.org/10.1007/s00603-018-1627-6
Alejano LR, Sánchez-Alonso C, Pérez-Rey I, Arzúa J, Alonso E, González J, Belmonte L, Ferrero AM (2018b) Block toppling stability in the case of rock blocks with rounded edges. Eng Geol 234:197–203. https://doi.org/10.1016/j.enggeo.2018.01.010
Alejano LR, Veiga M, Pérez-Rey I, Castro-Filgueira U, Arzúa J, Castro-Caicedo ÁJ (2019) Analysis of a complex slope failure in a granodiorite quarry bench. Bull Eng Geol Environ 78(2):1209–1224. https://doi.org/10.1007/s10064-017-1160-y
Ashby JP (1971) Sliding and toppling modes of failure in models and jointed rock slopes. Dissertation, University of London
Aydan Ö, Shimizu Y, Ichikawa Y (1989) The effective modes and stability of slopes in rock mass with two discontinuity sets. Rock Mech Rock Engng 22:163–188. https://doi.org/10.1007/BF01470985
Bassa CM, Oyanguren PR, Philippon RG, Fernández-Pello LM (2014) The toppling of large blocks on the northeast slope of the Meirama mine. ISRM Regional Symposium - EUROCK 2014 (Vigo, Spain): 731–736
Braathen A, Blikra LH, Berg SS, Karlsen F (2004) Rock-slope failures in Norway; type, geometry, deformation mechanisms and stability. Norwegian J Geol 84(1):67–88. https://doi.org/10.17850/NJG96-3-03
Brideau MA, Stead D (2010) Controls on block toppling using a three-dimensional distinct element approach. Rock Mech Rock Engng 43(3):241–260. https://doi.org/10.1007/s00603-009-0052-2
Brideau MA, Stead D (2012) Evaluating kinematic controls on planar translational slope failure mechanisms using three-dimensional distinct element modelling. Geotech Geol Eng 30:991–1011. https://doi.org/10.1007/s10706-012-9522-5
Bye AR, Bell FG (2001) Stability assessment and slope design at Sandsloot open pit, South Africa. Int J Rock Mech Min 38(3):449–466. https://doi.org/10.1016/S1365-1609(01)00014-4
Cai JC, Zheng D, Ju NP, Huang RQ, Zhao WH (2022) Boundary effect of toppling failure based on three-dimensional mechanical model. J Mt Sci 19(11):3314–3322. https://doi.org/10.1007/s11629-022-7337-2
Cruden DM (1989) Limits to common toppling. Can Geotech J 26(4):737–742. https://doi.org/10.1139/t89-085
De Freitas MH, Watters RJ (1973) Some field examples of toppling failure. Géotechnique 23(4):495–513. https://doi.org/10.1680/geot.1973.23.4.495
Dong ML, Zhang FM, Lv JQ, Hu MJ, Li ZN (2020) Study on deformation and failure law of soft-hard rock interbedding toppling slope base on similar test. Bull Eng Geol Environ 79(9):4625–4637. https://doi.org/10.1007/s10064-020-01845-4
Goodman RE (1975) Methods of geological engineering in discontinuous rocks. West Publishing, New York
Goodman RE, Bray JW (1976) Toppling of rock slopes. Proceedings of the Specialty Conference on Rock Engineering for Foundations and Slopes, vol 2. ASCE Boulder, Coforado/Angust 15-18, pp 201–234
Goodman RE, Kieffer DS (2000) Behavior of rock in slopes. J Geotech Geo-Environ Eng 126(8):675–684. https://doi.org/10.1061/(ASCE)1090-0241(2000)126:8(675)
Gui JY, González-Fernández MA, Estévez-Ventosa X, Song F, Alejano LR (2023) Toppling susceptibility of a single rock block resting on a regularly rough base. Eng Geol 313:106982. https://doi.org/10.1016/j.enggeo.2022.106982
Hoek E, Bray JW (1974) Rock slope engineering. Institution of Mining and Metallurgy, London
Jia L, Cai J, Wu L, Qin T, Song K (2023) Influence of fracture geometric characteristics on fractured rock slope stability. Appl Sci 13(1):236. https://doi.org/10.3390/app13010236
Kimber OG, Allison RJ, Cox NJ (1998) Mechanisms of failure and slope development. T I Brit Geogr 23(3):353–370. https://doi.org/10.1111/j.0020-2754.1998.00353.x
Liu CH, Jaksa MB, Meyers AG (2008) Improved analytical solution for toppling stability analysis of rock slopes. Int J Rock Mech Mining Sci 45(8):1361–1372. https://doi.org/10.1016/j.ijrmms.2008.01.009
Muralha J (2002) Probabilistic analysis of toppling failure in rock slopes. ISRM International Symposium–EUROCK 2002 (Madeira, Portugal): 187–196.
Pérez-Rey I, Alejano LR, Riquelme A, González-deSantos L (2019) Failure mechanisms and stability analyses of granitic boulders focusing a case study in Galicia (Spain). Int J Rock Mech Mining Sci 119:58–71. https://doi.org/10.1016/j.ijrmms.2019.04.009
Pérez-Rey I, Muñiz-Menéndez M, González J, Vagnon F, Walton G, Alejano LR (2021) Laboratory physical modelling of block toppling instability by means of tilt tests. Eng Geol 282. https://doi.org/10.1016/j.enggeo.2021.105994
Priest SD (1993) Discontinuity Analysis for Rock Engineering. Chapman & Hall, London
Pritchard MA, Savigny KW (1991) The Heather Hill landslide, an example of a large scale toppling failure in a natural slope. Can Geotechn J 28:410–422. https://doi.org/10.1139/t91-051
Rocscience, (2021) RocTopple 10 Toppling stability analysis. Rocscience, Toronto
Romana M (1985) New adjustment ratings for application of Bieniawski classification to slopes. Proc Int Symp on the Role of Rock Mechanics: 49–53
Sagaseta C (1986) On the modes of instability of a rigid block. Rock Mech Rock Engng 19(2):261–266. https://doi.org/10.1007/BF01039998
Sagaseta C, Sánchez JM, Canizal JA (2001) General analytical solution for the required anchor force in rock slopes with toppling failure. Int J Rock Mech Mining Sci 38(3):421–435. https://doi.org/10.1016/S1365-1609(01)00011-9
Singh J, Pradhan SP, Singh M, Hruaikima L (2022) Control of structural damage on the rock mass characteristics and its influence on the rock slope stability along National Highway-07, Garhwal Himalaya, India: an ensemble of discrete fracture network (DFN) and distinct element method (DEM). Bull Eng Geol Environ 81(3):96. https://doi.org/10.1007/s10064-022-02575-5
Tang H, Yong R, Ez Eldin MAM (2017) Stability analysis of stratified rock slopes with spatially variable strength parameters: the case of Qianjiangping landslide. Bull Eng Geol Environ 76(3):839–853. https://doi.org/10.1007/s10064-016-0876-4
Tatone BSA, Grasselli G (2010) ROCKTOPPLE: a spreadsheet-based program for probabilistic block-toppling analysis. Comput Geosci 36(1):98–114. https://doi.org/10.1016/j.cageo.2009.04.014
Vanneschi C, Eyre M, Venn A, Coggan JS (2019) Investigation and modeling of direct toppling using a three-dimensional distinct element approach with incorporation of point cloud geometry. Landslides 16(8):1453–1465. https://doi.org/10.1007/s10346-019-01192-w
Wyllie DC (1980) Toppling rock slope failures examples of analysis and stabilization. Rock Mech 13:89–98. https://doi.org/10.1007/BF01238952
Wyllie DC (2017) Rock slope engineering: civil applications, 5th edn. Florida, Boca Raton
Wyllie DC, Mah CW (2004) Rock slope engineering, Civil and Mining 4th London and New York
Zhang JH, Chen ZY, Wang XG (2007) Centrifuge modeling of rock slopes susceptible to block toppling. Rock Mech Rock Engng 40(4):363–382. https://doi.org/10.1007/s00603-006-0112-9
Acknowledgements
The first author Jingyun Gui acknowledges China Scholarship Council (CSC) for her stay at the University of Vigo by means of a CSC grant number 202106560049. The first and third authors acknowledge the general directorate of Science and Research of the autonomous community of Generalitat Valenciana, Spain, for partially funding this study as part of the project awarded under Contract Reference No. CIAICO/2021/335 related to potential degradation of rock slopes in heterogeneous formations. The last author, Ignacio Pérez-Rey, acknowledges Xunta de Galicia for financing his research through a grant contract aimed at facilitating the postdoctoral training stage at the University of Vigo (Spain), and expresses his gratitude to the Division of Soil and Rock Mechanics at KTH Royal Institute of Technology for hosting him during his research stay. Funding for open access charge: Universidade de Vigo/CRUE-CISUG.
Funding
Open Access funding provided thanks to the CRUE-CSIC agreement with Springer Nature.
Author information
Authors and Affiliations
Corresponding author
Ethics declarations
Conflict of interest
The authors declare no competing interests.
Rights and permissions
Open Access This article is licensed under a Creative Commons Attribution 4.0 International License, which permits use, sharing, adaptation, distribution and reproduction in any medium or format, as long as you give appropriate credit to the original author(s) and the source, provide a link to the Creative Commons licence, and indicate if changes were made. The images or other third party material in this article are included in the article's Creative Commons licence, unless indicated otherwise in a credit line to the material. If material is not included in the article's Creative Commons licence and your intended use is not permitted by statutory regulation or exceeds the permitted use, you will need to obtain permission directly from the copyright holder. To view a copy of this licence, visit http://creativecommons.org/licenses/by/4.0/.
About this article

Cite this article
Gui, JY., Alejano, L.R., Cano, M. et al. Analytical and experimental studies on toppling behavior of blocks misaligned with the slope face. Bull Eng Geol Environ 83, 153 (2024). https://doi.org/10.1007/s10064-024-03643-8
Received:
Accepted:
Published:
DOI: https://doi.org/10.1007/s10064-024-03643-8