
Abstract
Uncertainties arising at different stages of a measurement process can be estimated using analysis of variance (ANOVA) on duplicated measurements. In some cases, it is also desirable to calculate confidence intervals for these uncertainties. This can be achieved using probability models that assume the measurement data are normally distributed. However, it is often the case in practice that a set of otherwise normally distributed measurement values is contaminated by a small number of outlying values, which may have a disproportionate effect on the variances calculated using the ‘classical’ form of ANOVA. In this case, robust ANOVA methods are able to provide variance estimates that are much closer to the parameters of the underlying normal distributions. A method using bootstrapping to calculate confidence intervals from robust estimates of variances is proposed and evaluated and is shown to work well when the number of outlying values is small. The method has been implemented in a visual basic program.
Introduction
The importance of the estimation of measurement uncertainty, including the uncertainty from sampling, by either modelling or empirical methods, is now well established [1]. One empirical method, recommended because of its cost-effectiveness and simple application, is the duplicate method. In this method, the processes of sampling and analysis are duplicated following pre-determined protocols applied to a number of different sampling targets. This allows the variances at each of these two stages to be separated and estimated by analysis of variance (ANOVA).
In some cases, it is useful for the analyst or researcher to quantify the reliability of variance estimates, expressing this reliability as confidence intervals for the variance estimates from the ANOVA. For example, the researcher might estimate uncertainties of measurements on the same targets using more than one analytical method. Confidence limits (i.e. the extremes of the confidence interval) on these uncertainties would indicate whether the uncertainty estimates themselves were significantly different between different analytical methods. A further potential application is the comparison of analyte heterogeneity in materials, which can also be estimated using the duplicate method [2].
The uncertainties and CI’s can be estimated using a probability model, if the nature of the distribution of measurements can be assumed. An example of this approach is provided by Lyn et al. [3]. This study demonstrated two important characteristics of uncertainties estimated by the duplicate method:
-
1.
As would be expected, the width of the confidence intervals around the uncertainty estimates decreases as the number of sampling targets (n) increases.
-
2.
It is suggested that for many applications the decrease in widths of the confidence intervals obtained when n > 8 may not justify the costs of obtaining the additional duplicated measurements.
In this case, the validity of estimates of the uncertainties and their CI’s from the classical ANOVA method depends on the assumption that the data are normally distributed. However, many data sets obtained by experiment contain a small proportion of outlying values that may have a disproportionately large effect on these estimates. One solution to this problem is the use of robust statistical methods, where estimates are adjusted to accommodate up to 10 % of outlying values [4]. Robust ANOVA has been widely used for the estimation of measurement uncertainty, especially that arising from the primary sampling process [5, 6].
Previously, there has not been a method available to calculate the confidence interval on a value of uncertainty estimated using robust ANOVA. The overall purpose of this paper is to propose such a method, using a bootstrapping approach, applied with a new computer program CI-RANOVA, and to evaluate its performance for both normal and contaminated data. One practical problem with doing this arises from the fact that CI-RANOVA is, for ease of use by the analytical community, implemented in Excel. This is fine for routine use but too slow to permit the extensive simulations needed to accurately estimate coverage probabilities for the confidence intervals. To enable this to be done, the method was also implemented in Matlab. Having two independent, in the sense that they were coded on different platforms by different programmers, implementations also enabled a validation of the CI-RANOVA coding, and to this end simulations were run using both versions.
The objectives of this work are as follows:
-
1.
Validate the confidence limits produced by a bootstrapping method against those calculated by analytical (mathematical) formulas from the results of a classical ANOVA, using multiple simulations of normally distributed data.
-
2.
Validate the implementation of the bootstrapping method in CI-RANOVA, by comparing the confidence limits produced by CI-RANOVA with those produced by the Matlab implementation.
-
3.
Validate the bootstrapping method applied by CI-RANOVA when up to 10 % outlying values are included.
The analytical method for estimating CI’s is shown in the next section, with examples of its application to normally distributed data and further demonstrating the breakdown of the method when outliers are present. The bootstrapping method for estimating CI’s is described in the “Methods” section. The “Results” section is in three parts: (1) validation of the bootstrapping method with normally distributed data (uncontaminated by outliers); (2) validation of the Excel implementation (CI-RANOVA); (3) further validation of the bootstrapping method with data that include outlying values.
The duplicate method and the analysis of the resulting data by classical ANOVA
The simplest form of the full three-tiered balanced experimental design is illustrated in Fig. 1. A number of sampling targets (n) are chosen at random, where ideally n ≥ 8 [3], from a wide selection of such targets. Two samples are acquired from each of these targets by independent duplication of the sampling protocol. These two samples are then treated individually and are both subjected to the same preparation procedures. Two test portions are then drawn from each of these test samples and analysed individually. This method enables variance estimates to be extracted by ANOVA for each of the following levels:

The simplest form of the fully balanced experimental design for the evaluation of measurement uncertainty with n targets Ti where 1 <= i <= n. The fully balanced design requires a minimum of two samples per target and two analyses per sample (referred to as an n × 2 × 2 experimental design)
-
1.
Between-target variance;
-
2.
Between-sample variance;
-
3.
Between-analysis variance (an estimate of analytical repeatability).
The method is described in more detail in the Eurachem guide [1].
If the variability at each of these three levels can be assumed to be normally distributed, then a confidence interval at the bottom (analysis) level can be derived from a Chi-squared distribution, and Williams [7] provides a method of calculating approximate confidence limits at the top 2 (target and sample) levels. Details can be found in Graybill [8]. The equations below give the confidence intervals for a nested experimental design of size I × J × K where I is the number of targets, assumed to be drawn from a normal distribution with mean µ and variance \(\sigma_{\text{Target}}^{2}\), J is the number of samples per target, with sampling variance \(\sigma_{\text{Sample}}^{2}\), and K is the number of analyses per sample, with analytical variance \(\sigma_{\text{Analysis}}^{2}\). MSSample is the mean square of the middle (sampling) level from the ANOVA. A circumflex denotes an estimate, e.g. \(\hat{\sigma }_{\text{Target}}^{2}\) is an estimate of the target variance.
Fp, ν1, ν2 is the inverse cumulative distribution function (cdf) of the F probability distribution with degrees of freedom ν1,ν2 for a probability p, and χ 2p,ν is the inverse cdf of the Chi-squared distribution with degrees of freedom ν for probability p.
Target level
Sample level
Analysis level
These equations give confidence intervals for variances. To obtain intervals for the standard deviations, as reported below, one simply takes the square root of each of the limits of the intervals for the variances. At the target and sample levels, the ANOVA estimates of variance are obtained by subtraction, and it is possible for the lower limits or even the variance estimates themselves to be negative. The standard practice of replacing negative estimates or confidence limits by zero, given that the true value of the variance cannot possibly be in the negative part of the interval, is followed here.
A numerical example showing the effect of an outlier
The data in Table 1 were simulated using normal distributions with input parameters µ = 26.3, σTarget = 8.9, σSample = 3.0, σAnalysis = 1.2.
The classical ANOVA has produced estimates close to the true values of the standard deviations, and the confidence intervals include these true values, as they should do in 95 % of examples.
Table 2 shows the same simulated data but with the inclusion of 1 large outlying value in the final position (Target number 10, S2A2). It can be seen that this single analytical outlier has had a large effect on both the variances calculated by classical ANOVA and the associated confidence limits. These are no longer representative of the bulk of the data and differ significantly from the input parameters used in the original simulation.
An alternative is to use Robust ANOVA. In brief, the robust mean µr is initially estimated as the classical mean, and the robust standard deviation σr as the median of the absolute differences between duplicated measurements. Any values that are found to exceed µr + c σr are replaced with µr + c σr, and any values that fall below µr − c σr are replaced with µr − c σr, where c is a factor between 1 and 2 (typically set to 1.5). The robust statistics µr and σr are then recalculated, and the process is repeated multiple times, until µr converges to an acceptable level of accuracy [4]. Robust ANOVA on the data in Table 2 using the program RANOVA2 [9] yields the following results: \(\hat{\sigma }\)Target = 9.8, \(\hat{\sigma }_{{{\text{Sampling}}}} = 4.3\), \(\hat{\sigma }\)Analysis = 1.1. These are much closer to both the input parameters and also to the standard deviations calculated by classical ANOVA on the original normal data (Table 1). They are also more representative of the main body of data in Table 2 than those calculated using classical methods. The high value outlier in this example is the original value (39.9) multiplied by 10 and demonstrates the ability of robust ANOVA to cope with extreme outliers that might be encountered from, for example, a transcription error. Ideally, values resulting from this type of mistake would not be included in uncertainty estimation [10], but practically they are not always identified and corrected or removed.
An extreme outlying value such as shown in Table 2 needs serious consideration. Its presence and the method used to treat it should be reported. The presence of such an outlying value may affect the inferences drawn from the experiment. Less extreme outlying values can occur for a number of reasons, e.g. deficiencies in the experimental method, operator error, or a simple typing error. They might also be due to genuine variations in the property being measured and should not be ignored. One potential use of robust statistics in this application is to draw attention to the presence of outliers in experimental data. For example, the difference between the robust and classical standard deviations derived from the data in Table 2 is a clear indication that these data are not normally distributed, and one or more outlying values may be present.
Robust ANOVA provides reasonable estimates of the underlying variances, i.e. the variances of the “good” data, in data that include a small proportion of outlying values. It can be easily applied using the program RANOVA2 [9]. However, the calculation of confidence intervals in the context of a robust ANOVA is far from straightforward. It cannot be achieved via formulas based on assumed probability distributions, because it is precisely when these assumptions break down that we need to use the robust approach. An alternative is to use bootstrapping methods. In this computer-based approach, a large number B of independent bootstrap samples are generated. A bootstrap sample is a data set, of the same size and structure as the observed one, generated by random sampling with replacement from the observed data set. The statistic of interest (e.g. a variance) is calculated for each bootstrap sample. Confidence intervals can then be derived from the empirical distribution of these results [11].
Method: Estimating confidence limits on variances from robust ANOVA
The existing program RANOVA2 [9] was modified to provide confidence intervals on variances calculated by both classical and robust ANOVA. It is intended that the new program CI-RANOVA will also be made available on the AMC website.
The data simulation, robust ANOVA and CI estimation were reproduced in Matlab software supplied by MathWorks. This is much more efficient than Excel when processing multiple data arrays, allowing a greater number of simulations to be created and analysed within a practical time frame, and in particular allowing the accurate estimation of coverage probabilities, requiring 50 000 simulations. Versions of the two programs were produced independently by different researchers based in different institutions.
Both programs calculate confidence limits on variances produced by classical ANOVA using a mathematical method based on Eqs. (1) to (3). Confidence limits on the variances produced by robust ANOVA are estimated using a bootstrapping method. During development, a problem was encountered if a large number of bootstrap samples are generated on data containing outlying values. The bootstrapping method generates samples by selecting means and differences (at every level) at random with replacement. Some of these bootstrap samples therefore contain fewer outliers than the original data set, while some contain more. When a large number (e.g. B = 2000) of bootstrap samples are generated, some of these samples are likely to contain many repetitions of very large outlying differences. The robust routines used in RANOVA2 are only intended to accommodate up to 10 % of outlying values. It was found in practice that a small proportion of the bootstrap samples includes too many large outlying differences for the robust ANOVA to cope with. For this reason, a winsorization process (Fig. 2) was incorporated into both programs. This is applied to the input data matrices after the initial robust analysis but prior to generating the bootstrap samples.
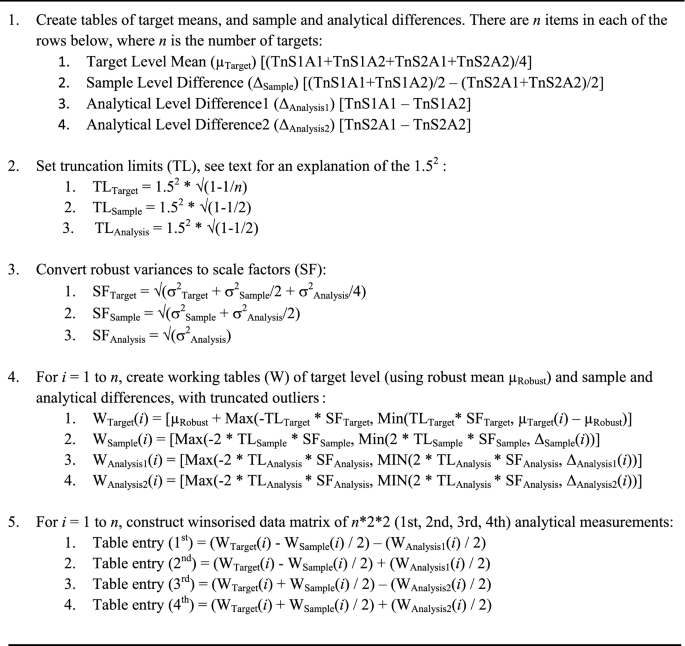
Winsorization process used to limit the effect of multiple occurrences of outlying observations prior to bootstrapping, for an n * 2 * 2 experimental design (See Fig. 1)
The winsorization process brings in large outliers in a very similar way to how they are dealt with in the robust analysis, but using wider limits. The idea, due to [12], is that this will change the results of the robust analysis very little, because the outliers are still outside the limits used in that analysis, but it will limit the damage that they can cause when they occur in large numbers and in particular will avoid the breakdown of the robust analysis that can occur in this situation. The limit used here, as suggested by Singh [12], is 1.5 times the limit used in the robust analysis, which itself is 1.5 [4], hence the 1.52 in the algorithm in Fig. 2.
An example of the winsorization process is shown in Table 3. In this case, the bootstrapping method randomly produced three top-level outlying values on rows 1, 2 and 4 (Table 3a), even though the input data (from Table 2) included only 1 outlying value. This results in a spuriously high robust estimate of the target standard deviation, due to breakdown of the robust algorithm. Applying the winsorization method prior to robust ANOVA reduces the magnitude of the outlying values sufficiently that they can be accommodated by the robust algorithm (Table 3b). Note that all other data values and standard deviations remain unchanged.
Following winsorization, a large number B of bootstrap samples (B = 2000) are generated. The method of producing the bootstrap samples for an n * 2 * 2 experimental design (Fig. 1) is detailed in Fig. 3.

The procedure used to generate bootstrap samples for an n * 2 * 2 experimental design (See Fig. 1)
Variances are calculated for each of the B bootstrap samples using robust ANOVA. The variance at the target (top) level needs to be multiplied by n/(n − 1) to compensate for a bias caused by sampling with replacement from the n targets [11]. The bootstrap samples at the lower levels were based on the differences, so no such correction is needed for the other two variances. The variances for each level are sorted into numerical order. The 2.5 and 97.5 percentiles of the sorted variances could then be considered as bootstrap estimates of the 95 % confidence limits. However, this simple approach is known not to work particularly well for skewed distributions, especially when the data being bootstrapped are small, and Efron and Tibshirani [11] recommend what they call the Bca method in this case. This is described in Fig. 4, where the constant a has been chosen to optimise the procedure for the Chi-squared distributions that one would expect to see with normally distributed data.

Bca (Bias-corrected and accelerated) correction for 95 % confidence limits
Validation of the bootstrapping method was performed by simulating 50 000 normally distributed data sets based on five input parameters: (a) the number of targets n; (b) the mean target value µTarget; (c) between-target standard deviation σTarget; (d) between-sample standard deviation σSample; (e) between-analyses standard deviation σAnalysis. In the case of contaminated data, outliers were introduced at one of the three levels in each simulation. These were created by randomly selecting a target or targets from the normally distributed data sets and adding a constant, in this case 500, to either all four measurements for that target, or both measurements for one of its samples, or one single analytical measurement (similar to the method described by Ramsey et al. [5]). Tests were also performed to investigate the effects of different severities of the outlying value by varying the magnitudes of the added constant between 0 and 1000. An example data set (n = 20) with all three types of contamination is shown in Table 4.
Results and discussion
The underlying calculations, including the averaging of the results of different simulations, were performed using variances, because variances from classical ANOVA are unbiased estimators of the population variances, whereas their square roots are not unbiased estimators of the corresponding standard deviations. However, the tables in this section present the results as standard deviations because these have the same units as the original data and are more readily interpretable.
Objective 1: Validation of the bootstrap confidence intervals with normally distributed data
Validation of the bootstrapping method of estimating confidence limits at three different levels was performed by comparison with those produced by the mathematical method. Two values of n were used (n = 10 and n = 100). For each n, variances and confidence intervals were estimating using the Matlab program, with B set to 2000. This allowed 50 000 simulated data matrices to be analysed in a practical time frame to give coverage probabilities accurate to approximately 0.1 %. Coverage percentages were estimated by counting the number of times the CI contained the true value of the input parameter. Input parameters were the same for all simulations, based on real values from experimental data (Table 5). Results of these trials are shown in Table 6 (n = 10) and Table 7 (n = 100).
For both n = 10 and n = 100, the means and component standard deviations at the three different levels calculated by classical ANOVA are good approximations of the input parameters. For n = 10, the component standard deviations calculated by robust ANOVA are slightly higher than the true values, especially at the two upper levels (Table 6). This is a consequence of the approximations involved in the bias correction of the robust estimates in the case of the simultaneous estimation of both mean and variance.
The coverage probabilities calculated by the mathematical method in Tables 6 and 7 are close to the expected 95 %, although in most cases they appear to be slightly conservative: the intervals are a little wider than is required for true 95 % confidence. With n = 10, the intervals calculated using the bootstrapping method are too narrow resulting in < 95 % coverage (Table 6). This is consistent with previous findings where bootstrapping methods have been applied to estimate confidence intervals on variances (See p. 181–183 in [11]). For n = 100, these coverage percentages are very close to the expected 95 % (Table 7), indicating that a higher value of n enables better estimates of the confidence intervals on the component standard deviations.
Objective 2: Validation of the implementation using CI-RANOVA with a smaller number of simulations
The same trials were performed with CI-RANOVA using a smaller number (1000) of simulated data matrices (Tables 8, 9). It is not possible to calculate precise coverage percentages with this number of simulations; however, comparison of the CI’s with those in Tables 6 and 7 shows there is good agreement between the two programs.
Objective 3: Validation of the robust confidence intervals on data including outliers
Further simulations were created with outlying values added to the data. Outlying values were generated using the three scenarios shown in Table 4. Each outlying value was applied by randomly selecting a target (without replacement), and adding 500 to the original simulated value(s) to create one or more extreme outlier(s). Each independently simulated data matrix was then analysed using CI-RANOVA.
Summaries of the average variances (expressed as standard deviations) and their associated confidence limits for 1000 simulations are shown in Table 10 for n = 100. The simulation input parameters (‘true’ values) have been included to simplify comparisons with the average values. This table also shows coverage percentages calculated from 50 000 simulations using the Matlab program. This program and CI-RANOVA implement the same method and give consistent results, so the coverage probabilities can be taken to apply to CI-RANOVA as well.
Note that in the simulations with contaminated data, the coverage probabilities are still calculated as the percentage of intervals that include the parameters used to generate the data before contamination.
Robust confidence interval estimates with different types of outlier
Comparisons of the classical and robust standard deviations for the three different levels (Table 10) confirm that the robust method produces values that are much closer estimates of the input parameter ‘true’ values than the classical method, especially for the level at which outliers have been added. This is consistent with earlier work [4, 5, 13]. With a small number of outlying values (2) the robust estimates show a relatively small positive bias (< 4 %) compared to the true values. These biases are most evident at the levels where outliers have been added, and also at any levels above. For example, adding two sample outliers result in a positive bias at the sample and target levels. The same pattern is seen for all of the outlier scenarios.
With two outliers, the coverage percentages calculated using the Matlab program range between 92 and 95 %, indicating that the bootstrapping method is producing accurate confidence intervals when there are a small number of outlying values. The coverage percentages are slightly below the nominal 95 %. This is not because the intervals are too narrow, but because the robust estimates have a slight upwards bias compared to the true values for the uncontaminated data.
Increasing the number of outlying values to 4 increases the biases in robust standard deviation estimates of the affected levels, by up to 9 % for 4 outliers at the sample level. Coverage percentages are consequently lower (minimum 86 %). The unaffected levels still show coverage percentages that are very close to the nominal 95 %. This latter observation remains true when the number of outlying values is increased to 10, although in this scenario the biases in the robust estimates increase to 23 to 24 % at the sample level, and the coverage percentages at the affected levels are reduced in some cases to < 50 %.
Overall, these results suggest that the bootstrapping method produces reasonable estimates of the confidence intervals of the robust standard deviations when there are a small number of outlying values (i.e. < 5 %). When a larger number of outliers are present (e.g. at 10 % of targets), the coverage calculated from the true value is seriously reduced below the nominal 95 %.
Lower values of n (n <100)
The n = 100 scenario discussed above suggests that the bootstrapping method produces good estimates of confidence intervals for lower numbers of outliers. This value of n would be fairly unusual in practice, due to the financial cost of obtaining that quantity of duplicated measurements. It is therefore appropriate to repeat the experiments for lower n values. Tables 11 and 12 show the averaged standard deviations, CIs and coverage percentages for n = 20 and n = 10, respectively.
The widths of the robust confidence intervals decrease as n increases (Fig. 5). Again the robust estimates of standard deviations are closer to the true values than are the classical estimates for the levels at which outliers have been included. For n = 20 with 1 outlying value (Table 11), the biases in the robust standard deviations range between 9 and 14 % above the true values for the levels with outlying values and any levels above. Coverage percentages for the true values are a minimum of 87 % for the sample level with 1 sample outlier. Generally, the sample level appears to show the highest bias, and also the lowest percentage coverage, in all scenarios where this level has been affected by outliers either in the level itself, or in the analysis level below it.

Decreasing widths of the confidence intervals as n increases, for robust calculation of target level standard deviation where outliers have been applied to 10 % of the targets
One consequence of narrowing CI’s with increasing n is that the lower confidence limits for high n become close to the true values. This is illustrated in Fig. 5, where it can be seen that in one case, with outliers added to 10 targets, the true value μTarget lies just outside the average CI for n = 100.
In the cases where outlying values have been added to 10 % of the targets (the 2-outlier scenarios in Table 11, and all single outlier scenarios in Table 12), there is up to ~ 25 % bias at the affected levels, as previously seen in Table 9 where 10 outliers were added to 100 targets. This has caused a loss of coverage. This loss arises because of the bias in the robust estimate, which results in the true value lying below the lower confidence limit for a larger number of simulations.
The coverage percentage drops to 75 % at the sample level for n = 10 (Table 12), which may be thought to imply that the bootstrapping method of estimating confidence intervals is unreliable with this value of n. However, these experiments suggest that the problem lies with the bootstrap estimates themselves, which show some upwards bias when compared with the parameters of the underlying uncontaminated distribution. The bootstrapping is able to accurately represent the random variability in the robust estimates but cannot correct for this bias, and hence the coverage falls below the nominal value. Thus, when this robust method is used on data that includes outlying values, caution is needed in the interpretation of both the bootstrap point estimates and the bootstrap CI’s as they relate to the parameters of any supposed underlying (‘uncontaminated’) distribution. This is particularly the case for smaller values of n (i.e. n < 100) or for large n values with more than a small percentage (e.g. > 2 %) of outlying values.
The simulations used input parameters that were derived from a single set of real experimental values (Table 4). Experiments using substantially different input parameters support these findings.
The effects of changing the severity of the outlying value by adding different amounts (the perturbation) to the original simulated values are shown in Figs. 6 and 7. Figure 6 shows that the robust estimate of standard deviation is affected by the outlier, but the effect is bounded as the perturbation increases, whereas the classical estimate increases in an unbounded way and is severely affected once the size of the perturbation increases beyond 200, or approximately 3 × the standard deviation of the target. Figure 7 shows the effect on coverage of the 95 % CI’s. Coverage percentages were estimated by counting the number of times the estimated CI contained the true value of the standard deviation of the target. Coverage of the estimated robust 95 % CI falls slightly below 95 % due to the outlier, but stays fairly constant as the perturbation increases. The classical interval is severely affected once the size of the perturbation increases beyond 3 × the standard deviation of the target.

The effect on estimated classical and robust standard deviations when the size of the perturbation to a target outlier is increased from 0 to 1000 for n = 20

Coverage percentages of the 95 % CI’s when the size of the perturbation to a target outlier is increased from 0 to 1000 for n = 20
Conclusion
Confidence limits on uncertainties estimated using the duplicate method are potentially useful to the researcher. A mathematical method can be used for normally distributed data. When outlying values are present, the robust ANOVA method consistently gives closer estimates of the parameters of the underlying distribution than classical ANOVA. A bootstrapping method has been devised and incorporated into a new computer program (CI-RANOVA) that allows the confidence limits of robust ANOVA to be estimated in the presence of outliers, for a 3-tier nested experimental design. When data are normally distributed within levels, the CI’s produced by the bootstrapping method from robust ANOVA compare well with an established mathematical method for a high n value (n = 100), with coverage percentages close to the nominal 95 %, ranging between 94.5 % and 95.4 %. When a low value of n is used (n = 10), the coverage percentages are lower at 89.0 % to 92.4 %. This is consistent with previously reported limitations of using the bootstrapping method to estimate variances (See p. 181–183 in [11]).
When data with outlying values are analysed using robust ANOVA, the widths of the confidence intervals decrease with increasing n, as would be expected. If outlying values are deliberately added to a known (underlying) distribution, they result in biases in the robust estimates of variances against the known variances of the underlying distribution. This occurs both at the level where the outliers are present, and also at any levels above this. The biases tend to increase as the proportion of outlying values increases; however, the robust estimates are still much closer estimates of the parameters of the underlying distribution than those obtained from classical ANOVA. The simulated scenarios presented here suggest that the bootstrapping method as described produces estimates of confidence limits that are accurate representations of the random variability in the robust variance estimates. Caution should be used when interpreting these intervals with respect to the parameters of a known or theoretical underlying distribution. This is particularly the case with a low n value and/or proportions of outlying values that exceed 2 %.
Change history
25 February 2021
A Correction to this paper has been published: https://doi.org/10.1007/s00769-021-01457-9
References
Ramsey MH, Ellison SLR (eds) (2007) Measurement uncertainty arising from sampling: a guide to methods and approaches. Eurachem, EUROLAB, CITAC, Nordtest and the RSC Analytical Methods Committee. https://www.eurachem.org/images/stories/Guides/pdf/UfS_2007.pdf. Accessed 1 Mar 2019
Rostron P, Ramsey MH (2017) Quantifying heterogeneity of small test portion masses of geological reference materials by PXRF: implications for uncertainty of reference values. Geostand Geoanalytical Res 41(3):459–473
Lyn JA, Ramsey MH, Coad DS, Damant AP, Wood R, Boon KA (2007) The duplicate method of uncertainty estimation: are eight targets enough? Analyst 132:1147–1152
AMC (1989) Robust statistics—how not to reject outliers. Part 1, basic concepts. Analyst 114:1693–1697
Ramsey MH, Thompson M, Hale M (1992) Objective evaluation of precision requirements for geochemical analysis using robust analysis of variance. J Geochem Explor 44:23–36
Rostron P, Ramsey MH (2012) Cost effective, robust estimation of measurement uncertainty from sampling using unbalanced ANOVA. Accred Qual Assur 17:7–14
Williams JS (1962) A confidence interval for variance components. Biometrika 49:278–281
Graybill FA (1976) Theory and application of the linear model. Duxbury Press, Boston
AMC (2014) RANOVA2 computer program. http://www.rsc.org/Membership/Networking/InterestGroups/Analytical/AMC/Software/RANOVA2.asp. Accessed 1 Mar 2019
JCGM 100 (2008) Evaluation of measurement data—guide to the expression of uncertainty in measurement (GUM 2008). Joint Committee for Guides in Metrology (Sèvres Cedex). http://www.bipm.org/en/publications/guides/gum.html. Accessed 1 Mar 2019
Efron B, Tibshirani RJ (1993) An introduction to the bootstrap. Chapman & Hall Inc, Routledge
Singh K (1998) Breakdown theory for bootstrap quantiles. Ann Stat 26(5):1719–1732
AMC (1989) Robust statistics—how not to reject outliers. Part 2, inter-laboratory trials. Analyst 114:1699–1702
Author information
Authors and Affiliations
Corresponding author
Additional information
Publisher's Note
Springer Nature remains neutral with regard to jurisdictional claims in published maps and institutional affiliations.
Electronic supplementary material
Below is the link to the electronic supplementary material.
Rights and permissions
Open Access This article is licensed under a Creative Commons Attribution 4.0 International License, which permits use, sharing, adaptation, distribution and reproduction in any medium or format, as long as you give appropriate credit to the original author(s) and the source, provide a link to the Creative Commons licence, and indicate if changes were made. The images or other third party material in this article are included in the article's Creative Commons licence, unless indicated otherwise in a credit line to the material. If material is not included in the article's Creative Commons licence and your intended use is not permitted by statutory regulation or exceeds the permitted use, you will need to obtain permission directly from the copyright holder. To view a copy of this licence, visit http://creativecommons.org/licenses/by/4.0/.
About this article

Cite this article
Rostron, P.D., Fearn, T. & Ramsey, M.H. Confidence intervals for robust estimates of measurement uncertainty. Accred Qual Assur 25, 107–119 (2020). https://doi.org/10.1007/s00769-019-01417-4
Received:
Accepted:
Published:
Issue Date:
DOI: https://doi.org/10.1007/s00769-019-01417-4