
Abstract
Individuals care not only about their own survival, but also about the survival of other persons. However, little attention has been paid so far to measuring the contribution of longer coexistence time to living standards. For that purpose, we develop a measure of coexistence time—the joint life expectancy—which quantifies the average duration of existence for a group of persons. Then, using a lifecycle model with risky lifetime, we construct an equivalent consumption measure incorporating gains in single and joint life expectancies. An empirical application to France (1820–2010) shows that, assuming independent individual mortality risks, the rise in joint life expectancies contributed to improve standards of living significantly. We examine the robustness of that result to the introduction of dependent mortality risks using copulas, and we show that equivalent consumption patterns are robust to introducing risk dependence.


Notes
Note that the existence of coexistence concerns in real life can be represented by means of various microeconomic models, depending on what motivates coexistence concerns (either self-oriented concerns or altruism) and on how coexistence time is perceived/quantified by individuals. See Sect. 3 on this.
As usual, we assume \(S_{i0}=1\). Note that expression (3) presupposes that a person dying during a year dies at the beginning of that year. Alternatively, if one supposes that a person dying during a year dies, on average, in the middle of that year, Eq. (3) becomes:
$$\begin{aligned} E\left( L_{i}\right) = {\displaystyle \sum \limits _{x=0}^{T-1}} S_{ix+1}+0.5 \end{aligned}$$Note that we restrict ourselves here to a double lottery, in which one person cares about his survival and about the survival of another person. But in the real world individuals may care about the survival of more than one other person, implying a more complex lottery.
Similar calculations could be carried out for other groups of different size, including persons of unequal ages.
While that formula concerns the coexistence of two persons, joint life expectancies can also be defined for a larger number of individuals.
Alternatively, one may compute cohort joint life expectancies, on the basis of the survival conditions faced within a given cohort.
Section 5 is dedicated to the measurement and valuation of coexistence gains when mortality risks are dependent.
The form of the relation between the probabilities of joint survival (and, hence, the joint life expectancy) and individual survival probabilities may vary, depending on how dependent individual survival processes are. See Sect. 5 on this.
The utility function is assumed to exhibit self-oriented coexistence concerns: according to that function, individuals care about the survival of other persons only for themselves, without caring about the well-being of those other persons. It should be stressed here that this utility function does not constitute the only way to represent coexistence concerns. As an alternative to self-oriented coexistence concerns, we could have represented coexistence concerns by means of a utility function exhibiting altruism (individuals would be interested in the well-being of others, and, hence, in the survival of others).
Sources: The Human Mortality Database (2013), University of California, Berkeley (US), Max Planck Institute for Demographic Research (Germany). Available online at: http://www.mortality.org. Note that Sect. 4.1 presents demographic data over 1816–2010, whereas our income data only cover the period 1820–2010. Hence, demographic data for years 1816–1819 will not be used when computing consumption equivalents (Sect. 4.2).
Note that, if one carries out the same computation exercise for a pair composed of a man and a woman of age 50 years, one finds a similar pattern: stagnation of the joint life expectancy during the nineteenth century, and strong growth during the second part of the twentieth century. While a man and a woman of age 50 could expect to coexist about 15 years in the nineteenth century, their expected duration of coexistence is now equal to 28 years.
Fig. 4 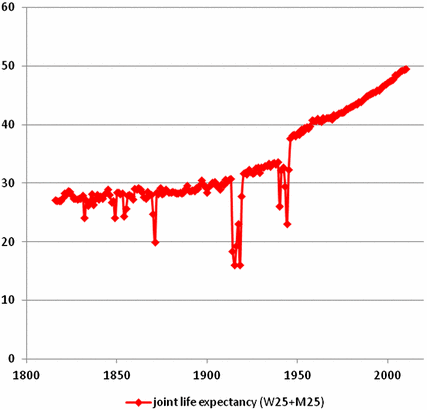
(Period) joint life expectancy for a woman and a man of age 25, France (1816–2010)
The income figures are GDP per capita expressed in International Geary-Khamis dollars (1990). Sources: The Maddison Project: http://www.ggdc.net/maddison/maddison-project/home.htm. Life expectancy figures come from the Human Mortality Database (2013).
Fig. 9 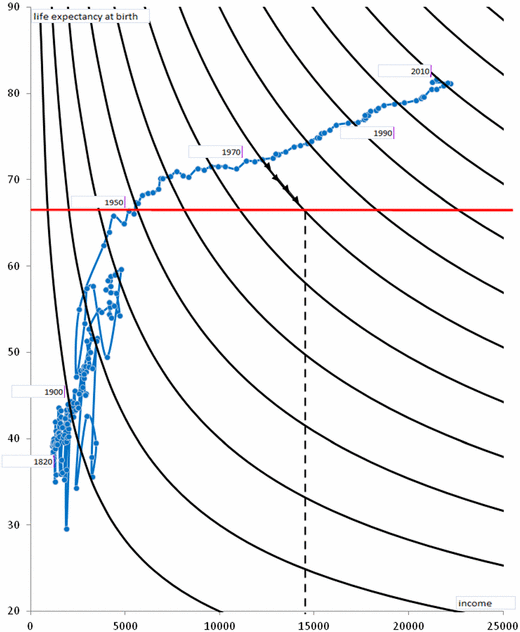
Construction of the equivalent income for year 1972 in France
The indifference map on Fig. 9 is drawn in an arbitrary way. The next subsection explores the construction of a more realistic indifference map on the basis of the empirical literature on money/risk and risk/risk trade-offs.
The reference survival conditions—here the ones prevailing in 1950—were chosen arbitrarily. A similar construction could be carried out under alternative reference survival conditions.
The reason why we do not consider lower ages is that our consumption data do not cover ages inferior to 25 years (see the Appendix).
In the case of society M3, it is assumed that the representative individual cares about the survival of a spouse, of a child and of a parent. In the case of society M6, it is assumed that the representative agent cares about the survival of one spouse, of two parents and of two children. Finally, in the case of society M9, it is assumed that the representative individual cares about the survival of one spouse, two parents and two children, as well as of one person of his generation, one person of the previous generation and one person of the next generation.
The calibration of preference parameters under dependent mortality risks is examined in Sect. 5.
Survival probabilities are taken from the Human Mortality Database. For simplicity, we take survival probabilities for the total population (men and women).
See the Appendix for data on consumption profiles.
Given that Miller’s study covers the period 1974–1999, we use, for the calibration, the average levels of the variables (consumptions, survival probabilities) over that period.
We assume, here again, the independence of individual mortality risks.
Note that, as stressed by Costa and Kahn (2004), the VSL has grown during the twentieth century. In the light of this, one may compute an equivalent consumption on the basis of several—instead of one—sets of preference parameters. Such a measure of standards of living would incorporate both the improvement in survival conditions and the change in preferences. In this paper, we rely on a fixed set of preference parameters, to capture only the gain in survival conditions.
Table 1 Calibration of preference parameters Unadjusted consumption is here defined as the constant equivalent consumption level on the life cycle, that is, the hypothetical constant consumption level such that, if enjoyed at all periods of life, this would make the representative agent indifferent with his actual lifetime consumption profile.
The joint life expectancies taken into account when considering the M3, M6 and M9 cases are those between persons of age 25 and 0, ages 25 and 25, as well as between persons of ages 25 and 50 years.
Fig. 11 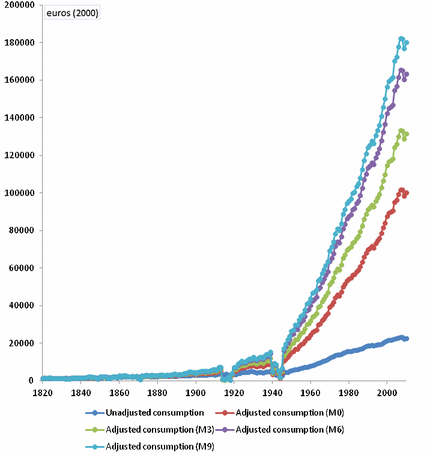
Unadjusted and adjusted consumption for France (1820–2010), societies M0, M3, M6 and M9 (VSL lower bound)
For a detailed proof of this, see Georges et al. (2001).
When \(\theta \) tends to \(-\infty \), Frank’s copula reflects the maximal positive dependence between the survival of the two individuals.
Assuming a constant structure of dependence simplifies the picture. As shown by Luciano et al. (2010), the degree of dependence of mortality risks within couples tends to diminish across generations. Relying on a constant dependence structure is thus a simplification.
That value differs from the one appearing in Table 1 (equal to 4.031), for which calculations were based on representative agents without gender differentiation (unlike here, where the two members of the couple are modeled as a woman and a man).
The relative gap is defined as the ratio: [equivalent consumption under dependent risks minus equivalent consumption under independent risks]/equivalent consumption under dependent risks. The higher relative gaps in war times are due to the lowest levels of joint life expectancy for those years.
Fig. 14 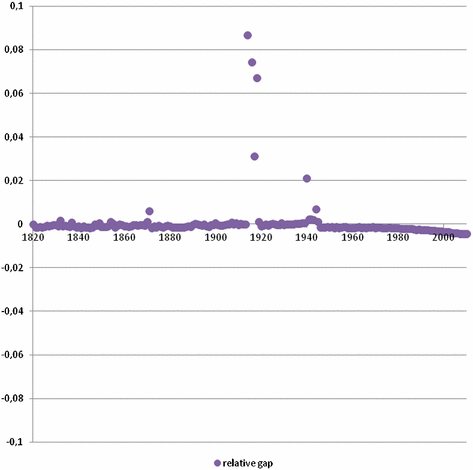
Relative gap between adjusted consumptions under dependent and independent mortality risks
On this, see Gustafsson (2001).
In particular, the reduction in coexistence time induced by birth postponement may be non negligible since the 1970s.
Consumption profiles are estimated by regressing the logarithm of consumption on a constant, on age, (age)\(^{2}\), (age)\(^{3}\), (age)\(^{4}\) and (age)\(^{5}\), as well as on dummy variables for the different years of birth. The latter control variables are used to neutralize the impact of cohort effects.
On the link between life expectancy and the propensity to save, see Chakraborty (2004).


References
Andersson H, Hammitt J, Lindberg G, Sundström K (2013) Willingness to pay and sensitivity to time framing: a theoretical analysis and an application on car safety. Environ Res Econ 56(3):437–456
Araya J, León C (2002) Willingness to pay for health risk reduction in the context of altruism. Health Econ 11(7):623–635
Becker G, Philipson T, Soares R (2005) The quantity and the quality of life and the evolution of world inequality. Am Econ Rev 95(1):277–291
Blanchflower D, Oswald A (2004) Well-being over time in Britain and the USA. J Publ Econ 88:1359–1386
Blundell R, Browning M, Meghir C (1994) Consumer demand and the life cycle allocation of household expenditures. Rev Econ Stud 61(1):57–80
Boissinot J (2007) Consumption over the life cycle: facts from France. INSEE, Direction des Etudes et Synthèses Economiques, working paper G2007/09
Borsch-Suspan A (2003) Life-cycle saving and public policy: a cross-national study of six countries. Academic Press, New-York
Browning M, Hansen L, Heckman J (1999) Micro data and general equilibrium models. In: Taylor J, Woodford M (eds) Handbook of macroeconomics, vol 1. Elsevier Sciences, Amsterdam
Chakraborty S (2004) Endogenous lifetime and economic growth. J Econ Theory 116:119–137
Charpentier A (2014) Copules et risques multiples. In: Droesbeke JJ, Maumy-Bertrand M, Saporta G, Thomas-Agnan C (eds) Approches statistiques du risque. Société Française de Statistiques, Editions TECHNIP, Paris
Clayton D (1978) A model for association in bivariate life tables and its application in epidemiological studies of familal tendency in chronic disease incidence. Biometrika 65(1):141–151
Crafts N (1997) The human development index and changes in standards of living: some historical comparisons. Eur Rev Econ Hist 1:299–322
Costa D, Kahn M (2004) Changes in the value of life, 1940–1980. J Risk Uncertain 29:159–180
Costa D, Steckel R (1997) Long-term trends in health, welfare and economic growth in the United States. In: Steckel R, Floud R (eds) Health and welfare during Industrialization. NBER Project report, University of Chicago Press, Chicago
Cropper M, Hammitt J, Robinson L (2011) Valuing mortality risk reductions: progress and challenges. Annu Rev Res Econ 3(1):313–336
de la Croix D, Michel P (2002) A theory of economic growth. Cambridge University Press, Cambridge
Denuit M, Dhaene J, Bailly Le, de Tilleghem C, Teglem S (2001) Measuring the impact of dependence among insured life lengths. Belgian Actuar Bull 1:18–39
Fleurbaey M, Gaulier G (2009) International comparisons of living standards by equivalent incomes. Scand J Econ 111:597–624
Frank M (1979) On the simultaneous associativity of \(\text{ F }(\text{ x }, \text{ y) }\,\text{ and }\,\text{ x }+\text{ y }-\text{ F }(\text{ x }, \text{ y) }\). Aequ Math 19:194–226
Frees E, Carriere J, Valdez E (1996) Annuity valuation with dependent mortality. J Risk Insur 63(2):229–261
Frees E, Valdez E (1998) Understanding relationships using copulas. N Am Actuar J 2(1):1–25
Georges P, Lamy A-G, Nicolas E, Quibel G, Roncalli T (2001) Multivariate survival modelling: a unified approach with copulas. Groupe de Recherche Opérationnelle Crédit Lyonnais, France
Gourinchas P-O, Parker J (2002) Consumption over the life-cycle. Econometrica 70:47–89
Gustafsson S (2001) Theoretical and empirical considerations on postponement of maternity in Europe. J Popul Econ 14:225–247
Hall R, Jones C (2007) The value of life and the rise in health spending. Q J Econ 122(1):39–712
Human Mortality Database (2013) University of California, Berkeley (United States), Max Planck Institute for Demographic Research (Germany). http://www.mortality.org
Jagger C, Sutton C (1991) Death after marital bereavement—is the risk increased? Stat Med 10:395–404
Jappelli T, Modigliani F (2005) The age-saving profile and life-cycle hypothesis. In: Francesco F (ed) The collected papers of Franco Modigliani, vol 6, chap 5. MIT Press, Cambridge, pp 141–172
Johansson P-O (2001) Evaluating health risk. An economic approach. Cambridge University Press, Cambridge
Jones-Lee M (1991) Altruism and the value of other people’s safety. J Risk Uncertain 4:213–219
Le Bras H (1973) Parents, grands-parents, bisaïeux. Population 28:9–37
Lee R, Tuljapurkar S (1997) Economic consequences of ageing for populations and individuals death and taxes: longer life, consumption and social security. Demography 34:67–81
Luciano E, Spreeuw J, Vigna E (2008) Modeling stochastic mortality for dependent lives. Insur Math Econ 43:234–244
Luciano E, Spreeuw J, Vigna E (2010) Cross generational comparison of stochastic mortality of coupled lives. Working paper, University of Torino
Maddison Project, Data. http://www.ggdc.net/maddison/maddison-project/home.htm
Miller T (2000) Variations between countries in values of statistical life. J Transp Econ Policy 34(2):169–188
Murphy K, Topel R (2003) Measuring gains from medical research: an economic approach. University of Chicago Press, Chicago
Needleman L (1976) Valuing other people’s lives. Manch School 44:309–342
Nelsen R (2007) An introduction to copulas. In: Springer series in statistics. Springer, Berlin
Nordhaus W (2003) The health of nations: the contribution of improved health to living standards. In: Murphy K, Topel R (eds) Measuring gains from medical research: an economic approach. University of Chicago Press, Chicago
Nordhaus W, Tobin J (1972) Is growth obsolete? In: Economic growth. Fiftieth anniversary, Colloqium 5, National Bureau of Economic Research
North D (1994) Economic performance through time. Am Econ Rev 84:359–368
Parkes C, Benjamin B, Fitzgerald R (1969) Broken heart: a statistical study of increased mortality among widowers. Br Med J 1:740–743
Pestieau P, Ponthiere G (2014) Optimal fertility along the life cycle. Econ Theory 55(1):185–224
Pestieau P, Ponthiere G (2015) Optimal lifecycle fertility in a Barro–Becker economy. J Popul Econ 28(1):45–87
Poterba J (1994) International comparison of household saving. University of Chicago Press, Chicago
Sandberg L, Steckel R (1997) Was industrialization hazardous to your health? Not in Sweden! In: Steckel R, Floud R (eds) Health and welfare during Industrialization. NBER project report, University of Chicago Press, Chicago
Sen A (1973) On the development of basic income indicators to supplement GNP measures. U N Bull Asia Far East 24:1–11
Sen A (1998) Mortality as an indicator of economic success and failure. Econ J 108:1–25
Sklar A (1959) Fonctions de répartition à n dimensions et leurs marges. Publications de l’Institut de Statistique de l’Université de Paris 8:229–231
Spreeuw J, Owadally I (2013) Investigating the broken-heart effect: a model for short-term dependence between the remaining lifetimes of joint lives. Ann Actuar Sci 7(2):236–257
Strand J (2005) Individual and household values of mortality reductions with intrahousehold bargaining. J Risk Uncertain 31(2):217–236
Usher D (1973) An imputation to the measure of economic growth for changes in life expectancy. In: Moss M (ed) The measurement of economic and social performance. NBER, New-York
Usher D (1980) The measurement of economic growth. Columbia University Press, New-York
Viscusi K (1998) Rational risk policy. The Arne Ryde memorial lecture series. Clarendon Press, Oxford
Viscusi K, Aldy J (2004) The value of a statistical life: a critical review of market estimates throughout the world. J Risk Uncertain 27(1):5–76
Williamson J (1984) British mortality and the value of life, 1781–1931. Popul Stud 38:157–172
Youn H, Shemyakin A (2001) Pricing practices for joint last survivor insurance, vol 1. Actuarial Research Clearing House, Michigan
Author information
Authors and Affiliations
Corresponding author
Additional information
The author would like to thank Koen Decancq, Marc Fleurbaey, André Masson, Julien Tomas, Alain Villemeur, Hélène Xuan, Stéphane Zuber, two anonymous referees, as well as participants of seminars at University Paris Dauphine and at the Caisse des Dépôts et Consignations for helpful comments on this paper.
G. Ponthiere acknowledges the financial support of the ANR Equirisk (Equity in Risky Intertemporal Economic Environments) (ANR-12-INEG-0006-01).
Appendix
Appendix
Demographic data On the demographic side, we use data from the lifetables of the Human Mortality Database. In order to compute the equivalent income incorporating the value of changes in global survival conditions, we use individual probabilities of survival at all ages of life, for all years under study (from 1820 to 2010). We also use the probabilities of joint survival, for different pairs of individuals (varying with the age and the sex of the members of the pair), also for the period 1820–2010.
Consumption profiles As far as consumption statistics are concerned, we use consumption profiles by age (between age 25 and age 80) estimated for France by Boissinot (2007). Those lifetime consumption profiles were estimated on the basis of 5 successive waves of the INSEE Survey on Household Budgets.Footnote 36 Each wave includes about 10,000 households, which implies a total sample size of between 25,000 and 30,000 individuals. On the basis of that pseudo-panel, consumption profiles were estimated on an age interval between 25 and 80 years. Figure 15 below shows the consumption profile obtained by Boissinot on the basis of 15 cohorts, born between 1960 and 1975. That consumption profile has been normalized, a unitary value being assigned to consumption at the beginning of the lifecycle (i.e. at age 25).

Normalized consumption profile (age 25–80)
The consumption profile estimated by Boissinot exhibits the standard inverted-U shape.Footnote 37 The maximum consumption is achieved around age 45. After age 50, consumption starts falling continuously, to reach, at age 80, a level equal to about 70 % of the consumption at age 25. The consumption profile on Fig. 15 stops at age 80. This is problematic for the monetization of longevity gains, since a significant part of those gains concern ages higher than 80. This is the reason why we extended the consumption profile estimated by Boissinot until the age of 110. For that purpose, we calculated the growth rate of consumption between ages 75 and 80, and we extrapolated the rest of the consumption profile by applying that growth rate to the age interval 80–110 (see Fig. 16).

Extended consumption profile (age 25–110)
The lifetime consumption profile on Fig. 16 was then used to derive, by extrapolation, lifetime consumption profiles for all years considered in this study (1820–2010). For that purpose, we started from the lifetime consumption profile estimated by Boissinot (2007) for year 2000, and we used the levels of income per head for all years between 1820 and 2010 (sources: the Maddison Project 2015), in such a way as to derive the corresponding lifetime consumption profiles associated to those years. For each year, the consumption profile is assumed to keep the same general shape, which is characterized by the proportionality coefficients appearing on Fig. 16. Figure 17 shows some extrapolated lifetime consumption profiles, for years between 1820 and 2010.

Lifetime consumption profiles, 1820–2010 (in 2000 euros)
This extrapolation amounts to assuming that intertemporal trade-offs did not change significantly over time, and that differentials in income per head explain all differences observed, year after year, in consumption levels at a given age. Obviously, that assumption can only be regarded as a first proxy. On a period as large as two centuries, the strong improvement of survival conditions may have affected savings behaviors, and, thus, the shape of the lifetime consumption profile.Footnote 38 However, this extrapolation is required given the lack of historical data on lifetime consumption profiles over that period.
Rights and permissions
About this article

Cite this article
Ponthiere, G. The contribution of improved joint survival conditions to living standards: an equivalent consumption approach. Soc Choice Welf 46, 407–449 (2016). https://doi.org/10.1007/s00355-015-0919-y
Received:
Accepted:
Published:
Issue Date:
DOI: https://doi.org/10.1007/s00355-015-0919-y