
Abstract
This work presents a novel numerical procedure for reconstructing volumetric density and velocity fields from planar laser-induced fluorescence (PLIF) and stereoscopic particle image velocimetry (SPIV) data. This new method is theoretically and practically demonstrated to provide more accurate 3D vortical structures and density fields in high shear flows than reconstruction methods based on the mean convective velocity. While Taylor’s hypothesis of frozen turbulence is commonly applied by using the local mean streamwise velocity, the proposed algorithm uses the measured local instantaneous velocity for data convection. It consists of a step-by-step reconstruction based on a mixed Lagrangian–Eulerian solver that includes the 3D interpolation of scattered flow data and that relaxes the Taylor’s hypothesis by iterative enforcement of the incompressibility constraint on the velocity field. This methodology provides 3D fields with temporal resolution, spatial resolution, and accuracy comparable to that of real 3D snapshots, thus providing a practical alternative to tomographic measurements. The procedure is validated using numerical data of the constant-density channel flow available on the Johns Hopkins University Turbulence Database (JHTDB), showing the accurate reconstruction of the 3D velocity field. The algorithm is applied to an experimental dataset of PLIF and SPIV measurements of a variable-density jet flow, demonstrating its capability to provide 3D velocity and density fields that are more consistent with the Navier–Stokes equations compared to the mean flow convective method.
Graphic abstract

1 Introduction
Large density variations can be present either in high-speed compressible flows (Amendt et al. 2010), as in explosions or supersonic flows (Jones et al. 2016); or in incompressible flows, as the result of the mixing of two fluids with different densities (Lee and Chu 2003; Charonko and Prestridge 2017; Lai et al. 2018). In flows with large density gradients, the Boussinesq approximation does not apply, so variable-density effects are not limited to buoyancy phenomena. In non-Boussinesq flows, density gradients are strong enough to drive variations in inertia, thus influencing the dynamical characteristics of the turbulent flow. 3D velocity and density field measurements are needed to understand variable-density mixing for improved modeling of those flows (Chassaing 2001; Banerjee et al. 2010). Unfortunately, implementing simultaneous 3D density and velocity diagnostics is very challenging.
3D velocimetry measurements in turbulent flows are commonly carried out by tomographic particle image velocimetry (PIV) (Elsinga et al. 2006), or time-resolved tomographic particle tracking velocimetry (PTV) (Schanz et al. 2013; Schneiders and Scarano 2016). Both tomographic PIV and PTV share limitations on the spatial resolution created by ghost particles, which increase in number with the image particle density and decrease with the number of employed cameras. The depth of the illumination volume is also limited by the maximum particles per pixel (ppp) that can be practically employed, and in time-resolved measurements, by the trade-off between sampling rate and delivered laser energy. Experiments have demonstrated that a four-camera system can provide accurate reconstructions of volumes with a depth of 2 cm when a particle seeding of the order of 0.05 ppp is employed (Scarano 2012).
The tomographic reconstruction of full objects, such as the density field, makes the problem of “ghost” data even more dramatic than for the case of sparse particle systems, thus the number of views required for reconstructions with acceptable accuracy and spatial resolution is even higher than for PIV/PTV velocity measurements. Applications of tomographic laser-induced fluorescence (LIF) for density or mass fraction measurements (Cai et al. 2013; Wu et al. 2015; Ma et al. 2017; Halls et al. 2017) have demonstrated the use of 5 to 8 views for the reconstruction of volumes with a depth of 0.5–1 cm.
The relatively large number of cameras required for each of these techniques and the limited optical access of experimental test sections make the implementation of simultaneous volumetric PIV/PTV and LIF very challenging. Stereoscopic-PIV (SPIV) and planar LIF (PLIF) techniques are more commonly used for the investigation of variable-density flows, so we focus on 3D reconstructions using these methods. Some applications of the frozen turbulence hypothesis to SPIV data for generating pseudo-volumes of data exist (Van Doorne and Westerweel 2007; Ganapathisubramani et al. 2008; Vétel et al. 2010), but this work develops an improved volumetric reconstruction that applies the Taylor’s approximation by convecting velocity and/or density fields with their corresponding instantaneous local velocity, instead of the local mean streamwise velocity profile. Section 2 presents a discussion of previous theoretical analysis and experimental applications of the Taylor’s approximation, motivating the use of the instantaneous convective velocity. The reconstruction algorithm is discussed in Sect. 3, consisting of a (i) step-by-step processing of the image data, (ii) 3D interpolation of the scattered data that results from the convective process, and (iii) solving a Poisson system on an Eulerian framework to recover an incompressible velocity field. In Sect. 5, the method is validated on the Direct Numerical Simulations (DNS) data of the constant-density channel flow available on the Johns Hopkins University Turbulence Database (JHTDB) and compared with the Taylor reconstruction based on the local mean velocity. Section 6 presents an application of the method to an experimental dataset of SPIV and PLIF images of an \(\hbox {SF}_6\) jet flow in a co-flow of air run in the Turbulent Mixing Tunnel (TMT) facility at the Los Alamos National Laboratory. This application demonstrates the performance of the algorithm on real experimental measurements including density fields. Finally, the conclusions of this work are drawn in Sect. 7.
2 Taylor’s hypothesis for 3D reconstruction
2.1 Background
The differential operator that describes the Taylor’s assumption and that governs the frozen turbulent flow (Taylor 1938) is
where \({\varvec{U_{c}}}({\varvec{x}},t)\) is the convective velocity vector, and \(\varphi ({\varvec{x}},t)\) is a property of the fluid flow that can be the velocity \({\varvec{u}}\) or the density \(\rho\), for example. The linear hyperbolic equation, which will be referred to as the Taylor operator, accepts solutions of the form \({\varvec{u}}({\varvec{x}}-{\varvec{U_{c}}}t,t)\), which represents a traveling wave function that moves at a speed \(\Vert {\varvec{U_{c}}} \Vert\). By following the usual Reynolds decomposition, the velocity field is expressed as \({\varvec{u}}\left( {\varvec{x}},t \right) = \overline{{\varvec{u}}}\left( {\varvec{x}},t \right) + {\varvec{u}}'\left( {\varvec{x}},t \right)\), with \(\overline{{\varvec{u}}}\left( {\varvec{x}},t \right)\) the mean velocity and \({\varvec{u}}'\left( {\varvec{x}},t \right)\) the velocity fluctuations. The same decomposition applies to the density field, \(\rho = {\overline{\rho }} + \rho '\). We consider a Cartesian coordinate system in which the z-axis is oriented toward the main convective flow direction.
A direct comparison of the Taylor operator with the Navier–Stokes equations reveals that the approximations introduced by the frozen turbulence hypothesis are due to the assumption that the property \(\varphi\) does not evolve in time during the convection process and also depend on the definition of the convective velocity \({\varvec{U_{c}}}\), which is expected to be a function of both space and time. Researchers have tried to define a unique convective velocity that allows statistically meaningful conversion of time derivatives into space derivatives (Hinze 1975; Wills 1964). The most common choice for \({\varvec{U_{c}}}\) is the streamwise component of the mean velocity, \((0,0,{\overline{w}})\), for which the application of the Taylor operator to the velocity field reads
The use of a single convective velocity, however, introduces the strong assumption that all turbulent structures travel with the same speed, whereas previous experimental work has shown that velocity fluctuations can move the small eddies more quickly or slowly (Fisher and Davies 1964; Cenedese et al. 1991; Romano 1995; Krogstad et al. 1998; Fiscaletti et al. 2015).
When the Taylor’s hypothesis is applied to shear flows, the local value of the mean streamwise velocity, \({\overline{w}}(x,y)\), is commonly used in Eq. 2. A turbulent flow under the effect of a shear layer cannot be considered as strictly frozen, even if the contributions given by the pressure gradient and the viscous term are neglected. An observer on a frame of reference moving with the eddies would see an evolution in time of the turbulent pattern due to the distortions caused by the shear layer. By considering a flow characterized by a mean velocity field of the form \(\overline{{\varvec{u}}} = (0,0,{\overline{w}}(x,y))\), the momentum equations are as follows:
The first term of the left-hand side corresponds to the Taylor operator, Eq. 2. Term 2 takes into account the possibility of a fluid particle moving into locations along the shear layer with smaller or larger mean streamwise velocity. This term can be neglected only if \(\;{\overline{w}}\;\partial w/\partial z \gg \left( u\;\partial \overline{w}/\partial x + v\; \partial \overline{w} /\partial y \right)\), usually not the case in turbulent shear flows (Lin 1953; Zaman and Hussain 1981; Lumley 1965). This contribution can not only modify the convective speed of small size eddies but also strongly affects the deformation of the large-scale turbulent structures (Dennis and Nickels 2008; de Kat and Ganapathisubramani 2015). Term 3 represents the fluctuations on the convective velocity. While the contribution given by the fluctuations might be negligible in terms of statistical results (Antonia et al. 1980; Browne et al. 1983; George et al. 1989), the accuracy on the instantaneous reconstructed gradient structures can be very dependent on the correct transport of the fluid properties in space. When the convective velocity is set as the local mean velocity profile, terms 2 and 3 of Eq. 3 are neglected, which can lead to significant errors on the reconstructed small and large scale motions in flows with large velocity fluctuations and strong gradients on the mean velocity profile.
2.2 Definition of convective velocity
The velocity components in the directions of the mean velocity gradient must be included in the definition of the convective velocity to take account for term 2 in Eq. 3. To improve reconstructions in shear flows, the convective velocity is set as the instantaneous velocity field, \({\varvec{U}}_{c} = {\varvec{u}}\). In contrast to the usual definition of the convective velocity (Eq. 2), all three components of the instantaneous velocity vector are now used for convecting the flow data in the 3D space. The use of the instantaneous velocity in the Taylor operator for the volumetric reconstruction of either the velocity or the density field has not previously been explored. de Kat and Ganapathisubramani (2012) proposed the use of a low-pass filtered streamwise instantaneous velocity w(x, y) for the 3D reconstruction of velocity fields from SPIV measurements. Scarano and Moore (2012) applied the Taylor’s hypothesis based on the instantaneous velocity to improve the temporal resolution of a time sequence of 2D or 3D velocity data by pouring information from space into time, but not for inferring unavailable spatial information from measured time-correlated information, by pouring information from time into space.
Based on this choice of the convective velocity vector, the application of the Taylor operator to the velocity field yields
which represents the best approximation of the Navier–Stokes equations that can be obtained from SPIV measurements. The absence of the viscous term in the Taylor operator introduces negligible errors in the volume reconstruction (Ghaemi et al. 2012; Schneiders et al. 2014; Schneiders and Scarano 2016; Schneiders et al. 2016). By applying the curl operator, \(\nabla \times (\cdot )\), to Eq. 4, the vorticity transport equation for a flow governed by the Taylor operator is
corresponding to the vorticity transport equation of inviscid Navier–Stokes equations for uniform density flows, except for the last term, \(-{\varvec{\omega }} \left( \nabla \cdot {\varvec{u}}\right)\), which is commonly zero. Because the pressure gradient term is absent in Eq. 4, a flow field under the effect of the Taylor operator cannot remain incompressible, and thus, in general, \(\nabla \cdot {\varvec{u}} \ne 0\). Nevertheless, for a time of convection that is sufficiently small to allow approximating the velocity of each fluid particle to be constant, Eq. 4 moves each fluid parcel with the right speed and direction, and if the velocity field is initially solenoidal, the last term of Eq. 5 can be considered negligible with respect to the other terms. Note that the correct form of the vorticity transport equation cannot be recovered from the Taylor operator if the local mean streamwise velocity \({\overline{w}}(x,y)\) was chosen instead for \({\varvec{U}}_{c}\).
The instantaneous convective field is also applied to the planar density measurements. For the reconstruction, PLIF and SPIV should be simultaneous and spatially registered to each other. The application of the Taylor operator to the density field yields
corresponding to the mass conservation law for incompressible flows. Choosing the local velocity for moving the density data in space will result in velocity and density volumes that are automatically consistent in terms of mass conservation, as long as the velocity field remains incompressible. Several works demonstrated the application of the Taylor’s hypothesis by using the mean velocity for the spatial reconstruction of scalar fields, both from pointwise (Sreenivasan et al. 1977; Antonia et al. 1980; Browne et al. 1983) and 2D (Gampert et al. 2013) measurements. The limitations of using the local mean streamwise velocity for the out-of-plane convection in turbulent shear flows have been investigated (Dahm and Southerland 1997), while the use of the local instantaneous velocity in the Taylor’s hypothesis for the 3D reconstruction of scalar fields has not been explored yet.
3 Reconstruction algorithm
The reconstruction algorithm is described graphically in Fig. 1. We consider a set of \(N_{m}\) instances of SPIV and PLIF that represent slices of the flow field that are parallel to the (x, y)-plane, at a location \(z=0\), and at different times \(t_{i}\). The list of instances is ordered for increasing times, that is \(t_{1}<t_{2}< \cdots < t_{N_{m}}\), and consecutive data planes are separated by the same time interval \(\varDelta t\), that is the sampling time step used for performing SPIV/PLIF measurements. Each plane has a size of \(L_{x} \times L_{y}\) and is composed by a grid of \(N_{x} \times N_{y}\) points, at which the density and all 3 components of the velocity vector are defined. The velocity and density 2D fields associated with the i-th plane are, respectively, \({\varvec{u}}_{m,i}\) and \(\rho _{m,i}\), where the subscript m stands for “measured data planes.” The pixel grid is defined by the vector position \(\left( X_m,Y_m\right)\). The main objective of the method is to reconstruct from the time sequence of \(N_{m}\) planes a flow field volume that is centered at the position \(z=0\) and that corresponds to a time \(t_{V} \in [t_{1}, t_{N_{m}}]\), where \(t_V\) is defined as the reconstruction time and where \(t_{1}\) and \(t_{N_{m}}\) are the time instants at which the planes \(i=1\) and \(i=N_{m}\) are recorded at \(z=0\). With the z-axis oriented in the main flow direction, the downstream region of the volume, \(z>0\), is filled by velocity and density data that were recorded at previous times, \(t < t_{V}\), at \(z=0\). Similarly, the upstream region of the volume, \(z<0\), is determined by velocity and density data that will be recorded at future times, \(t>t_{V}\), at \(z=0\). To generate a data volume that has similar sizes in the upstream and downstream z directions, the reconstruction time \(t_V\) is chosen equal to the time \(t_{i_c}\) of a plane \(i_c\) selected from the center of the list. The volume is centered on the \(i_{c}\)-th plane, which provides the velocity and density fields at \(z=0\) of the final 3D reconstruction. The reconstruction algorithm convects downstream the planes with index \(i = 1,2,\ldots ,i_{c}-1\) by a forward in time integration from \(t_{1}\) to \(t_{i_c}\), and convects upstream all planes with index \(i=N_{m},N_{m}-1,\ldots ,i_{c}+1\) by a backward in time integration from \(t_{N_{m}}\) to \(t_{i_{c}}\).
This algorithm produces 3D velocity and density fields at a time \(t_V\). However, the same procedure can be repeated for reconstructing volumes that correspond to a different reconstruction time and that are centered at \(z=0\) around a different plane of the data list. For instance, by shifting the index of the central image by one, i.e., from \(i_c\) to \(i_c + 1\), the algorithm will produce a 3D flow field corresponding to a time \(t_V+\varDelta t\). This procedure can then provide a time-series of 3D velocity and density volumes that are separated by a time step \(\varDelta t\), that is the same time resolution of the SPIV/PLIF measurements (see Online Resources 1 and 2 as examples of time-series of reconstructed 3D fields).
The reconstruction of 3D flow data from 2D measurements is carried out by exploiting time-correlated information for inferring the spatial-gradient structures in the out-of-plane direction. Since the out-of-plane spatial structure of the flow is not available from SPIV/PLIF data, it is not possible to determine what are the forces and/or the accelerations acting on the flow field. Therefore, the process of pouring temporal information into spatial information can be performed only through approximations, by means of the Taylor operator, Eq. 4. Although the 3D reconstruction can provide time-resolved series of 3D flow volumes, the assumption that no forces act on the flow during the convection of the planar data limits the accuracy of the reconstruction.
The hypothesis of zero-acceleration cannot hold for too many time steps in the convection procedure. Since the Taylor operator makes use of all three components of the instantaneous velocity, the fluid particles may spread too far in space and the fluctuations on the velocity field may produce strong distortion in the convected data plane. For this reason, the data are not convected forward and backward all at once. Instead, the volume reconstruction is made through a step-by-step procedure in which at each iteration:
-
(i)
a reduced set of data planes is convected forward/backward,
-
(ii)
the 3D field is re-sampled on a regular grid by 3D interpolation,
-
(iii)
a Poisson solver is applied to the 3D velocity data,
-
(iv)
and new planar data are taken from the interior of the regularized 3D volume for the next iteration.
All steps of the reconstruction algorithm have been implemented in MATLAB®. Figure 2 illustrates a framework of the reconstruction procedure and the notation used for the variables at each step. At the first iteration of the algorithm, a subset \(n_s\) of planes taken from the SPIV/PLIF dataset is introduced in the reconstruction. In step (i) of the algorithm, the velocity and density planar data, (\({\varvec{u}}_m\), \(\rho _m\)), are convected in the 3D space. The 3D interpolation performed in step (ii) is described in Sect. 3.2 and produces the velocity and density 3D fields, (\(\hat{{\varvec{u}}}_h\), \({\hat{\rho }}_h\)). In step (iii), the velocity field \(\hat{{\varvec{u}}}_h\) is regularized by the Poisson solver into \({\varvec{u}}_h\). The regularization step is discussed in detail in Sect. 3.3. The reconstruction algorithm does not involve any regularization for the density field and, therefore, the notation used for the density variable at the end of step (iii) remains \({\hat{\rho }}_h\). At step (iv), a new set of z-planes of velocity and density data are sampled from the interior of the 3D fields (\({\varvec{u}}_h\), \({\hat{\rho }}_h\)). The velocity and density data associated with the re-initialized planes are different from the initial planar data (\({\varvec{u}}_m\), \(\rho _{m}\)) introduced at the beginning of the algorithm iteration, since the data of these planes have been redistributed in the 3D space and regularized by the Poisson equation. The velocity and density planar data generated at the end of the algorithm iteration are noted as (\({\varvec{u}}_r\), \(\rho _r\)), where the subscript r stands for “re-initialized data planes.” At the next algorithm iteration, both new planar data (\({\varvec{u}}_m\), \(\rho _m\)) from the SPIV/PLIF dataset and the planar data (\({\varvec{u}}_r\), \(\rho _r\)) generated at the previous iteration are processed by the same 4 steps of the algorithm. The way new planes from the SPIV/PLIF dataset and re-initialized planes are convected in the 3D space at the new algorithm iteration is explained in Sect. 3.1. The Taylor operator (Eq. 4) implies that a fluid particle moves in space with its own velocity without being subjected to any acceleration. In this scenario, the velocity data, \({\varvec{u}}_m\) or \({\varvec{u}}_r\), that is initially lying on a 2D plane is redistributed into new locations in the 3D space, but the values remain unchanged. In Sect. 3.5, we demonstrate with a simple test case that the assumption of zero-acceleration on the fluid particle motion can introduce non-physical distortions on the reconstructed flow field. In Sect. 3.5, we also propose a solution to this issue by introducing a first order correction on the fluid acceleration, which makes the velocity value associated with a moving fluid particle change in time. When this correction is applied, the initial velocity data, \({\varvec{u}}_m\) or \({\varvec{u}}_r\), change into \(\tilde{{\varvec{u}}}_m\) or \(\tilde{{\varvec{u}}}_r\) at the end of the convection step.
Since numerical errors may accumulate as the reconstructed volume extends away from \(z=0\), the use of both forward and backward integration in time for convecting the data planes is preferred over a reconstruction that convects only in one direction. The reconstruction of the upstream and downstream regions of the volume is done separately by applying the same iterative procedure to the corresponding sets of data planes.

Schematic representation of the forward and backward convection procedure: (left) time sequence of images recorded at \(z=0\) at times \(t_1> t_2>\cdots>t_{N_m-1}>t_{N_{m}}\); (right) spatial distribution of the image data at time \(t_V = t_{i_c}\) under the effect of the Taylor operator. The volume reconstruction is centered on the \(i_c\)-th image (highlighted by the black dashed contour). As an example, the images show contours of the streamwise velocity w(x, y)

Framework of the reconstruction algorithm: (i) velocity and density data planes are convected into the 3D space and are moved into the new positions \(\left( X_s,Y_s,Z_s\right)\). The data convection is applied both to the data planes (\({\varvec{u}}_m\),\(\rho _m\)) from the SPIV/PLIF dataset and to the re-initialized data planes (\({\varvec{u}}_r\),\(\rho _r\)) generated at the previous algorithm iteration. While the density values do not change during the convection process, the velocity data might change into \(\tilde{{\varvec{u}}}_m\) (or \(\tilde{{\varvec{u}}}_r\)) if an acceleration on the fluid particle trajectory is considered; (ii) the 3D interpolation provides the velocity \(\hat{{\varvec{u}}}_h\) and density \({\hat{\rho }}_h\) fields on a rectangular volume \(\varOmega _h\) (represented by the black lines in figure) defined on a regular grid \((x_h,y_h,z_h)\); (iii) numerical solvers are applied to regularize the velocity field \(\hat{{\varvec{u}}}_h\) into \({\varvec{u}}_h\). No regularization is applied to the density field \({\hat{\rho }}_h\); (iv) the velocity and density fields are re-sampled on (x, y)-planes at different locations \(Z_r\) and on the initial pixel grid \(\left( X_m,Y_m\right)\), providing the new planar data \({\varvec{u}}_r\) and \(\rho _r\) used for the convection step at the next algorithm iteration. For the example shown in figure, the algorithm iteration starts with three planes (\({\varvec{u}}_r\),\(\rho _r\)) generated at the previous iteration, and \(n_s = 2\) new planes (\({\varvec{u}}_m\),\(\rho _m\)) from the SPIV/PLIF dataset are introduced at step (i)
3.1 Forward/backward advection of data planes
The algorithm initializes the reconstruction at a time \(t_1\) by setting the \(i_1\)-plane at \(z=0\) for the forward convection, or alternatively at a time \(t_{N_m}\) by setting the \(i_{N_m}\)-plane at \(z=0\) for the backward convection. At each iteration, a subset \(n_s\) of the available planes is added to the reconstruction, and, during the convection step, the reconstruction is evolved forward/backward in time for a duration of \(n_s\varDelta t\). A fluid particle is associated with each data point of each plane, and as the flow is integrated forward/backward in time, the fluid particles move with their own velocity by carrying the properties of the flow, i.e., the fluid velocity and the fluid density. The velocity and density data, (\({\varvec{u}}_{m,i}\), \(\rho _{m,i}\)), associated to the i-th plane of the SPIV/PLIF dataset are convected into the 3D space for a time-of-flight \(t_{\mathrm{conv}}\), from their initial position \({\varvec{X}}_{m,i}=\left( X_{m,i},Y_{m,i},0\right)\), i.e., the \(z=0\) plane, to their final position \({\varvec{X}}_{s,i}=\left( X_{s,i},Y_{s,i},Z_{s,i}\right)\), by applying the Taylor operator (Eq. 4) discretized in a Lagrangian framework:
with the \(+\) and − signs being used, respectively, for the forward and backward convection, and where the subscript s stands for “scattered data.” The same equation applies to the data of the i-th plane generated at the previous iteration, (\({\varvec{u}}_{r,i}\), \(\rho _{r,i}\)), although the initial position of the fluid particles, \({\varvec{X}}_{r,i}=\left( X_{m,i},Y_{m,i},Z_{r,i}\right)\), belongs to a plane at a z-location different from that of the measurement plane \(z=0\). Because the data planes are associated to different times with respect to the time of reconstruction, the time-of-flight \(t_{\mathrm{conv}}\) varies accordingly. The planes produced by the previous iteration, (\({\varvec{u}}_r\), \(\rho _r\)), are advected forward/backward for a time \(t_{\mathrm{conv}} = n_s \varDelta t\). The newly introduced planes, (\({\varvec{u}}_m\), \(\rho _m\)), are each added to the reconstruction by convecting them with a decreasing \(t_{\mathrm{conv}}=n \varDelta t\), with \(n=n_s-1,\ldots ,0\). For instance, for a subset of 2 planes with \(n_s=2\), the first new plane is moved for a time \(t_{\mathrm{conv}}=(n_s-1)\varDelta t=\varDelta t\), and the second plane for a time \(t_{\mathrm{conv}} = 0\cdot \varDelta t\), so that no advection is required. Evolving the reconstruction for a time \(n_s\varDelta t\) that is a multiple integer of the sampling time step \(\varDelta t\) allows the algorithm to always end the convection step with a new plane from the SPIV/PLIF dataset located at position \(z=0\). The number \(n_s\) of planes added at the beginning of each iteration can be increased to reduce the computational time of the reconstruction, but is limited by the numerical stability requirements on \(t_{\mathrm{conv}}\) (see Sect. 4.2).
3.2 Layer interpolation with radial basis functions (RBF)
The interpolation of the 3D scattered data into a regular mesh grid (step (ii) in Fig. 2) is required for (i) the computation of the spatial derivatives and the application of numerical solvers and for (ii) re-initializing the particle fluid positions for the next algorithm iteration. The interpolation of 3D scattered data is commonly carried out by means of radial basis functions (RBF), which are interpolating functions that depend only on the norm of the distance from the center of the RBF (Hardy 1971).
For a set of \(N_s\) data points and with the generic j-th point defined on the spatial coordinates \({\varvec{x}}_{s,j} = \left( x_{s,j},y_{s,j},z_{s,j}\right)\), the interpolating function \(f({\varvec{x}})\) is defined by
where \(\phi (r)\) is the RBF, which is function of the radial distance r, and \(\xi _j\) are the weights associated with each RBF. In this case, the variable f can represent one of the velocity components or the density. For an interpolation problem, a RBF is centered at each interpolation point, so that the number of RBF used is equal to \(N_s\). By evaluating Eq. 8 at each interpolation point \(\left( {\varvec{x}}_{s,j},f_j\right)\), a linear system of equations needs to be solved for the weights \(\xi _j\).
The number of planes that are convected into the 3D space increases by \(n_s\) at each algorithm iteration. The data convection can then produce a large amount of scattered data that requires a computationally efficient interpolation strategy. In order to limit the computational costs and the memory requirements, we employed compactly supported RBF (CSRBF). From this family of interpolating function (Smolik and Skala 2018), we considered the following type of CSRBF:
where a is a shape parameter that allows to control the extension of the RBF support. Because a CSRBF does not produce any contribution for \(r > 1/a\), the interpolation matrix becomes sparse, drastically reducing computational costs and memory requirements. The parameter a needs to be carefully selected in relation to the spacing characterizing the scattered data distribution. The support size \(a^{-1}\) of the RBF cannot be chosen smaller than the largest distance between two spatially adjacent interpolation points, otherwise the interpolation function (8) would be composed by “holes”, with zeros in the resulting velocity/density fields. If the RBF support is too large, the interpolation matrix loses its sparsity and may become ill-conditioned. Consequently, the RBF would provide contributions to regions of the space that are very far from the center of the RBF, leading to an interpolation function that is “blobby” and to the loss of the small structures in the interpolated field.
Unfortunately, the velocity/density scattered data set generated by the convection step is, by construction, characterized by regions with very different spacing between the data points. The convection of planes provides a data structure that is distributed in layers, with each layer composed by a dense cloud of data points that are characterized by an average spacing that is usually smaller than the spacing between different layers (see step (i) of Fig. 2). Because of this wide variation in the density of the scattered data, there is not an optimal shape parameter a that provides an interpolation function that well connects the layers to each other and, simultaneously, maintains the smallest field structure that each layer is composed of. Methods for solving this specific issue exist, e.g., the multistage method introduced by Floater and Iske (1996), but their implementation is not simple and, in spite of the sparsity of the interpolation matrix that can be obtained with CSRBF, the 3D interpolation of all convected data planes requires solving linear systems that are still very big and require a lot of memory. By looking for a simpler and more computationally efficient algorithm, we used RBF interpolation with a different approach. The 3D RBF interpolation is applied separately to each of the convected data planes, and, successively, a 1D interpolation is applied along the z-direction for assembling all layers. In this way, the shape parameter a for the RBF can be chosen only in relation to the spacing characterizing one layer of scattered data, thus overcoming the issue of obtaining inaccurate interpolation between different layers. If \(N_l\) is the number of planes involved in a reconstruction step, instead of solving an interpolation problem with size \(\left( N_x N_y N_l\right) ^2\), \(N_l\) linear systems with size \(\left( N_x N_y\right) ^2\) are solved separately, thus drastically reducing the memory requirements and making its implementation easier for parallel-computing. Once the interpolation problem is solved for the i-th layer, the resulting interpolation function is evaluated at locations \((X_m,Y_m,Z_i)\), with \(\left( X_m,Y_m\right)\) corresponding to the grid of pixels of the original planes used for the reconstruction and with \(Z_i\) given by the evaluation in \(\left( X_m,Y_m\right)\) of the surface function \(z_i=f(x,y)\) provided by a 2D interpolation of the scattered data positions \(\left( X_{s,i},Y_{s,i},Z_{s,i}\right)\). This interpolation approach redefines the data of all layers on the same common grid \(\left( X_m,Y_m\right)\), which enables application of a simple 1D interpolation in the z-direction to data that belong to different layers. If at least two planes are introduced in the reconstruction at each iteration, that is if \(n_s \ge 2\), a cubic spline interpolation in the z-direction is used at each node of the grid \(\left( X_m,Y_m\right)\), otherwise a simpler linear interpolation is applied. The 1D interpolation is carried out over a range of z values that are fully contained in the volume regions spanned by the scattered data (see step (ii) in Fig. 2). For instance, in the case of forward convection, the data is interpolated over a distance \({\hat{L}}_z\) that spans from \(z=0\) to the lowest z value characterizing the furthest convected plane from the \(z=0\) plane. The final result of this interpolation algorithm provides the interpolated fields \(\hat{{\varvec{u}}}_h\) and \({\hat{\rho }}_h\) over the rectangular domain \(\varOmega _h\) defined by a uniform grid \((x_h,y_h,z_h)\) of \(N_x \times N_y \times N_z\) nodes and with dimensions \(L_x \times L_y \times {\hat{L}}_z\), in which \({\hat{L}}_z\) grows at each iteration.

In a, an instance of data distribution from a convected plane in relation to the initial image grid (black map on the background). In b, data distribution from the convection of a plane with padded boundaries. The red dashed lines indicate the initial grid size. The data considered in (a) and (b) are the same
Particular care needs to be taken for the interpolation of the data at the boundaries. Because of the in-plane (u, v) velocity components used in the convection process, the data can move outward or inward with respect to the image domain. As shown in Fig. 3a, when the data is moved toward the interior of the image domain, there are regions at the boundaries that are not covered by data and for which we cannot apply the interpolation in the z-direction. The extrapolation from the RBF interpolation function generates velocity/density values that are very small or zero when these regions have a size bigger than the RBF support size. This gives rise to numerical instabilities at the boundaries in which the velocity values diverge and, consequently, the convective motion of the flow data becomes unbounded. In order to cover these areas, the planes are extended at the boundaries by several pixels with a zero-order padding before performing the convection step (Fig. 3b). This strategy is meant to stabilize the reconstruction algorithm and to introduce velocity and density data at the boundaries with values that remain in the range of possible physical values characterizing the flow under investigation. The absence of flow data at the boundaries reflects the fact that the information is convected elsewhere and that these regions should be filled with information that is not available from the SPIV/PLIF dataset.
3.3 Recovering an incompressible velocity field
The hyperbolic character of Eq. 4 and 6 makes the flow field lose its non-local behavior. Each fluid particle moves with its own velocity and carries scalar properties, such as density, regardless of how the surrounding fluid evolves in time and space. Neglecting the pressure gradients can lead to reconstructed fields with artifacts in the turbulent energy spectrum: (i) “shocks” in the velocity and density fields, i.e., very strong non-physical gradients, may appear due to the fact that two fluid particles with very different velocities and densities can get arbitrarily close; (ii) the mechanism of energy transfer across different turbulent scales due to the non-linear interaction between vortex-stretching and fluid incompressibility is lost. These effects can result in erroneous reconstruction of the velocity and density gradients, which in turn may obscure the correct physical interpretations regarding important turbulence mechanisms such as energy cascade, strain-rate self-amplification, and intermittency.
As discussed in Sect. 2, if the fluid particles travel for a time \(t_{\mathrm{conv}}\) for which the variation in time of the carried velocity is negligible, the vorticity field \({\varvec{\omega }}_{h} = \nabla \times \hat{{\varvec{u}}}_h\) approximately satisfies the correct form of the vorticity transport equation, although \(\nabla \cdot \hat{{\varvec{u}}}_h \ne 0\). Based on this idea, an updated velocity field \({\varvec{u}}_h\) that satisfies \(\nabla \cdot {\varvec{u}}_h = 0\) can be recovered from the vorticity field \({\varvec{\omega }}_h\) by solving the Poisson equation on the rectangular volume \(\varOmega _h\),
which is completed by Dirichlet conditions \({\varvec{u}}_h = \hat{{\varvec{u}}}_h\) at the volume boundary \(\partial \varOmega _{h}\) (step (iii) in Fig. 2).
Eq. 10 derives from the kinematic relationship between velocity and vorticity, and none of the dynamical features of the Navier–Stokes equations are directly involved. However, it allows us to correct the velocity field and to emulate the role of the pressure gradients in maintaining a divergence-free flow field. Since the convective velocity employed at step (i) corresponds to the instantaneous velocity, the Poisson equation enforces the incompressibility constraint both on the intermediate reconstruction of the 3D velocity field and on the convective field that will be used at the next algorithm iteration for further moving velocity and density data through space. Therefore, the iterative application of Eq. 10 provides more than a simple spatial regularization of the reconstructed velocity and has a direct effect on the reconstruction process, since it updates the convective field at each iteration.
The 3D Poisson problem is numerically solved by second-order centered finite differences in the interior of domain, and first-order finite differences at the volume boundaries, with a spacing h defined by the 3D interpolation performed in the previous step. The resulting linear system is iteratively solved by a conjugate gradient method. The velocity field imposed on the face of the volume at the plane \(z=0\) is provided by the measured velocity \({\varvec{u}}_m\) and is not affected by the Taylor’s hypothesis. The velocity field on the other five faces of the rectangular volume \(\varOmega _h\) derives from the convection step, which is based on the frozen turbulence hypothesis. Consequently, the velocity field along these boundaries is not updated and any artifact on the gradient fields introduced by the convection step is not smoothed out. This does not lead to any numerical instability during the reconstruction process, since these flow regions are convected at successive iterations either to the outside, in which case the flow data are lost, or to the inside of the reconstruction domain, in which case the flow data are regularized by Eq. 10.
3.4 Planar data re-sampling
At the end of each iteration, the planar data are re-initialized at z-planes taken from the interior of the regularized flow field (step (iv) in Fig. 2). The re-initialized data planes, (\({\varvec{u}}_r\), \(\rho _r\)), are extracted at different and equidistant locations \(Z_{r}\) and are defined on the same (x, y)-grid of the original SPIV/PLIF data planes, i.e., \(\left( X_m,Y_m \right)\). The re-sampled planes are then processed at the next iteration with the same procedure previously described. The data plane at \(z=0\) is kept among the re-sampled z-planes, since it corresponds to the original, unmodified plane from the SPIV/PLIF dataset. In contrast, the boundary face of the volume \(\varOmega _h\) that is opposite to the \(z=0\) plane is excluded from the next iteration, since it was not regularized by the Poisson solver. The number of re-sampled planes is the same as the number of planes already convected forward/backward. Re-sampling the data on a higher number of planes at the end of one iteration would not improve the spatial resolution in the z-direction, as it cannot be higher than the spacing between convected planes, and would increase the computational time, since more data would need to be interpolated.
3.5 Streamline curvature correction for the data convection
The Lagrangian formulation provides a simple way of solving the Taylor operator, as it does not involve the numerical issues that typically affect Eulerian methods, e.g., numerical instabilities, which require the use of upwind schemes, and unwanted numerical diffusion, which can be avoided by using high-resolution methods (LeVeque 2002). Nevertheless, it suffers of other types of issues when the time-of-flight of the fluid particles, i.e., the image sampling time step, is too large. The use of linear particle trajectories, as in Eq. 7, in flows characterized by intense vortical structures may result in a distortion of the advected flow field, with the expansion and the consequent weakening of these vortices. This effect can be shown by testing the Lagrangian convection process on an analytical solution. With this intent, we considered a Gaussian vortex that is advected with uniform speed \(W_{c}\) in the z-direction across the measurement (x, y)-plane (again set for convenience at \(z=0\)) and with its vortex axis in the direction of advection. The tangential velocity \(V_{\theta }\) of the Gaussian vortex as a function of the radial position r from the vortex center is
where \(\varGamma\) is the vortex circulation, \(\gamma\) is a parameter, and \(r_{c}\) is the radius of the vortex. When \(\gamma = 1.256\), the tangential velocity is maximum at \(r = r_c\). Figure 4a shows the vorticity magnitude and the x-component of the velocity fields in the (x, y)-plane of the Gaussian vortex. Because the 3D field we are aiming to reconstruct is a Gaussian vortex that extends infinitely in the z-direction, the data convection process should reproduce the same, unmodified 2D flow field shown in Fig. 4a. For this particular flow field, if the uniform convective velocity \(W_{c}\) is used for the fluid particle motion, the advected planar data remains exactly the same, and the velocity field is perfectly reconstructed. This is not because the actual fluid particle velocity corresponds to \(W_{c}\), but because as the vortex is moved forward the fluid particles are coincidentally substituted by other fluid particles with the same velocity vector.

Application of the data plane convection procedure to a Gaussian vortex advected with speed \(W_{c}\) in the z-direction, and with \(r_c = 0.5\) m, \(\varGamma = 3\) m\(^2\)/s, and \(\gamma = 1.256\). The top images show the x-component of the velocity vector and the bottom images show the vorticity magnitude \(\Vert {\varvec{\omega }}\Vert _2\): a the exact solution; b the convected field with linear fluid particle trajectories; c the convected field with curvature correction on the fluid particle trajectories. For b and c, the data plane has been convected for a duration of 0.4 s
Figure 4b shows how the use of the local instantaneous velocity for the fluid particle convection (Eq. 7) leads to a distortion of the velocity field that follows the deformation of the particle mesh grid, and to the expansion and weakening of the vorticity field. This result has been obtained by applying four iterations of the algorithm described in the previous sections to a set of planes sampled at the measurement plane \(z=0\) with a sampling time step of \(\varDelta t =\) 0.1 s. At each iteration, the four steps of the procedure are performed: (i) data convection (Sect. 3.1), (ii) 3D interpolation (Sect. 3.2), (iii) Poisson regularization (Sect. 3.3), and (iv) data planes re-initialization (Sect. 3.4). At the convection step, the flow is evolved forward in time for a duration of 0.1 s, which corresponds to convecting forward one data plane at a time (\(n_s=1\)). With four algorithm iterations, the data are convected forward for a total duration of \(4 \times 0.1\) s \(=\) 0.4 s, which is about double the smallest characteristic time of fluid rotation of the vortex, i.e., \(1/\omega _{max} \sim\) 0.2 s. In numerical simulation, the integration time step can be arbitrarily reduced and the problem of vorticity distortion can be overcome by re-meshing the deformed particle mesh on the initial uniform grid at each iteration of the numerical solver (Rossinelli and Koumoutsakos 2008). Although the current reconstruction algorithm performs the re-initialization of the fluid particle position at the end of each iteration, the time-of-flight \(t_{\mathrm{conv}}\) cannot be smaller than the sampling time step used for performing the SPIV and PLIF measurements. Therefore, if the measurement sampling time step is too large with respect to the characteristic time of fluid rotation, the expansion and weakening of the vorticity structures cannot be avoided.
This issue can be reduced by introducing a correction to the fluid particle motion that at least takes into account for the curvature of the flow streamlines within the measurement plane. If \({\varvec{u}}_0={\varvec{u}}({\varvec{X}}_{p}(t_0))\) is the initial velocity of a particle and if the explicit time dependency of the particle velocity is neglected, the variation of the velocity at a time \(t_0 + \delta t\) can be approximated by a first order Taylor expansion as
Eq. 12 approximates the material derivative of the velocity with the advection term, \(D {\varvec{u}}/Dt \approx {\varvec{u}}\cdot \nabla {\varvec{u}}\), by neglecting the Eulerian time derivative. This yields a linear variation of the velocity and a parabolic trajectory for the fluid particles’ motion, and if we set \(\delta t = t_{\mathrm{conv}}\), Eq. 7 becomes:
where \({\varvec{{\tilde{u}}}}_{m,i}\) is the velocity vector at the end of the data convection. The same type of equation applies to the data of the planes generated at the previous iteration, (\({\varvec{u}}_r\), \(\rho _r\)), for which the velocity vector is transformed into \(\tilde{{\varvec{u}}}_r\). Because SPIV data provides only the in-plane components of the velocity gradients, the streamline curvature correction is applied only for the x and y components of the velocity. Figure 4c demonstrates that the first order correction introduced by Eq. 13 maintains the vortical strength and eliminates the distortion on the velocity field. The approximated fluid acceleration can solve this issue if the time-of-flight is not too large. Because Eq. 13 provides an approximation of the fluid acceleration, the parabolic trajectory can sometime lead to errors in the reconstructed field. In the following sections, we will perform reconstructions using either Eq. 7 or Eq. 13 for the data convection, and we will compare the resulting performance.
4 Practical aspects on the reconstruction algorithm
4.1 Spatial resolution of the reconstruction
The spatial scales resolved in the out-of-plane and in-plane directions might be quite different, depending on the speed of convection and the sampling rate. Following the Nyquist–Shannon theorem, the smallest scales resolved by PIV over the measurement plane are
where \(\delta\) is the smallest size of the interrogation window used for cross-correlation. The smallest scales resolved by PLIF are twice the size of the CCD pixel. The spatial resolution in the convective direction is determined by the local convection speed \(W_{c}\) and the time separation \(\varDelta t\) between two PIV/PLIF acquisitions:
Because the turbulent structures are convected through the measurement plane at a speed \(W_{c}\), the time sequence of measured velocity fields is composed of frequencies that are higher than those estimated from the Kolmorogov time scale \(\tau _{\eta }\). In a Lagrangian framework, the rate of change of the smallest eddies in the flow is of the order of \(\tau _{\eta }^{-1}\), while, from an Eulerian point of view, the rate of change of the velocity measured at a fixed location is determined by the convected Kolmogorov length scale, i.e., \(\tau _{\mathrm{Eul}}^{-1}=(\eta /W_{c})^{-1}\). The separation between Lagrangian and Eulerian microscales increases with \(Re_c^{1/4}\), with \(Re_{c}\) based on \(W_{c}\) and a corresponding eddy size defined by the dissipation rate \(\epsilon\), \(\ell _{c} \sim W_{c}^3 / \epsilon\) (Corrsin 1963; Pedrizzetti and Novikov 1994; Romano 1995).
The Taylor’s hypothesis can provide spatially resolved reconstruction in the direction of convection, that is \(\lambda _{z} \le \eta\), only if
For a flow with given \(\epsilon\) and viscosity \(\nu\), flow regions characterized by higher convective speeds \(W_{c}\) provide more stringent requirements on the sampling time step \(\varDelta t\).
4.2 Limitations on the time of convection \(t_{\mathrm{conv}}\)
The numerical stability of the reconstruction algorithm is guaranteed if penetrations of the fluid material into itself do not occur during the convection process. When linear fluid particle trajectories are considered for the convection step (Eq. 7), the condition of non-penetration is translated into the following requirement for the time of convection \(t_{\mathrm{conv}}\)
which commonly applies to numerical solvers based on a Lagrangian formulation (see for instance Schneiders et al. 2014). The above requirement is also in line with the condition on \(t_{\mathrm{conv}}\) for favoring the preservation of the intensity and the size of the intense vortical coherent structures during the convection process (Sect. 3.5). If we consider only the streamwise component of the velocity gradient and we neglect the in-plane velocity components, the condition 17 simplifies to
where a simplified version of the Taylor operator has been used. Eq. 18 shows that the limitations on the maximum time of convection can be relieved if the velocity data is properly filtered in time in relation to the sampling time step \(\varDelta t\), at the cost of losing accuracy in the reconstruction.
When the curvature correction, Eq. 13, proposed in Sect. 3.5 is applied to the fluid particle trajectories, the stability condition for \(t_{\mathrm{conv}}\) assumes a different form of that of Eq. 17:
Since this requirement is more stringent than condition 17, the use of parabolic trajectories for the fluid particle motion requires a smaller \(t_{\mathrm{conv}}\) and, consequently, a smaller time step \(\varDelta t\) for the SPIV/PLIF acquisitions in order to guarantee the numerical stability of the reconstruction algorithm. Further details on the mathematical derivation of the stability conditions 17 and 19 can be found in the Appendix.
5 Numerical assessment
For the validation of the proposed algorithm, the method is applied to DNS data available at the Johns Hopkins University Turbulence Database. We chose to use the data related to the channel flow simulation at \(Re_b = 2HW_b/\nu = 40000\), with H half the channel height, \(W_b\) the bulk velocity, and \(\nu\) the kinematic viscosity. This dataset provides flow data with enough time resolution for the validation of the method and allows us to investigate the performance of the algorithm on flow regions with differing shear characteristics: (i) at the channel centerline, and (ii) close to the wall. For the former case, the mean velocity field is uniform and the transverse velocity components are relatively low with respect to the streamwise velocity component. The second region is characterized by a shear flow profile, in which the transverse velocity components play a more important role in the flow. As illustrated in Fig. 5, the Cartesian coordinate system is defined such as the z-axis is oriented toward the channel flow direction, the y-axis defines the coordinate in the direction normal to the channel walls, and the x-axis defines the coordinate position in the spanwise direction. 2D images in the (x, y)-plane have been extracted at a fixed z position and at different times t. The volume reconstructed from the images is compared to the corresponding 3D numerical solution. In the following analysis, three different reconstruction methods are tested: (i) the “Inst” method, (ii) the “Inst-curv” method, and (iii) the “Mean” method. The “Inst” and “Inst-curv” methods correspond to the reconstruction algorithm described in Section 3, where the four steps of data convection, 3D interpolation, Poisson regularization, and plane re-initialization are performed at each iteration. Both methods use all three components of the local instantaneous velocity, i.e., \({\varvec{u}} = (u,v,w)\), for the convection of the data planes into the 3D space, but while the “Inst” method considers linear trajectories for the fluid particles’ motion (Eq. 7), the “Inst-curv” method applies the streamline curvature correction (Eq. 13) discussed in Sect. 3.5. The “Mean” method convects the data planes using the 2D profile of the mean streamwise velocity, i.e., \({\overline{w}}(x,y)\), and, unlike the “Inst” and “Inst-curv” methods, no Poisson regularization is applied during the convection process. The “Mean” method is identical to the common method of reconstruction of 3D flows from 2D SPIV data employed in previous works (e.g., Ganapathisubramani et al. 2008).

Coordinate system of the channel flow from the Johns Hopkins Database. The two highlighted areas represent the flow regions considered for testing the reconstruction algorithm
All variables are non-dimensional, with H and \(W_b\), respectively, as the reference length and the reference speed. The flow data from the Turbulence database is provided on a frame of reference moving toward the main flow direction at a non-dimensional constant speed of 0.45. The resulting convective speed is therefore lower than that measured on a frame of reference fixed to the channel walls. Consequently, more images are required to reconstruct a volume with a given width and for a given image acquisition rate, and the separation between Eulerian and Lagrangian time scales is also reduced.
Table 1 summarizes the most important parameters of the two flow regions. The non-dimensional Kolmogorov length and time scales, \(\eta\) and \(\tau _{\eta }\), have been estimated separately for each flow region from the computed maximum dissipation rate. The Eulerian time scale has been computed from the Kolmogorov length scale and the mean streamwise velocity characterizing the flow region under consideration. The non-dimensional sampling frequency \(f_s\) characterizing the image dataset has been chosen differently for the two flow regions. For the uniform flow case, \(f_s\) has been set to 15.38, which corresponds to an acquisition time step \(\varDelta t\) that is 0.6 times \(\tau _{\eta }\) and 15.5 times \(\tau _{\mathrm{Eul}}\). For the shear flow case, \(f_s\) has been doubled, with \(\varDelta t = 10.8 \tau _{\mathrm{Eul}} = 0.79 \tau _{\eta }\). Because the highest intensity of the vortical structures in the shear region is about double of those in the uniform region, the modification on the sampling frequency allows a more meaningful comparison of the performance of the algorithm in the two flow regions. For the “Inst” and “Inst-curv” methods, a subset \(n_s=2\) of planes is introduced into the reconstruction at each algorithm iteration, which corresponds to having a forward/backward in time integration of \(2\varDelta t\) at each convection step. This provides a maximum time-of-flight \(t_{\mathrm{conv}}\) that is small enough to not cause any penetration of fluid material into itself during the convection process (conditions 17 and 19).
5.1 Coherent structures reconstruction
Figures 6 and 7 show contours of the vorticity magnitude field for the uniform flow and the shear flow regions. The orange surfaces represent the most intense vortical structures, while the blue transparent regions show surfaces of vorticity magnitude with lower intensity. The exact solution is compared with the reconstructed 3D fields given by the “Mean,” the “Inst,” and the “Inst-curv” methods. Although many of the long coherent structures are recovered, none of the methods can consistently reproduce all of them.

Isocontours of high vorticity magnitude in the uniform mean velocity region. The orange surfaces correspond to \(\Vert {\varvec{\omega }} \Vert _2\) = 4, and the blue transparent ones to \(\Vert {\varvec{\omega }} \Vert _2\) = 3: a the exact solution; b the reconstruction based on the local mean streamwise velocity (“Mean”); c the reconstruction based on the local instantaneous velocity (“Inst”); d the reconstruction based on the local instantaneous velocity and the application of the curvature correction on the fluid particle motion (“Inst-curv”). The black arrows indicate similar vortical structures across all volumes

Isocontours of high vorticity magnitude in the shear flow region. The orange surfaces correspond to \(\Vert {\varvec{\omega }} \Vert _2\) = 8, and the blue transparent ones to \(\Vert {\varvec{\omega }} \Vert _2\) = 6: a the exact solution; b the reconstruction based on the local mean streamwise velocity (“Mean”); c the reconstruction based on the local instantaneous velocity (“Inst”); d the reconstruction based on the local instantaneous velocity and the application of the curvature correction on the fluid particle motion (“Inst-curv”). The black arrows indicate similar vortical structures across all volumes
For the uniform flow case, the reconstruction based on the local mean streamwise velocity (Fig. 6b) recovers many of the coherent structures. As expected from the discussion presented in Sect. 3.5, the “Inst” method produces a 3D field in which some of the high-intensity vorticity surfaces disappear and are found at a lower magnitude level (Fig. 6c) as a result of the expansion/weakening effect introduced by the use of linear fluid particle trajectories. The curvature correction introduced by Eq. 13 is able to fix this issue and maintain the original intensity of the vortical structures (Fig. 6d). Since there is no shear layer in this flow case, term 2 of Eq. 3 is absent, and any difference in the results between the “Mean” method and the “Inst” or the “Inst-curv” method is solely due to term 3 of Eq. 3, i.e., the fluctuations on the convective velocity. A comparison of the reconstructed fields with respect to the ground truth reveals that as we get further from the central plane, \(z=0\), the “Mean” method seems to slightly misplace the vortical structures both in the z-direction and in the (x, y)-plane, while the structures given by the “Inst” and the “Inst-curv” algorithms are better located (see for instance the surfaces indicated by the black arrows in Fig. 6). The fluctuations on the convective velocity, which are taken into account by the “Inst” and “Inst-curv” methods, might be negligible with respect to the local mean streamwise velocity field, but their contributions become significant for large reconstructed volumes as the error in the convective speed accumulates while moving the planar data away from the starting location, \(z=0\). This observation will be corroborated by the error analysis presented in the next section.
For the shear flow case, the improvement provided by the reconstruction methods based on the instantaneous velocity is more evident. Because of the non-zero spatial gradients on the mean streamwise velocity, term 2 of Eq. 3 provides an important contribution to the speed and direction of the convection of the flow properties. Moreover, the velocity fluctuations in the shear layer are more intense than those characterizing the uniform flow region, and, therefore, the contributions given by term 3 of Eq. 3 are even more important for this flow case. A comparison of Fig. 7a with Fig. 7b shows that the “Mean” reconstruction generates a vorticity field in which the coherent structures are wrongly located and wrongly oriented in space. From this point of view, the “Inst” and the “Inst-curv” methods are, instead, more accurate (see for instance the surfaces indicated by the black arrows in Fig. 7). As in the uniform region case, some of the vorticity regions lose their intensity in the volume reconstructed by “Inst” (Fig. 7c), and, once again, the application of the curvature correction on the fluid motion allows better recovery of the strength of the strongest vortical structures (Fig. 7d). The approximation of the material derivative seems, however, to also introduce small inaccuracies in the orientation of some of the isosurfaces.

Isocontours of high vorticity magnitude in the shear flow region provided by the “Mean” method when the iterative Poisson regularization is included in the convection process. The orange surfaces correspond to \(\Vert {\varvec{\omega }} \Vert _2\) = 8, and the blue transparent ones to \(\Vert {\varvec{\omega }} \Vert _2\) = 6. The black arrows indicate the same vortical structures indicated in Fig. 7
In order to better understand the contribution given by the Poisson regularization on the reconstruction accuracy, we analyzed the effects of including the iterative Poisson regularization in the convection process of the “Mean” method. The Poisson equation is applied in the same way, it is done for the “Inst” and the “Inst-curv” methods, that is: (i) a few planes are convected forward/backward with the convective velocity defined in the “Mean” method, i.e., \({\overline{w}}(x,y)\); (ii) the resulting scattered data is interpolated on a rectangular volume; (iii) the Poisson equation is applied to the velocity field; (iv) the planes are re-initialized and used at the next algorithm iteration. As an example, Fig. 8 reports the resulting vorticity field for the shear flow case. The comparison between the vorticity field of Fig. 7b (the “Mean” method) with that of Fig. 8 (the “Mean” method with Poisson regularization) demonstrates that the position of the vortical structures does not change if the incompressibility is enforced. The only visible effect provided by the Poisson equation is the smearing of the velocity gradients caused by the application of the Laplacian operator (Eq. 10), which also contributes to weaken the strength of the vortical structures produced by the “Inst” and the “Inst-curv” methods. The results shown in Fig. 8 do not mean that the Poisson equation does not play any important role in the “Inst” and “Inst-curv” methods. In fact, it is very important to their success in better reconstructing highly turbulent flows. When the local instantaneous velocity is used for convecting the data planes, the Poisson regularization avoids the occurrence of non-physical strong velocity gradients, which would eventually lead to a penetration of the fluid material into itself during the convection process and, consequently, to numerical instabilities preventing the convergence of the reconstruction. There is a substantial difference in enforcing the incompressibility when the local instantaneous velocity is used for the data convection versus using the mean streamwise velocity. When \({\overline{w}}(x,y)\) is used, the Poisson equation enforces zero-divergence on the reconstructed velocity, but the convective field is not updated and remains the same \({\overline{w}}(x,y)\). In contrast, when the convective velocity is defined as the local instantaneous velocity, the Poisson regularization plays an active role in the reconstruction process since it enforces the incompressibility also on the convective field, which will be used at the next iteration for moving the flow data in space.
This qualitative analysis demonstrates that the use of \({\overline{w}}(x,y)\) for the data convection might provide a fairly good reconstruction in a uniform mean flow region (as Taylor originally postulated) but it fails to accurately reproduce the spatial distribution of the vorticity field in shear flows. In contrast, the reconstruction based on the instantaneous velocity correctly convects in space the flow properties, since it takes into account all components of the transport velocity, the fluctuations on the convective velocity (term 3 of Eq. 3), and the effects introduced by the spatial gradients on the mean velocity field (term 2 of Eq. 3).
5.2 Reconstruction error
To provide a more quantitative evaluation of the reconstruction accuracy, the deviation of the reconstructed velocity field from its ground truth has been investigated. We defined an integral error function that depends on the z-position and that integrates the relative velocity error over the (x, y)-plane:
where \({\varvec{u}}_{\mathrm{rec}}\) is the 3D reconstructed velocity field, and \({\varvec{u}}_{\mathrm{ex}}\) is the exact solution.
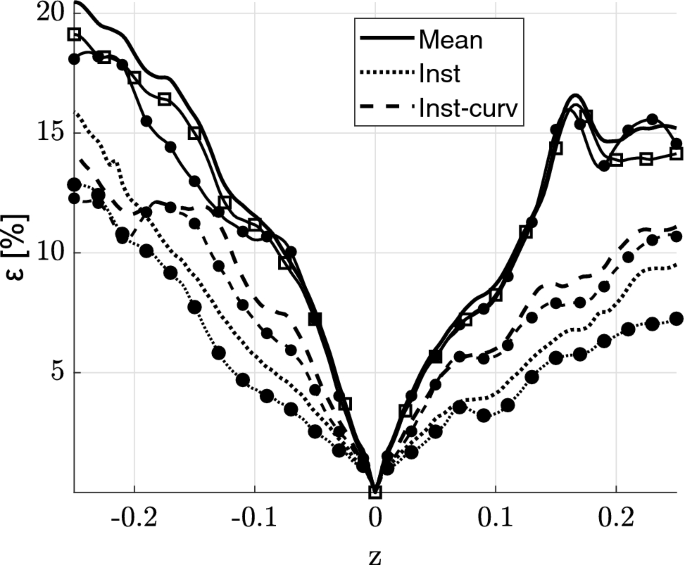
Figures 9 and 10 report the reconstruction error \(\varepsilon (z)\), respectively, for the center channel and the shear flow regions. As expected, the error at \(z =0\) is zero, since the reconstructed volumes are centered on a 2D slice of the exact 3D velocity field. As the distance from the measurement plane increases, the algorithm introduces errors in the reconstructed field.
In the uniform flow region, the error close to the central plane is similar for all three methods. The local mean streamwise velocity appears then to be a good approximation for the convective velocity, at least for small volume reconstruction (Browne et al. 1983, George, Hussein, and Woodward 1989). While the mean velocity gradients (term 2 in Eq. 3) do not introduce any contribution, the contribution given by the velocity fluctuations on the convective field (term 3 in Eq. 3) becomes relevant for \(|z| > 0.05\), for which the methods based on the local instantaneous velocity are in general more accurate. The “Mean” method does not move the planar data in space with the right convective velocity, and neglecting the fluctuations \({\varvec{u}}'\) accumulates errors that misalign the coherent structures in space (Fig. 6).
For the shear flow case, even for regions very close to the central plane, the reconstruction error of the “Mean” method accumulates quickly, while the “Inst” method has errors lower than 5\(\%\) even for volume widths of \(|z|<0.1\). This suggests that both the fluctuations on the convective velocity and the spatial gradients on the mean velocity profile are not negligible with respect to the convection given by the local mean streamwise velocity. Therefore, the “Inst” algorithm might also provide relevant improvement in shear flows on the inferred out-of-plane spatial derivatives, even for statistical analysis of small and intermediate turbulent scale structures.
In both flow regions, the “Inst” method provides the most accurate results. In the uniform flow case, the maximum error at the volume extremities is reduced from 4 to 2\(\%\) with respect to the “Mean” method. For the shear flow case, the error is drastically reduced, from 10 to 5\(\%\) in the region \(|z| < 0.1\) and from 18 to 12\(\%\) in the region \(|z| < 0.2\). Although some of the strongest vortices are weakened in the reconstruction because of the expansion effect introduced by the use of linear fluid particle trajectories, the data planes are convected with the right speed and direction. As shown in Figs. 6 and 7, the use of the local instantaneous velocity for the reconstruction leads to the best results in terms of positioning and orientation of the coherent structures, and, consequently, the reconstruction error is reduced with respect to the “Mean” method.
The curvature correction on the fluid particle trajectories does not in general reduce the integral error with respect to the method based on simpler linear fluid particle trajectories. The approximation on the material derivative (Eq. 12) does not always provide an improvement in the accuracy since it may accelerate the fluid particles in the wrong way, likely introducing some incorrect deviations in the fluid motion, as also demonstrated by the mis-orientation of some coherent structures in the shear flow case (Fig. 7). As discussed in Sect. 5.1, the curvature correction better maintains the size and intensity of the high vorticity regions. The choice of whether or not to use the first order correction on the fluid particle trajectories will then be the result of a trade-off between reconstruction accuracy and the correct recovery of the intensity and size of the coherent structures. The “Inst-curv” method does provide, nevertheless, more accurate results than the “Mean” method.

Reconstruction error as a function of z for the results at the channel centerline. The solid line curve with the square symbols represents the reconstruction error for the “Mean” method including the iterative Poisson regularization. The curves with the dot marks represent the reconstruction error computed on the cropped volume
Reconstruction error as a function of z for the results at the shear flow region. The solid line curve with the square symbols represents the reconstruction error for the “Mean” method including the iterative Poisson regularization. The curves with the dot marks represent the reconstruction error computed on the cropped volume
Part of the errors introduced by the reconstruction algorithm are due to the missing information of flow data at the inflow boundaries, which is substituted with information taken from the inside (Fig. 3). Figures 9 and 10 also report the reconstruction error computed by cropping the volumes at the boundaries, by reducing the volume size in x- and y-directions. As expected the error reduces as the inaccuracies introduced at the boundaries are removed. In the uniform flow region, the gain in accuracy is somehow limited, except for the “Inst” method in the \(z>0\) region. The in-plane velocity components are relatively lower than the streamwise velocity component, so that the amount of information that is coming from the volume sides is in general negligible with the respect to the amount of flow data that is crossing the measurement plane. In contrast, for the shear flow region, the accuracy of the “Inst” and “Inst-curv” methods increases even in regions close to the central plane \(z=0\). This is not the case for the “Mean” method, for which the error remains the same along most of the volume width. This suggests that the errors introduced by the “Mean” reconstruction are mainly due to the use of the wrong convective velocity. The gain in accuracy is, instead, more significant for the “Inst” method, with maximum errors that reduce to 7.5\(\%\) for \(z>0\) and to 13\(\%\) for \(z<0\).
As discussed in the previous section, enforcing the incompressibility does not provide more accurate reconstructions when \({\overline{w}}(x,y)\) is used for the data convection. Figures 9 and 10 also report the reconstruction error for the “Mean” method when the iterative Poisson regularization is included in the convection process (the solid line with square symbols), showing small or no improvements with respect to the unmodified “Mean” method. This further corroborates the conclusion that the “Inst” and the “Inst-curv” methods provide more accurate reconstructions because of the better definition of the convective velocity used for distributing the planar data into the 3D space.
6 Application to experimental data
The validated algorithm is applied to SPIV and PLIF measurements performed in a variable-density flow to demonstrate its capabilities in reconstructing 3D velocity and density fields from experimental data. Experiments on a \(\hbox {SF}_6\) jet flow expanding in a co-flow of air have been conducted on the Turbulent Mixing Tunnel (TMT) facility at Los Alamos National Laboratory (Fig. 11). The air coflow is forced through a tunnel with a square cross-section of \(0.524 \times 0.524\) m\(^2\) and the \(\hbox {SF}_6\) jet is issued downward from a circular copper pipe located at the center of the tunnel and with an inner diameter of \(D = 11\) mm. For the adopted Cartesian coordinate system (illustrated in Fig. 11), the z-axis is oriented toward the main jet flow direction, while the x- and y-axes lie on the jet cross-section plane. By using high-speed cameras in conjunction with high repetition rate lasers, SPIV and PLIF have been carried out at a rate of \(f_s = 2.25\) kHz over a plane perpendicular to the jet flow direction. For the SPIV, the acquisition system is composed by two high-speed Phantom® VEO 640S cameras working in dual exposure mode, and the tagging system consists in a dual head Nd:YAG laser delivering 20 mJ/pulse at 532 nm. For the PLIF, an ultrahigh-speed Phantom® V2640 camera combined with an intensifier has been used for capturing the fluorescence emission of acetone vapor excited at 263 nm with an Nd:YLF-based UV laser capable of providing an average energy of 2.4 mJ/pulse. The acetone seeding is carried out by bubbling the \(\hbox {SF}_6\) through liquid acetone contained in a reservoir, which is maintained at a temperature of \(T_{Ac} = 19^{\circ }\) C by a recirculating water bath. At this temperature, the Antoine equation (Ambrose et al. 1974),
provides an estimated acetone vapor pressure at saturation, \(p_{Ac}\), of about 23.6 kPa. Since the gas pressure at the jet exit matches the ambient pressure, 77.6 kPa, and by assuming that the acetone vapor pressure always remains close to saturation, the acetone concentration at the pipe outlet is estimated to be about 30\(\%\). For PIV measurements, both the air co-flow and the acetone-\(\hbox {SF}_6\) mixture are seeded with 1-\(\mu\)m particles of diethylhexyl sebacate (DEHS) by means of two Laskin nozzles. The LaVision® software DaVis has been used for the perspective correction of both SPIV and PLIF images and for the PIV processing, which has been carried out with interrogation windows of \(32 \times 32\) pixels and \(75\%\) overlap. The PLIF images have been corrected by taking into account the laser beam profile and the laser energy attenuation by application of the Beer-Lambert law. The 2D density field is then inferred from the fluorescence intensity distribution by assuming that the decrease in acetone concentration in the flow is a sole consequence of the mixing between the jet and the air co-flow, thus neglecting the reduction in the fluorescence intensity due to the molecular diffusion of acetone in \(\hbox {SF}_6\). The overlap region between density and velocity measurements corresponds to an area of about \(7.7 \times 47.2\) mm\(^2\).

Schematic of the experimental facility implementing PLIF and SPIV used at the Turbulent Mixing Tunnel
The reconstruction algorithm is applied to velocity and density measurements taken at a distance \(z = 16D\) from the pipe outlet. The results here reported refer to a jet flow with a Reynolds number \(Re = \left( {\overline{w}}_0 \rho _0 D\right) / \mu _0 =\) 9146 and an Atwood number of \(At = \left( \rho _0 - \rho _{\infty } \right) / \left( \rho _0 + \rho _{\infty } \right) =\) 0.62, where the subscript “0” refers to the conditions at the jet exit and the subscript “\(\infty\)” refers to the coflow conditions. Table 2 reports the main parameters of the flow at the pipe outlet. At the measurement location, the local mean streamwise velocity \({\overline{w}}(x,y)\) varies in the field of view between 0.55 m/s, at the outer jet flow regions, to 3 m/s, at the jet core. The shear layer characterizing this experimental flow is stronger than the numerical shear flow considered for the numerical validation of the method (Sect. 5) and much stronger than the shear flow considered by other works that successfully applied the “Mean” method to SPIV data, such as the work of Ganapathisubramani et al. (2008). Since the contribution given by terms 2 and 3 of Eq. 3 are important in the investigated flow, the improvements in the reconstruction provided by the new “Inst” method with respect to the “Mean” method are expected to be much more evident.
The mean turbulent dissipation \({\overline{\epsilon }}\) is estimated by means of the velocity gradient tensor and the density obtained from the reconstructed 3D field, which provides an estimation for the Kolmogorov length and time scales of \(\eta \sim 100\) \(\mu\)m and \(\tau _\eta \sim 1.5\) ms. For the velocity measurements, the in-plane spatial resolution is \(7\eta \times 7\eta\). The sampling time step \(\varDelta t = 444\) \(\mu\)s is smaller than the Kolmogorov time scale but is larger than the smallest Eulerian time scale, which varies from 30 to 180 \(\mu\)s, from the jet centerline to the outer flow region. The spatial resolution in the z-direction of the volumetric reconstruction is then limited to a maximum of \(2.5\eta\) in the outer region and of \(13\eta\) at the jet core (Sect. 4.1). Because the molecular diffusion \({\hat{D}}\) of \(\hbox {SF}_6\) in air is higher than the diffusion of the flow momentum, with a Schmidt number of \(Sc = \mu _0 / \left( \rho _0 {\hat{D}}\right) =\) 0.16, the smallest spatial scales in the density fields are bigger than the Kolmogorov ones, and the spatial resolution of PLIF measurements is of the order of the Batchelor scale, which is estimated to be \(\eta _{\rho } = \eta / \sqrt{Sc}\) = 250 \(\mu\)m. The most important characteristics of the experimental flow at the measurement location are summarized in Table 3.
6.1 Vorticity and density reconstruction
In this section, the “Mean” method and the “Inst” method are applied to the SPIV/PLIF dataset, and the resulting reconstructed 3D fields are compared to show what are the improvements provided by the “Inst” algorithm. Because the sampling rate of the dataset is too low for \(t_{\mathrm{conv}}\) to satisfy the non-penetration condition 19, the addition of the curvature correction on the fluid particle trajectories leads to a numerical instability in the convection step of the algorithm that entirely prevents the application of the “Inst-curv” method. Nevertheless, the benefits introduced by the first order Taylor’s expansion on the material derivative have already been demonstrated in the application to DNS data with high spatial resolution, and the same contributions discussed in Sect. 5 are expected to be observed also for applications to experimental data collected at higher sampling frequency. As was the case for the application to DNS data, the reconstruction of the experimental fields evolves in time at each algorithm iteration with steps of \(2\varDelta t\), providing a maximum time-of-flight \(t_{\mathrm{conv}}\) for the data plane convection that is small enough to satisfy the non-penetration condition 17.

Isosurfaces of high positive values for the Q invariant of the velocity gradient tensor. The red and the gray surfaces correspond, respectively, to \(Q = 10^5\) s\(^{-2}\) and \(Q = 0.5 \times 10^5\) \(\hbox {s}^{-2}\). The 2D contour slices display the turbulent dissipation field. In (a), the volume reconstruction based on the local mean streamwise velocity (“Mean”); in (b), the volume reconstruction based on the local instantaneous velocity (“Inst”). The jet flow direction is oriented toward positive z

Isosurfaces of density. The red, green, blue, and light blue surfaces correspond, respectively, to \(\rho =\) 1.8, 1.5, 1.3, and 1 kg/\(\hbox {m}^3\). The 2D contour slices display the streamwise velocity component. In (a), the volume reconstruction based on the local mean streamwise velocity (“Mean”); in (b), the volume reconstruction based on the local instantaneous velocity (“Inst”). The jet flow direction is oriented toward positive z
In Fig. 12, high-vorticity regions are identified by means of isosurfaces of high values for the Q invariant of the velocity gradient tensor (Q-criterion). On the same figure, the contour slices show the organization of the turbulent dissipation structures with respect to the high-vorticity regions. The corresponding reconstructed 3D density fields are shown in Fig. 13, along with 2D contours of the streamwise component of the velocity in order to show how the high-density regions are located with respect to the high-speed regions of the jet. For generating volumes with a height of 4 cm, about 100 velocity and density images have been used in order to have enough flow data to fill the reconstruction domain in the low-speed outer flow regions.
As observed in previous numerical (Kerr 1985; Vincent and Meneguzzi 1994) and experimental studies (Ganapathisubramani et al. 2008; Fiscaletti et al. 2014; Carter and Coletti 2018), the topological organization of the velocity gradients is often composed of tube-like regions of high vorticity and of sheet-like regions of high dissipation surrounding clustered vortex tubes. Although all these features are seen in the volumes reconstructed by both the “Mean” method (Fig. 12a) and the “Inst” method (Fig. 12b), the two reconstructions provide qualitatively very different results, even in terms of density fields.
The “Mean” method generates a volume in which the vortical structures have an orientation that clearly follows the shape of the streamwise mean velocity profile, \({\overline{w}}(x,y)\), stretching the data in the direction of convection. Convecting the flow data even further from the measurement plane would indefinitely elongate these structures, leading to non-physical results. The stretching due to the mean velocity gradients is a mechanism that is expected from the Navier–Stokes equations (term 1 in Eq. 3) but it tends to distort the velocity fields in a preferential direction because (i) the spreading of the jet in the radial direction is not taken into account and because (ii) the effects of the incompressibility on the velocity field are completely neglected. This stretching mechanism is also applied in the backward direction of the convection, which leads to a non-physical orientation of the vorticity structures that is in the opposite direction of the main flow one. Although less evident, this distorting effect can also be noticed in the reconstructed density field (Fig. 13a), especially in the region \(z > 10\) mm. This preferential orientation of the coherent structures is not observed in the volumes given by the “Inst” method (Figs. 12b and 13b): the flow data is convected in the z-direction by the streamwise velocity profile, which introduces the same shear flow stretching mechanism given by the “Mean” method, and also in the x- and y-directions with a velocity that in average makes the jet radius spread. For the same reason, it is likely that the accuracy of the upstream region \(z<0\) is degraded by the missing flow data at the inflow boundaries, since the in-plane components on the convective velocity would make the jet radius to converge and lead to missing data at the edges of the domain. This suggests that, for the case of a spreading jet flow, a reconstruction based on a forward convection only would be better. The application of the Poisson equation in the framework of the “Inst” method also allows the iterative correction of the reconstructed velocity field and the convective velocity field as the flow evolves forward/backward in space. This partially relaxes the Taylor’s hypothesis of frozen turbulence and allows the method to include the non-linear effects enabled by the fluid incompressibility into the vortex-stretching mechanism. The distortion introduced by the “Mean” method can also been ascertained on the dissipation rate distribution (see for instance the contour plot at \(z =\) 20 mm), which loses its topological feature of sheets and assumes more a circular spatial distribution of the high-dissipation regions that follows the shape of the gradients on the mean streamwise velocity profile. The “Inst” method, instead, maintains a more regular sheet-like topology of high-dissipation, even in reconstructed regions that are the furthest from the measurement plane (\(z=0\)). In order to provide an even better insight on the non-physical distortions introduced by the “Mean” method and on the improvements given by the “Inst” method, time-series of vorticity and density fields have been produced with a time resolution of \(\varDelta t\) for both the “Mean” (Online Resource 1) and the “Inst” (Online Resource 2) methods and can be found as animations in the supplementary information.
6.2 Statistical analysis on transport equations
To assess the quality of the reconstructions from a quantitative point of view, we performed a statistical analysis on the reconstructed fields in terms of fulfillment of the transport equations. Using only the data given by the volumes of Fig. 12 and 13, the probability density functions related to the vorticity transport equation and the mass conservation law have been computed for each method and are shown in Figs. 14 and 15. By considering that the volumes of Figs. 12 and 13 correspond to a time \(t_V\), the time derivatives \(\partial \omega _{i}/\partial t\) and \(\partial \rho /\partial t\) have been computed by applying forward finite differences in time with a second reconstructed volume that corresponds to a time \(t_V + \varDelta t\), with \(\varDelta t\) the SPIV/PLIF sampling time step. To provide a more meaningful comparison between the “Mean” and the “Inst” methods, the probability density functions reported in Figs. 14 and 15 and related to the “Mean” method have been computed from 3D velocity fields regularized by the Poisson equation. The increase at zero and the decrease at the tails of the probability distributions of both Figs. 14 and 15 demonstrate that the “Inst” method provides reconstructed volumes that better satisfy the transport equations. This result corroborates the theoretical discussion presented in Sect. 2.2, for which we expected that the use of the instantaneous velocity and the application of the incompressibility constraint would have led to 3D fields more consistent with the Navier–Stokes equations. Including the Poisson regularization in the “Mean” method provides only marginal improvements on the probability density function for the vorticity transport equation. In line with the discussion presented in Sect. 5, the better fulfillment of the vorticity transport equation given by the “Inst” method results from the more appropriate way of convecting the velocity data in space, and enforcing the incompressibility constraint during the convection process of the “Mean” method provides a reconstructed vorticity field that is qualitatively the same of that of Fig. 12a. However, because the expression of the mass conservation equation directly involves the divergence of the velocity, the Poisson regularization improves the corresponding probability density function provided by the “Mean” method. While the “Inst” method enforces the mass conservation law in its complete form, that is with all the convective terms (Eq. 6), the “Mean” method convects the density data only through the local mean streamwise velocity profile, \({\overline{w}}(x,y)\), and thus directly enforces the equation \(\partial \rho / \partial t + {\overline{w}}(x,y)\partial \rho / \partial z = 0\), which is only an approximation of Eq. 6. This difference in the way of convecting the density data results in a better fulfillment of the mass conservation law for the “Inst” method (Fig. 15).

Probability density function of the vorticity transport equation computed from the volume data of Figs. 12 and 13. The marks on the curves refer to different components of the transport equation.The probability density functions for the “Mean” method includes the Poisson regularization of the reconstructed velocity fields

Probability density function of the mass conservation equation computed from the volume data of Fig. 12. The probability density function for the “Mean” method includes the Poisson regularization of the reconstructed velocity fields
The statistical analysis of Fig. 15 provides a good tool for checking the consistency between reconstructed velocity and density data, but it does not provide a direct quantification of the accuracy on the reconstructed density field. Although the mass conservation law is fairly satisfied for both types of reconstruction, the corresponding 3D density fields (Fig. 13a, b) are qualitatively very different. This is because, despite the differences in the definition of the convective velocity, both the “Mean” and the “Inst” methods generate 3D volumes of velocity and density that are automatically self-consistent in terms of mass conservation, regardless of the accuracy of the reconstructed fields. In Figs. 12a and 13a, we showed how the “Mean” method produces a 3D velocity field that is distorted by the mean shear layer profile, and that the reconstructed density field follows the same type of distortion. Although both velocity and density 3D fields are inaccurate, they together satisfy the mass conservation equation. The accuracy of the reconstructed density field is, therefore, directly dependent on the accuracy of the reconstructed velocity field. Since the “Inst” method provides more accurate velocity reconstructions than the “Mean” method, it also provides more accurate reconstructed density fields, although further work is required to assess its absolute level of accuracy. Further, it is well-known that the Lagrangian transport concept is more valid for passive scalars than for the small-scale velocity fluctuations (Yeung and Sawford 2002).
7 Conclusions
We have developed an improved algorithm for reconstructing 3D volumes of velocity and density in high shear flows from SPIV and PLIF data. In the application of the Taylor’s hypothesis of frozen turbulence, this algorithm uses the local instantaneous velocity field (“Inst”) rather than the local mean streamwise velocity field (“Mean”), providing the right speed and direction in convecting the flow data and leading to reconstructed 3D flows that better satisfy the vorticity transport equation (Fig. 14) and the mass conservation law (Fig. 15). The new reconstruction algorithm partially relaxes the Taylor’s hypothesis by solving at each iteration a Poisson equation for the velocity. This allows the algorithm to maintain a divergence-free velocity field during the convection process and to correct at each iteration the convective velocity field used for moving the data into the 3D space. The new “Inst” method is able to remove those reconstruction artifacts affecting the 3D fields provided by the “Mean” method, such as the non-physical orientation of the vortical coherent structures and the consequent non-physical stretching of the density field. This demonstrates that the new “Inst” method is more appropriate over the “Mean” method for applications in variable-density flows with shear layers.
As shown by the error analysis of Sect. 5.2, the accuracy of the reconstruction depends on the size of the volume and also on the type of flow under investigation. For the numerical channel flow investigated in Sect. 5, the viscous length scale, \(\delta _{\nu }\), and the Reynolds number, \(Re_{\tau } = H/\delta _{\nu }\), are, respectively, \(10^{-3}\) and 1000. Figure 10 suggests that the “Inst” method can provide 3D velocity fields in shear flows with a thickness of 400\(\delta _v\) and maximum errors of about 10\(\%\), which is competitive when compared to the volume thickness of tomographic PIV measurements in turbulent boundary layers with similar Reynolds numbers (see for instance the work of Schröder et al. (2011), who performed tomographic PIV in a turbulent boundary layer with \(Re_{\tau }=800\) on volumes with a thickness of 328\(\delta _{\nu }\)). The comparison between the reconstruction errors for the uniform flow case (Fig. 9) with those for the shear flow case (Fig. 10) reveals a dependency of the reconstruction accuracy on the flow characteristics. Depending on the strength of the shear layer and on the turbulence intensity, the reconstruction accuracy can be lower or higher than that reported in the error analysis of Sect. 5.2.
While tomographic PIV and LIF can be applied to any type of flows, the “Inst” method can provide accurate 3D fields when applied to convective flows, such as jet flows or channel flows, in which case the flow crosses the SPIV/PLIF measurement plane in one direction only. If the out-of-plane velocity component, w, changes sign over the SPIV/PLIF field of view, the convective field would move the flow data both backward and forward in space at the same time, which might result in a 3D distribution of the flow data that does not cover the entire reconstruction domain, with some region of space left empty. In this case, the 3D interpolation of the scattered data on a rectangular volume might become inaccurate or not possible, which would prevent the successive Poisson regularization, an essential step for the success of the reconstruction method.
In Sect. 6, we showed how the new “Inst” method provides better velocity and density reconstructions than the “Mean” method. There are some important features that this new algorithm is still missing and that may introduce inaccuracies in the reconstruction when the method is applied to variable-density flows. In the current version of the reconstruction algorithm, the density is simply transported in space by the flow and is treated as a passive scalar. However, in variable-density flows, density gradients play an active role in the temporal and spatial evolution of the velocity field. The baroclinic torque, which is one of the main key characteristics of variable-density flows, rises from the interaction between density gradients and pressure gradients. The pressure-gradient effects are partially emulated by means of the Poisson solver but are neglected during the convection step, which currently prevents including the dynamical effects of the density gradients into the process of velocity reconstruction, with a possible loss of accuracy. Future developments of this work are aiming to improve the “Inst” method from this perspective.
The reconstruction algorithm developed in this work can provide time-series of reconstructed 3D fields with spatial resolution, temporal resolution and size comparable to those of current direct volumetric measurement techniques. The spatial resolution of planar PIV and LIF measurements is not lower than the spatial resolution that can be obtained with the corresponding tomographic diagnostics, while the out-of-plane spatial resolution is directly dependent on the SPIV/PLIF acquisition rate and its relation with respect to the Eulerian time scales characterizing the flow. In high Reynolds number flows, the image sampling rates that are required to be spatially resolved in the direction of convection can be relatively high (Eq. 16), but delivering enough laser energy at high repetition rates is less problematic for planar measurements than for tomographic PIV or LIF. Especially for the case of LIF measurements, the spatial resolution that can be obtained from the 3D reconstruction of PLIF images is likely to be higher than that of tomographic LIF, unless a very high number of cameras is employed. Moreover, a time-series of reconstructed volumes can be generated with a time step of \(\varDelta t\) (see, for instance, Online Resources 1 and 2 included as supplementary information), i.e., with the same temporal resolution of SPIV/PLIF measurements, which can be easily higher than that of time-resolved tomographic PIV.
These considerations make this reconstruction algorithm a valuable and low-cost approach for the diagnostic of 3D turbulent structures, especially in variable-density flows, for which simultaneous velocity and density volumetric measurements are still very challenging to accomplish.
References
Ambrose D, Sprake CHS, Townsend R (1974) Thermodynamic properties of organic oxygen compounds XXXIII. The vapour pressure of acetone. J Chem Thermodyn 6(7):693–700
Amendt P, Landen OL, Robey HF, Li CK, Petrasso RD (2010) Plasma barodiffusion in inertial-confinement-fusion implosions: application to observed yield anomalies in thermonuclear fuel mixtures. Phys Rev Lett 105(11):115005
Antonia RA, Phan-Thien N, Chambers AJ (1980) Taylor’s hypothesis and the probability density functions of temporal velocity and temperature derivatives in a turbulent flow. J Fluid Mech 100(1):193–208
Banerjee A, Gore RA, Andrews MJ (2010) Development and validation of a turbulent-mix model for variable-density and compressible flows. Phys Rev E 82(4):046309
Browne LWB, Antonia RA, Rajagopalan S (1983) The spatial derivative of temperature in a turbulent flow and Taylor’s hypothesis. Phys Fluids 26(5):1222–1227
Cai W, Li X, Li F, Ma L (2013) Numerical and experimental validation of a three-dimensional combustion diagnostic based on tomographic chemiluminescence. Opt Express 21(6):7050–7064
Carter DW, Coletti F (2018) Small-scale structure and energy transfer in homogeneous turbulence. J Fluid Mech 854:505–543
Cenedese A, Romano GP, Di Felice F (1991) Experimental testing of Taylor’s hypothesis by LDA in highly turbulent flow. Exp Fluids 11(6):351–358
Charonko JJ, Prestridge K (2017) Variable-density mixing in turbulent jets with coflow. J Fluid Mech 825:887–921
Chassaing P (2001) The modeling of variable density turbulent flows. A review of first-order closure schemes. Flow Turbul Combust 66(4):293–332
Corrsin S (1963) Estimates of the relations between Eulerian and Lagrangian scales in large Reynolds number turbulence. J Atmos Sci 20(2):115–119
de Kat R, Ganapathisubramani B (2012) Pressure from particle image velocimetry for convective flows: a Taylor’s hypothesis approach. Meas Sci Technol 24(2):024002
de Kat R, Ganapathisubramani B (2015) Frequency-wavenumber mapping in turbulent shear flows. J Fluid Mech 783:166–190
Dahm WJ, Southerland KB (1997) Experimental assessment of Taylor’s hypothesis and its applicability to dissipation estimates in turbulent flows. Phys Fluids 9(7):2101–2107
Dennis DJ, Nickels TB (2008) On the limitations of Taylor’s hypothesis in constructing long structures in a turbulent boundary layer. J Fluid Mech 614:197–206
Elsinga GE, Scarano F, Wieneke B, van Oudheusden BW (2006) Tomographic particle image velocimetry. Exp Fluids 41(6):933–947
Fiscaletti D, Westerweel J, Elsinga GE (2014) Long-range \(\mu\)PIV to resolve the small scales in a jet at high Reynolds number. Exp Fluids 55(9):1–15
Fiscaletti D, Ganapathisubramani B, Elsinga GE (2015) Amplitude and frequency modulation of the small scales in a jet. J Fluid Mech 772:756–783
Fisher MJ, Davies POAL (1964) Correlation measurements in a non-frozen pattern of turbulence. J Fluid Mech 18(1):97–116
Floater MS, Iske A (1996) Multistep scattered data interpolation using compactly supported radial basis functions. J Comput Appl Math 73(1–2):65–78
Gampert M, Schaefer P, Peters N (2013) Experimental investigation of dissipation-element statistics in scalar fields of a jet flow. J Fluid Mech 724:337–366
Ganapathisubramani B, Lakshminarasimhan K, Clemens NT (2008) Investigation of three-dimensional structure of fine scales in a turbulent jet by using cinematographic stereoscopic particle image velocimetry. J Fluid Mech 598:141–175
George WK, Woodward SH, Hussein HH (1989) An evaluation of the effect of a fluctuating convection velocity on the validity of Taylor’s hypothesis. In: Proceedings of 10th Australian fluid mechanics conference, University of Melbourne, Australia, 11–15 December 1989
Ghaemi S, Ragni D, Scarano F (2012) PIV-based pressure fluctuations in the turbulent boundary layer. Exp Fluids 53(6):1823–1840
Halls BR, Jiang N, Meyer TR, Roy S, Slipchenko MN, Gord JR (2017) 4D spatiotemporal evolution of combustion intermediates in turbulent flames using burst-mode volumetric laser-induced fluorescence. Opt Lett 42(14):2830–2833
Hardy RL (1971) Multiquadric equations of topography and other irregular surfaces. J Geophys Res 76(8):1905–1915
Hinze JO (1975) Turbulence. Mc Graw Hill, New York
Jones S, Andrassy R, Sandalski S, Davis A, Woodward P, Herwig F (2016) Idealized hydrodynamic simulations of turbulent oxygen-burning shell convection in 4π geometry. Mon Not R Astron Soc stw2783
Kerr RM (1985) Higher-order derivative correlations and the alignment of small-scale structures in isotropic numerical turbulence. J Fluid Mech 153:31–58
Krogstad PA, Kaspersen JH, Rimestad S (1998) Convection velocities in a turbulent boundary layer. Phys Fluids 10(4):949–957
Lai CKC, Charonko JJ, Prestridge K (2018) A Kármán-Howart–Monin equation for variable-density turbulence. J Fluid Mech 834:382–418
Lee JHW, Chu V (2003) Turbulent jets and plumes—a Lagrangian approach. Kluwer Academic Publisher, Dordrecht
LeVeque RJ (2002) Finite volume methods for hyperbolic problems. Cambridge Univ Press, Cambridge
Lin CC (1953) On Taylor’s hypothesis and the acceleration terms in the Navier–Stokes equation. Q Appl Math 10(4):295–306
Lumley JL (1965) Interpretation of time spectra measured in high-intensity shear flows. Phys Fluids 8(6):1056–1062
Ma L, Lei Q, Capil T, Hammack SD, Carter CD (2017) Direct comparison of two-dimensional and three-dimensional laser-induced fluorescence measurements on highly turbulent flames. Opt Lett 42(2):267–270
Pedrizzetti G, Novikov EA (1994) On Markov modelling of turbulence. J Fluid Mech 280:69–93
Romano GP (1995) Analysis of two-point velocity measurements in near-wall flows. Exp Fluids 20(2):68–83
Rossinelli D, Koumoutsakos P (2008) Vortex methods for incompressible flow simulations on the GPU. Vis Comput 24(7–9):699–708
Scarano F (2012) Tomographic PIV: principles and practice. Meas Sci Technol 24(1):012001
Scarano F, Moore P (2012) An advection-based model to increase the temporal resolution of PIV time series. Exp Fluids 52(4):919–933
Schanz D, Schröder A, Gesemann S, Michaelis D, Wieneke B (2013) Shake the box: a highly efficient and accurate tomographic particle tracking velocimetry (TOMO-PTV) method using prediction of particle positions. In: 10th international symposium on particle image velocimetry–PIV13. Delft, The Netherlands, 1–3 July 2013
Schneiders JFG, Scarano F (2016) Dense velocity reconstruction from tomographic PTV with material derivatives. Exp Fluids 57:139
Schneiders JFG, Dwight RP, Scarano F (2014) Time-supersampling of 3D-PIV measurements with vortex-in-cell simulation. Exp Fluids 55:1692
Schneiders JFG, Pröbsting S, Dwight RP, van Oudheusden BW, Scarano F (2016) Pressure estimation from single-snapshot tomographic PIV in a turbulent boundary layer. Exp Fluids 57:53
Schröder A, Geisler R, Staack K, Elsinga GE, Scarano F, Wieneke B, Henning A, Poelma C, Westerweel J (2011) Eulerian and Lagrangian views of a turbulent boundary layer flow using time-resolved tomographic PIV. Exp Fluids 50:1071–1091
Smolik M, Skala V (2018) Large scattered data interpolation with radial basis functions and space subdivision. Integr Comput Aid E 25(1):49–62
Sreenivasan KR, Antonia RA, Danh HQ (1977) Temperature dissipation fluctuations in a turbulent boundary layer. Phys Fluids 20(8):1238–1249
Taylor GI (1938) The spectrum of turbulence. Proc R Soc 164(919):476–490
Van Doorne CWH, Westerweel J (2007) Measurement of laminar, transitional and turbulent pipe flow using stereoscopic-PIV. Exp Fluids 42(2):259–279
Vétel J, Garon A, Pelletier D (2010) Vortex identification methods based on temporal signal-processing of time-resolved PIV data. Exp Fluids 48(3):441–459
Vincent A, Meneguzzi M (1994) The dynamics of vorticity tubes in homogeneous turbulence. J Fluid Mech 258:245–254
Wills JAB (1964) On convection velocities in turbulent shear flows. J Fluid Mech 20(3):417–432
Wu Y, Xu W, Lei Q, Ma L (2015) Single-shot volumetric laser induced fluorescence (VLIF) measurements in turbulent flows seeded with iodine. Opt Express 23(26):33408–33418
Yeung PK, Sawford BL (2002) Random-sweeping hypothesis for passive scalars in isotropic turbulence. J Fluid Mech 459:129–138
Zaman KBMQ, Hussain AKMF (1981) Taylor hypothesis and large-scale coherent structures. J Fluid Mech 112:379–396
Author information
Authors and Affiliations
Corresponding author
Additional information
Publisher's Note
Springer Nature remains neutral with regard to jurisdictional claims in published maps and institutional affiliations.
Supplementary Information
Below is the link to the electronic supplementary information.
Supplementary Information 1 (mp4 35685 KB)
Supplementary Information 2 (mp4 41427 KB)
Appendix: Numerical stability conditions on \(t_{\mathrm{conv}}\)
Appendix: Numerical stability conditions on \(t_{\mathrm{conv}}\)
The condition that \(t_{\mathrm{conv}}\) needs to satisfy to guarantee the numerical stability of the volumetric reconstruction assumes different forms depending on the type of fluid particle trajectory considered. By defining \({\varvec{X}}({\varvec{X}}_0,t)\) as the trajectory traced by a fluid particle with initial position \({\varvec{X}}_0\), the condition of non-penetration of the fluid material is mathematically formulated in terms of the Jacobian as
where the operator \(\mathrm {det}(\cdot )\) provides the determinant of a matrix. The derivation of Eq. 7 with respect to the initial position \({\varvec{X}}_0\) (\({\varvec{X}}_m\) in Eq. 7) provides the Jacobian matrix for the case of linear fluid particle trajectories:
where \({\varvec{I}}\) is the identity matrix, and \({\varvec{u}}_0\) is the velocity evaluated at the initial fluid particle position, \({\varvec{X}}_0\). The stability condition 17 reported in Sect. 4.2 guarantees that the Jacobian matrix of Eq. 23 always satisfies the non-penetration condition, Eq. 22. When the acceleration correction is applied to the fluid particle trajectories (Eq. 13), the Jacobian matrix becomes
for which the condition of non-penetration is fulfilled if \(t_{\mathrm{conv}}\) satisfies the inequality of Eq. 19 reported in Sect. 4.2.
Rights and permissions
Open Access This article is licensed under a Creative Commons Attribution 4.0 International License, which permits use, sharing, adaptation, distribution and reproduction in any medium or format, as long as you give appropriate credit to the original author(s) and the source, provide a link to the Creative Commons licence, and indicate if changes were made. The images or other third party material in this article are included in the article's Creative Commons licence, unless indicated otherwise in a credit line to the material. If material is not included in the article's Creative Commons licence and your intended use is not permitted by statutory regulation or exceeds the permitted use, you will need to obtain permission directly from the copyright holder. To view a copy of this licence, visit http://creativecommons.org/licenses/by/4.0/.
About this article

Cite this article
Fratantonio, D., Lai, C.C.K., Charonko, J. et al. Beyond Taylor’s hypothesis: a novel volumetric reconstruction of velocity and density fields for variable‑density and shear flows. Exp Fluids 62, 84 (2021). https://doi.org/10.1007/s00348-021-03156-0
Received:
Revised:
Accepted:
Published:
DOI: https://doi.org/10.1007/s00348-021-03156-0