
Abstract
Morphological and morphometric variants of the anterior communicating artery (AComA) have been described by multiple studies; however, a complete classification system of all possible morphological variants with their prevalence is lacking. The current systematic review with meta-analysis combines data from different databases, concerning the AComA morphological and morphometric variants (length and diameter). Emphasis was given to the related clinical implications to highlight the clinical value of their knowledge. The typical AComA morphology occurs with a pooled prevalence (PP) of 67.3%, while the PP of atypical AComA is 32.7%. The identified AComA morphological variants (artery’s hypoplasia, absence, duplication, triplication, differed shape, fenestration, and the persistence of a median artery of the corpus callosum- MACC) were classified in order of frequency. The commonest presented variants were the AComA hypoplasia (8%) and the anterior cerebral artery (ACA) fusion (5.9%), and the rarest ones were the MACC persistence (2.3%), and the AComA triplication (0.7%). The knowledge of those variants is essential, especially for neurosurgeons operating in the area. Given the high prevalence of AComA aneurysms, an adequate and complete classification of those variants is of utmost importance.
Find the latest articles, discoveries, and news in related topics.Avoid common mistakes on your manuscript.
Introduction
The cerebral arterial circle (CAC), so-called Circle of Willis, is a complex arterial network, located at the base of the brain, providing important collateral circulation to cerebral and cerebellar tissue (Fig. 1). The anterior cerebral artery (ACA) courses anteromedially above the optic chiasm and before its entrance into the interhemispheric fissure [59], joins the contralateral ACA by the anterior communicating artery (AComA). CAC variants are common (a pooled prevalence- PP of 68.22%) [24], and usually involve the anterior circulation, which is also the most frequent location of intracranial aneurysms [14]. Padget [41], first observed that the CAC variants were significantly more frequent in patients with aneurysms compared to those without. The AComA complex has a strong clinical relevance due to the common formation of intracranial aneurysms [34]. Many cadaveric and clinical studies investigated and classified the AComA variants among different populations, following different methodologies. Most of the described variants can be attributed to embryological alterations [36, 47]. The current systematic review with meta-analysis points out the AComA typical and variant morphology, highlighting common and uncommon variants, and summarizing available morphometric details of the AComA. Differences between study methods and geographic regions are further discussed.

Schematic representation of the cerebral arterial circle. AComA- anterior communicating artery, ACA- anterior cerebral artery, MCA- middle cerebral artery, PCA- posterior cerebral artery, OA- ophthalmic artery, AChoA- anterior choroidal artery, PComA- posterior communicating artery, SCA- superior cerebellar artery, PAs- pontine arteries, AICA- anterior inferior cerebellar artery, BA- basilar artery, PICA- posterior inferior cerebellar artery, VA- vertebral artery, and ASA- anterior spinal artery
Materials and methods
The study was performed according to the PRISMA (Preferred Reporting Items for Systematic Reviews and Meta-Analyses) guidelines for reporting systematic reviews with meta-analyses [42].
Search strategy
Articles were found by conducting systematic searches in the PubMed and Web of Science databases, by using the keywords “anterior communicating artery” AND “anatomical variant” AND “morphology” and “anterior communicating artery” AND “anatomy” AND “morphometry”. The reference lists of all relevant articles were thoroughly reviewed for additional relevant references to be included in the analysis. Extensive searches on Google Scholar were also conducted. Every potentially relevant article was obtained in its entirety, reviewed by two reviewers (GTr, RCT), and included if it met the inclusion criteria and did not meet any of the exclusion criteria. Articles were chosen and imported into a Paperpile database. Methods were adopted after previously published meta-analyses [20, 55].
Selection criteria
The following exclusion criteria were used: (1) articles that did not mention any relevant measurements regarding the AComA, or presented confusing values that could not be categorized in one specific variant, (2) low-quality publications with insufficient methods for assessing and irrelevant results, or articles published in journals with a low impact factor, (3) less than 20 subjects, (4) results duplicating previously-published articles, (5) case reports, reviews, meta-analyses, or any other prevalence studies relying on published values.
Data collection and analysis
Two reviewers (GTr, RCT) collected data from each research and stored it in separate Excel 365 databases. If a significant discrepancy arose, a third reviewer (CT) would be brought in to verify the inconsistency and determine the proper outcome. The following data was extracted: the authors’ names, the year, the technique (computed tomography-CT scan, autopsy reports, surgical reports, etc.), the total number of cases, and their evaluations.
Quality assessment and risk of bias
For case-control studies, the Newcastle-Ottawa Scale (NOS) was used with the following modifications for a prevalence analysis: item 3 from Selection and Exposure was omitted. To measure each study’s quality, a mark ranging from 0 to 7 was assigned to it. The present paper includes articles having at least four points.
Statistical analysis
Statistical analysis was conducted with the open-source R programming language (R Core Team, 2021) and the RStudio software (RStudio Team (2022)) using the “meta” and “metafor” packages [61, 63]. The PP for both typical and atypical anatomy variants and the pooled mean length and diameter were calculated, based on the inverse variance method and the random effects model. The proportions’ meta-analysis (prevalence meta‑analysis) was conducted using the Freeman-Tukey double arcsine transformation, the DerSimonian-Laird estimator for the between-study variance tau^2, and the Jackson method for confidence interval of tau^2 and tau. The meta-analysis of means (mean length and diameter) was conducted using the untransformed (raw) means, the restricted maximum-likelihood estimator for tau^2, and the Q-Profile method for confidence interval of tau^2 and tau [64]. The Cochran’s Q statistic was used to evaluate the heterogeneity presence across studies and the Higgins I^2 statistic was used for quantifying heterogeneity [8]. An I^2 value of 25-50%, 50-75%, and > 75% indicate low, moderate, and high heterogeneity [64, 65].
To evaluate the presence of the small-study effect (the phenomenon that smaller studies may show different effects than large ones) [60], the funnel plot asymmetry of the effect size (prevalence, length, and diameter) against the sample size was estimated by conducting regression test for funnel plot asymmetry (mixed-effects meta-regression model). Subgroup analyses were performed to estimate the impact of the study’s design (cadaveric, imaging) and subjects’ geographical region (continent of origin) on the pooled estimation. To detect outliers and influential studies the Baujat plot, the leave-one-out forest plot, and influence diagnostics were used [61, 64]. A p-value < 0.05 was considered statistically significant.
Results
Search synthesis
During the preliminary investigation using databases and other approaches, 48 citations were acquired from PubMed, and 6 citations from the Google Scholar database. Following the exclusion of all publications that satisfied at least one exclusion condition, 32 papers were further examined and finally included in the meta-analysis. Table 1 lists each included paper. Figure 2 shows the systematized search synthesis.

The PRISMA flow chart
Quality assessment and risk of bias
Each item received a score ranging from 0 to 7. Table 1 summarizes the results of each investigation. There was no evidence of substantial bias in any of the publications listed.
Morphological parameters for AComA
AComA typical morphology
Based on the k = 18 included studies (overall cases = 4978; typical = 3494), the PP of the AComA typical morphology was estimated as 0.6732 [0.5716; 0.7674]. Approximately 67% of the population is expected to have the AComA typical morphology (Fig. 3). The estimated heterogeneity was statistically significant (P < 0.0001) based on the Q test statistic, and high degree based on the I^2 statistic (I^2 = 98.1%). The results of the subgroup analyses on the effect of the study’s type and the subjects’ geographical region on the estimated prevalence of the typical morphology are summarized in Table 2. The test for subgroup differences with the study’s design (cadaveric, imaging) as a categorical predictor was not statistically significant (P = 0.6107 > 0.05), and thus the study’s design is not a statistically significant moderator of the estimated prevalence of the typical morphology. To evaluate the geographical region as a possible moderator of the estimated prevalence of the typical morphology, the studies were categorized based on the subjects’ continent of origin. The test for subgroup differences was statistically significant (P = 0.0004). Only one study [23] has been included in the American subgroup, and further studies are required to reach the minimum of four studies per subgroup as suggested by Fu et al. [62] for a (categorical) subgroup variable. The estimated heterogeneity is a high degree in both Asia (I^2 = 95.2%) and Europe (I^2 = 98.8%) subgroups. Therefore, further research is required to confirm this correlation. Subsequently, the presence of the small-study effect was evaluated. The funnel plot of the prevalence against the sample size is depicted in Fig. 3. Based on the regression test, asymmetry in the funnel plot was not statistically significant (P = 0.1774 > 0.05) indicating no small-study effect. In addition, based on the Baujat plot and the leave-one-out forest plot (Fig. 4), no influential outlier studies (with a large impact on both the estimated PP and heterogeneity) were detected. In addition, based on the influence diagnostics results (Fig. 4), no study was identified as influential (red-colored in the diagnostics plots).

Typical morphology of the anterior communicating arteries: Forest plot evaluating the prevalence, sorted by sample size; Funnel plot for the assessment of small-study effect

Typical morphology of the anterior communicating arteries: A leave-one-out forest plot, sorted by prevalence; Baujat plot; Influential study diagnostics
AComA atypical morphology
Based on the k = 18 included studies (overall cases = 4978; atypical = 1484), the PP of the AComA atypical morphology was estimated as 0.3268 [0.2326; 0.4284]. Approximately 33% of the population is expected to have an atypical morphology (Fig. 5). The estimated heterogeneity was statistically significant (P < 0.0001), and high degree (I^2 = 98.1%). The subgroup analysis results on the effect of the study’s type and the subjects’ geographical region on the estimated prevalence of the atypical morphology are in line with the results for the typical morphology and summarized in Table 2. Based on the test for subgroup differences the study’s design is not a statistically significant moderator of the estimated prevalence of the atypical morphology. In addition, as reported for the typical morphology, further studies are required to confirm a possible correlation between the estimated prevalence of the atypical morphology and the geographical region. Based on the regression test for funnel plot asymmetry (Fig. 5), no small-study effect was detected. In addition, based on the Baujat plot and the leave-one-out forest plot (Fig. 6), no influential outlier studies were detected. The influence diagnostics yielded no study as influential (Fig. 6). The PP of each morphological variant was calculated:

Atypical morphology of the anterior communicating arteries: Forest plot evaluating the prevalence, sorted by sample size; Funnel plot for the assessment of small-study effect

Atypical morphology of the anterior communicating arteries: A leave-one-out forest plot, sorted by prevalence; Baujat plot; Influential study diagnostics
-
The hypoplastic AComA was studied in 12 articles (a total of 2430 arteries). The PP was 8% [3.1; 14.7] (Fig. 7), with significant heterogeneity (I2 = 95%, P < 0.01).
Fig. 7 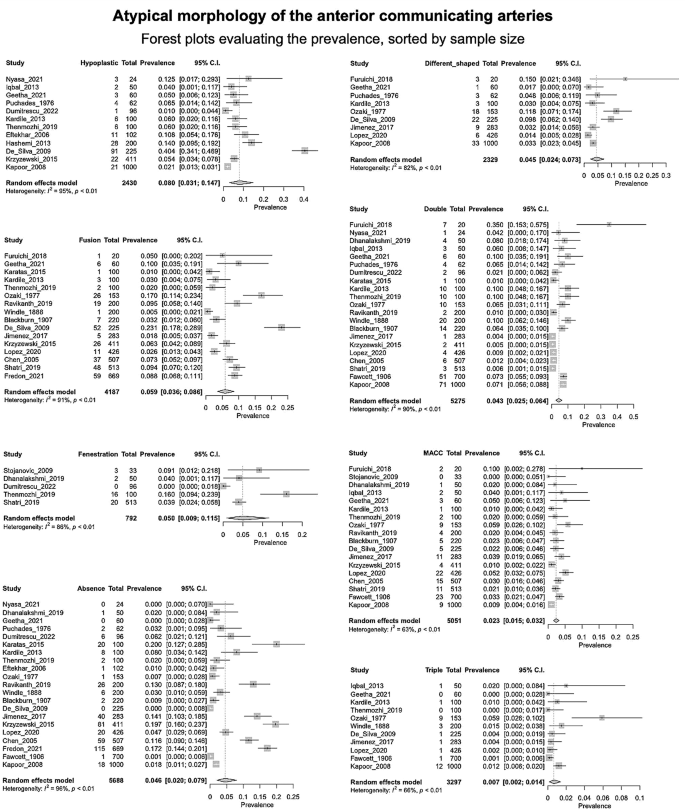
Prevalence of the anterior communicating arteries’ variants: Forest plots
-
The fused AComA was encountered in 16 papers, analyzing 4187 vessels. The PP was 5.9% [3.6; 8.6] (Fig. 7), with a significant heterogeneity (I2 = 91%, P < 0.01).
-
The AComA fenestration was identified in 5 papers including 792 vessels. The PP was 5% [0.9; 11.5], (Fig. 7) with a significant heterogeneity (I2 = 86%, P < 0.01).
-
The absent AComA was extracted by 21 papers, adding up to 5688 arteries. The PP was 4.6% [2.0; 7.9] (Fig. 7), with a significant heterogeneity (I2 = 96%, (P < 0.001).
-
The AComA of different shapes Nine articles, including 2329 vessels were included. The PP was 4.5% [2.4; 7.3] (Fig. 7). The heterogeneity was most likely significant (I2 = 82%, P < 0.01).
-
The AComA duplication was identified in 21 papers, summing 5275 vessels. The PP was 4.3% [2.5; 6.4] (Fig. 7) with a significant heterogeneity (I2 = 90%, P < 0.01).
-
The persistence of a median artery of the corpus callosum (MACC) was identified in 18 papers, summing 5051 arteries. The PP of the MACC persistence was 2.3% [1.5; 3.2] (Fig. 7), with a moderate heterogeneity (I2 = 63%, P < 0.01).
-
The AComA triplication was found in 11 studies, which analyzed 3297 arteries. The PP was 0.7% [0.2–1.4] (Fig. 7), with moderate heterogeneity (I2 = 66%, P < 0.01).

The results of the subgroup analyses on the effect of the study’s design and the subjects’ geographical region on the estimated prevalence of each atypical morphology are summarized in Table 2. The study’s design was estimated as a statistically significant moderator of the estimated prevalence for the subgroups of the AComA absence (Cadaveric: Pr ≈ 0.0203; Imaging: Pr ≈ 0.1296; P < 0.0001) and double AComAs (Cadaveric: Pr ≈ 0.0655; Imaging: Pr ≈ 0.0085; P < 0.0001). The results indicate that the study’s design influences the estimated prevalence of both morphological variants (absent and double AComAs). Absent AComA was found to have a statistically significant higher prevalence in imaging (Pr ≈ 0.1296) than in cadaveric (Pr ≈ 0.0203) studies. The double AComA was found to have a statistically significant higher prevalence in cadaveric (Pr ≈ 0.0655) than in imaging (Pr ≈ 0.0085) studies. The subjects’ geographical region (continent of origin) was estimated as a statistically significant moderator of the estimated prevalence for the absent (P = 0.0006), the fused (P = 0.0033), the double (P = 0.0004) and the triple (P = 0.0468) AComA. However, subgroups with less than four studies have been included in the subgroup analyses (Table 2), and further studies are required to reach the minimum of four studies per subgroup as suggested by Fu et al. [62] for a (categorical) subgroup variable. Therefore, further research is required to confirm these correlations.
Morphometrical parameters for AComA
AComA mean length
Based on k = 8 studies (overall cases = 1005) the pooled mean length of the AComA was estimated as 2.8440 [2.4670; 3.2209] mm with statistically significant (P < 0.0001) and high degree (I^2 = 95.9%) heterogeneity. The forest plot evaluating the AComA pooled mean length is shown in Fig. 8. The results of the subgroup analyses on the effect of the study’s design and the subjects’ geographical region on the AComA estimated mean length are summarized in Table 3. Based on the test for subgroup differences (P = 0.0968 > 0.05), the study’s design (cadaveric, imaging) is not a significant moderator of the AComA estimated mean length. The subjects’ geographical region (continent of origin) was estimated as a statistically significant moderator of the estimated mean length (P = 0.0008). However, further studies are required to confirm this correlation to reach a minimum of four studies per subgroup [62]. The regression test for funnel plot asymmetry yielded no small-study effect (Fig. 8). Based on the Baujat plot and the leave-one-out forest plot (Fig. 9), the study conducted by Zurada et al. [58] stands out as an influential outlier by exerting substantial impact on both the estimated pooled length and heterogeneity. In addition, this study [58] was identified as influential (red-colored in the diagnostics plots) by the influence diagnostics (Fig. 9). After the exclusion of the aforementioned study, the pooled mean length was estimated as 2.6932 [2.4750; 2.9115] mm with significant (P < 0.0001) and high degree (I^2 = 93.6%) heterogeneity.

The mean length of the anterior communicating arteries: Forest plot evaluating the length, sorted by sample size; Funnel plot for the assessment of the small study effect

The mean length of the anterior communicating arteries: A leave-one-out forest plot, sorted by mean length; Baujat plot; Influential study diagnostics
AComA mean diameter
Based on k = 8 studies (overall cases = 1003) the AComA pooled mean diameter was estimated as 1.4711 [1.2376; 1.7047] mm with significant (P < 0.0001) and high degree (I^2 = 98.5%) heterogeneity. The forest plot evaluating the AComA pooled mean diameter is shown in Fig. 10. The results of the subgroup analyses on the effect of the study’s design and the subjects’ geographical region on the estimated AComA mean diameter are summarized in Table 3. The test for subgroup differences yielded no significant moderator of the estimated mean diameter. The regression test for funnel plot asymmetry yielded no small-study effect (Fig. 10). Based on the Baujat plot and the leave-one-out forest plot no influential outlier studies were detected (Fig. 11). In addition, the influence diagnostics yielded no study as influential (Fig. 11).

The mean diameter of the anterior communicating arteries: Forest plot evaluating the diameter, sorted by sample size; Funnel plot for the assessment of the small study effect

The mean diameter of the anterior communicating arteries: A leave-one-out forest plot, sorted by mean diameter; Baujat plot; Influential study diagnostics
Discussion
AComA morphological variants
Despite the AComA’s great morphological variability and its clinical impact, no study summarizes results for every possible variant. The typical AComA had a 67.3% PP (Type 1), and therefore the atypical patterns occurred with 37.2% (Types 2–8). The atypical patterns will be presented with decreasing frequency. Specifically, the commonest variant was estimated as the AComA hypoplasia with an 8% PP (Type 2). Type 3 was considered the artery’s absence, where it is possible to identify two different morphological types. AComA absence with the two ACAs fused (azygos ACA) had a 5.9% PP (Type 3). Whereas AComA absence with the two ACAs coursed in parallel was estimated with a 4.6% PP (Type 5). An artery is considered fenestrated when its arterial lumen splits into two distinct channels that eventually fuse along its course [36]. Sometimes it is mistaken for duplication, which is defined as the occurrence of two distinct arteries with separate origins [36]. The AComA fenestration was estimated with a 5% PP (Type 4). The AComA could be presented in different shapes (V-shaped, Y-shaped, and plexiform). All possible shapes were considered as AComA was differently shaped with a 4.5% PP (Type 6). In addition, other rarer variants could be present. AComA duplication is estimated at a 4.3% PP (Type 7). A branch emanating directly from the AComA can be identified, which represents an embryological remnant. The MACC persistence had a 2.3% PP (Type 8). The AComA can be identified triplicated in 0.7% (Type 9). Hence, the current meta-analysis proposes a simplified classification system of the AComA morphological variability, by using the PP of its variant in decreasing order (Fig. 12). Nevertheless, it is important to mention some significant results from the meta-analysis subgroup analysis. The typical pattern had a statistically significant difference in a geographic region (America: 82%; Europe: 67%; Asia: 58%), however, only one study was included in the American region (minimum four studies per subgroup [62]). The AComA absence had an interesting statistically significant difference between the studies’ methods. The cadaveric studies’ PP was estimated at 2%, while the imaging studies had a PP of 13% (p < 0.0001). This relationship could be attributed to the difficulty in differentiating small arteries (small diameter and length) in imaging studies. Hence, a small AComA could be misdiagnosed as AComA absence. In cases where there is a hemodynamic imbalance between the ACAs on both sides and no flow through the AComA, it will not be visible on neuroimaging. Another significant methodological difference between the studies was identified in AComA duplication. The cadaveric studies had a 6.5% PP, while the imaging studies PP was 0.9% (P < 0.0001). This relationship could be attributed to the difficulty of diagnosing a second AComA that may be quite small in diameter, during an imaging study. Nevertheless, AComA absence, fusion, duplication, and triplication were identified with a statistically significant difference between geographic regions, whereas only one study was included in the American region (minimum of four studies per subgroup [62]).

Schematic representation of the proposed classification of the anterior communicating artery (AComA) variants based on their frequency, in decreasing order. Type 1 (typical); Type 2 (hypoplastic); Type 3 (absence with ACAs fused); Type 4 (fenestration); Type 5 (absence with ACAs in parallel); Type 6 (different shaped); Type 6 A (Y-shaped); Type 6B (V-shaped); Type 6 C (plexiform); Type 7 (duplication); Type 8 (median artery of corpus collosum-MACC); Type 9 (triplication)
The AComA morphometric variants
Two morphometric parameters of the AComA vessels, the length, and diameter, independently affect the CAC functionality. Although the AComA morphometry is an important parameter similar to its morphology, only a few studies have investigated the AComA length and diameter. Among these studies, two unsolved questions arose:
-
1.
What is the AComA diameter threshold to be considered hypoplastic? and.
-
2.
What is the best method to evaluate the AComA morphometric parameters?
Generally, the blood flow volume is directly proportional to the arterial diameter and inversely proportional to the arterial length. According to Poiseulle/Hagen law: where R is resistance, L is the vessel’s length, η is the viscosity of the fluid (blood) and r is the radius of the vessel. Thus, shorter, and wider segmental arteries are favoring hemodynamics, rather than longer and narrower [37]. Another risk factor is that when AComA is longer, commonly becomes tortuous or curved [48]. For those hemodynamic reasons, it is important to investigate AComA morphometry due to the clinical implications. The current meta-analysis identified the AComA length with a pooled mean of 2.84 mm (range 0.38–10.4) and the AComA diameter with a pooled mean of 1.47 mm (range 0.2–4.9). There were no statistically significant differences between the studies’ methodology neither for the length (P = 0.097) nor for the diameter (P = 0.89). However, the results indicate a possible correlation between the studies’ method and the AComA length at the statistically significant level of 0.1 (P = 0.0968 < 0.1), with the estimated mean length being shorter in cadaveric studies compared to imaging studies (2.63 mm for cadaveric studies and 3.48 mm for imaging studies). This relationship could be attributed to the formalin fixation that cadaveric brains undergo, during which the vessels may change their actual size.
Among different studies, the hypoplasia diameter threshold of AComA has not been defined. Dumitrescu et al. [10] based on Iqbal [21] considered the CAC anastomotic branches (AComA and PComA) as hypoplastic when their diameter was less than 0.5 mm. Ardakani et al. [2] recorded that AComA hypoplasia is considered when the artery’s diameter is narrower than 0.6 mm. Krabbe-Hartkamp et al. [31] recommend a threshold diameter of 0.8 mm for hypoplasia, while most of the studies refer to the AComA hypoplasia narrower than 1 mm. These results’ variants could be attributed to different methods and techniques among studies (cadaveric brains, magnetic resonance, and computed tomography angiography- MRA and CTA, etc.). Cadaveric brains undergo formalin fixation and other preserving methods, during which vessels may change their actual size. Clinical imaging (MRA and CTA) studies do not identify small vessels and falsely identify them as absent (previously pointed out that AComA absence was identified statistically more frequent in imaging studies), while cadaveric studies allow direct visualization of vessels, which allows a better result [24]. Nevertheless, it is noteworthy that Jones et al. [24] in their meta-analysis did not indicate any significant differences between the findings of cadaveric and clinical studies, and the same holds for the current meta-analysis. Hence, AComA arteries narrower than 1 mm could be safely defined as hypoplastic according to most studies [11, 18, 26,27,28, 33, 37]. However, it is important to note that an adequate definition of AComA hypoplasia can be achieved only by hemodynamic studies investigating when a vessel diameter is narrow enough to be considered hypoplastic and cause hemodynamic dysfunction. In this context, a previous study indicated that the minimal threshold diameter for collateral flow through the CAC ranges between 0.4 and 0.6 mm; however, this study was conducted on a very small sample of 12 patients [19].
Clinical implications of the AComA variants
The knowledge of the AComA morphological variants has clinical significance, especially for interventionists. Kayembe et al. [30] reported a clear correlation between the CAC variants and cerebral aneurysms and identified many aneurysm cases in the presence of a combination of variants. Leipzig et al. [34] studied the intraoperative aneurysm rupture on 1694 patients with intracranial aneurysms and found the AComA, the second most frequent ruptured aneurysmal artery. Patients with AComA ruptured aneurysms display damage to deep, medial frontal areas, like septal nuclei [9]. Many studies have confirmed that A1 ACA variants (especially the hypoplastic ACA) may cause AComA aneurysms due to the hemodynamic stress and the compensatory shunting of blood through AComA [13, 14, 29, 30, 33, 39, 48, 51, 52]. Rhoton [48] suggested that the greater the diameter difference between bilateral A1 segments, the more likely an AComA aneurysm will develop. Papantchev et al. [44] in a sample of 500 CAC, found that in cases of a hypoplastic or absent AComA, the left ACA was at risk of hypoperfusion during unilateral selective cerebral perfusion, a technique used for cerebral protection. According to Poiseulles-Hagen law, hypoplastic segments offer higher resistance than normal arteries. Thus, during unilateral selective perfusion, blood will follow the lowest resistance course through normal vessels and will bypass the hypoplastic ones, which will lead to hypoperfusion of certain brain areas [43]. The ACAs fusion (5.9% PP) variant and, especially, the AComA fenestration (5% PP) have been associated with aneurysm presence due to the turbulent flow created by a lack of tunica media in the proximal and distal region of the fenestration [23]. Jacquens et al. [22] were the first to associate AComA hypoplasia or absence with an increased incidence of vasospasm. Krzyzewski et al. [33] supported that AComA absence (4.6% PP) increases the risk of ischemia, as it disrupts the CAC circulation. The fact that females have more frequent AComA variants should alert neurosurgeons [33].
Currently, digital subtraction angiography (DSA) is considered the gold standard method to evaluate the CAC morphology and particularly the detection of possible areas of aneurysms [17]. When examining an AComA aneurysm, it is important to estimate the presence of a persistent MACC (2.3% PP) as this vessel becomes one of the draining arteries of the aneurysm [38]. Ogawa et al. [38] highlighted the significance of the persistent MACC coexisting with AComA aneurysm. The persistent MACC courses parallel to and posterior to the pericallosal artery, and this is why it can be easily damaged intraoperatively [38]. Precisely, they identified that in 81.5% of their studied cases, the aneurysm was formed at the AComA trifurcation, ACA A1 segment, and the MACC which makes the surgical manipulations extremely difficult [38]. In this early study (1990), it was indicated that a bifrontal craniotomy and an interhemispheric approach are the best techniques for aneurysmal surgery, due to the wide operative field and the ability to understand the AComA anatomy and adjacent structures [38]. However, nowadays, the pterional approach is popular for the treatment of AComA aneurysms [53]. Overall, it has been proved that smoking, A1 segment asymmetry, pulsatility index in the A1 segment, and the angle between the A1 and A2 segments are independent risk factors for the development of an AComA aneurysm [29]. Alfano et al. [1] observed a significant association between vessel’s bifurcation and aneurysm development (for example, Y-shaped, or V-shaped AComA) due to high wall shear stress. Even recovery levels from vascular diseases, like ischemic stroke patients, may be altered due to the CAC variants. Chuang et al. [6] identified that patients with a typical CAC have earlier improvement than patients with a variant circle in ischemic stroke patients. Especially, in the anterior brain circulation where cerebral infracts most commonly occur, variations are of great importance particularly during surgery [50]. Except for aneurysm formation, the CAC variants have been associated with mental diseases. Blackburn [3] in 220 patients with mental diseases, identified a predominance of variant circles among the mentally diseased. Blackburn [4] analyzed 42 cases of ACA fusion in a total of 400 patients with mental diseases (10.5%), they observed that fusion occurred in all forms of diseases, possibly a little more frequent in dementia. Kamath [25] reported a higher incidence of variant CAC in mentally diseased patients. As intriguing as these findings are, they were based on assumptions and are not definite.
Limitations and future perspectives
The current review has some limitations. The sample had a great degree of heterogeneity for several reasons. There were studies with different methodologies (clinical, cadaveric studies) and different diameter thresholds to define hypoplastic AComAs. In addition, none of the studies analyzed every possible AComA variant. Hence, future studies investigating AComA morphology should use the proposed classification system to study all AComA variants properly. Nevertheless, when conducting the subgroup analysis for geographic regions, only one study was included from America. For this reason, the results could not be safely evaluated because the minimum of four studies per subgroup could not be reached [62]. Except for more systematic anatomical studies on AComA typical and variant morphology, studies investigating the clinical outcomes of patients with variable AComA, as well as the genetic basis of these variants, will further enhance our knowledge.
Conclusion
The current systematic review with meta-analysis depicts the AComA variants and proposes a simplified classification system (based on the PP). The AComA typical pattern was identified in 67.3%, and the variant morphology was identified in 32.7%. Pitfalls associated with imaging studies can include false identification of arterial absence or duplication. Knowledge of AComA variants can aid the planning of neurosurgical procedures including those on the highly prevalent AComA aneurysms.
Data availability
No datasets were generated or analysed during the current study.
References
Alfano JM, Kolega J, Natarajan SK, Xiang J, Paluch RA, Levy EI, Siddiqui AH, Meng H (2013) Intracranial aneurysms Occur more frequently at Bifurcation sites that typically experience higher hemodynamic stresses. Neurosurg 73:497–505. https://doi.org/10.1227/neu.0000000000000016
Ardakani SK, Dadmehr M, Nejat F, Ansari S, Eftekhar B, Tajik P, El Khashab M, Yazdani S, Ghodsi M, Mahjoub F, Monajemzadeh M, Nazparvar B, Abdi-Rad A (2008) The cerebral arterial Circle (Circulus Arteriosus Cerebri). Pediatr Neurosurg 44:388–392. https://doi.org/10.1159/0001499061
Blackburn IW (1907) Anomalies of the encephalic arteries among the insane. A study of the arteries at the base of the encephalon in two hundred and twenty consecutive cases of mental disease, with special reference to anomalies of the circle of Willis. J Comp Neurol Psychol 17:493–517. https://doi.org/10.1002/cne.920170604
Blackburn IW (1910) On the median anterior cerebral artery as found among the insane. J Comp Neurol Psychol 20:185–194. https://doi.org/10.1002/cne.920200303
Chen HW, Yen PS, Lee CC, Chen CC, Chang PY, Lee SK, Lee WH, Ling CM, Chou ASB (2004) Magnetic resonance angiographic evaluation of circle of Willis in the general population: a morphologic study in 507 cases. Chin J Radiol 29:223–229
Chuang Y-M, Chan L, Lai Y-J, Kuo K-H, Chiou Y-H, Huang L-W, Kwok Y-T, Lai T-H, Lee S-P, Wu H-M, Yeh Y-C (2013) Configuration of the Circle of Willis is associated with less symptomatic intracerebral hemorrhage in ischemic stroke patients treated with intravenous thrombolysis. J Crit Care 28:166–172. https://doi.org/10.1016/j.jcrc.2012.08.0181
De Silva KD, Silva R, Gunasekera WSL, Jayesekera R (2009) Prevalence of typical circle of Willis and the variation in the anterior communicating artery: a study of a Sri Lankan population. Ann Indian Acad Neurol 12:157. https://doi.org/10.4103/0972-2327.563141
Deeks JJ, Higgins JP, Altmam DG (2019) Analysing data and undertaking meta-analyses. In: Cochrane Handbook for Systematic Reviews of Interventions pp. 241–284
Dhanalakshmi V, Satish Kumar S, Suresh Kumar T, Arun Kumar K (2019) Anterior communicating artery: a cadaveric study. Int J Anat Res 7:6261–6264. https://doi.org/10.16965/ijar.2018.4531
Dumitrescu AM, Eva L, Haba D, Cucu AI, Dumitrescu GF, Burduloi VM, Dima-Cozma LC, Vatavu R, Moroşanu GC, Sava A (2022) Anatomical study of circle of Willis on fresh autopsied brains. A study of a Romanian population. Rom J Morphol Embryol 63:395–406. https://doi.org/10.47162/rjme.63.2.101
Eftekhar B, Dadmehr M, Ansari S, Ghodsi M, Nazparvar B, Ketabchi E (2006) Are the distributions of variations of circle of Willis different in different populations? – results of an anatomical study and review of literature. BMC Neurol 6. https://doi.org/10.1186/1471-2377-6-221
Fawcett E, Blachford JV (1905) The Circle of Willis: an examination of 700 specimens. J Anat Physiol 40(1):632–670
Feng L, Mao H-J, Zhang D-D, Zhu Y-C, Han F (2023) Anatomical variations in the Circle of Willis and the formation and rupture of intracranial aneurysms: a systematic review and meta-analysis. Front Neurol 13. https://doi.org/10.3389/fneur.2022.10989501
Fredon F, Baudouin M, Hardy J, Kouirira A, Jamilloux L, Taïbi A, Mabit C, Valleix D, Rouchaud A, Durand-Fontanier S (2021) An MRI study of typical anatomical variants of the anterior communicating artery complex. Surg Radiol Anat 43:1983–1988. https://doi.org/10.1007/s00276-021-02782-x
Furuichi K, Ishikawa A, Uwabe C, Makishima H, Yamada S, Takakuwa T (2018) Variations of the Circle of Willis at the end of the human embryonic period. Anat Rec 301:1312–1319. https://doi.org/10.1002/ar.23794
Geetha G, Narayanan S (2021) A cadaveric study of anterior communicating artery. Nat J Clin Anat 10:75. https://doi.org/10.4103/njca.njca_71_201
Han A, Yoon DY, Chang SK, Lim KJ, Cho B-M, Shin YC, Kim SS, Kim KH (2011) Accuracy of CT angiography in the assessment of the circle of Willis: comparison of volume-rendered images and digital subtraction angiography. Acta Radiol 52:889–893. https://doi.org/10.1258/ar.2011.1102231
Hashemi SR, Mahmoodi R, Amirjamshidi A (2013) Variations in the anatomy of the Willis’ circle: a 3-year cross-sectional study from Iran (2006–2009). Are the distributions of variations of circle of Willis different in different populations? Result of an anatomical study and review of literature. Surg Neurol Int 4:65
Hoksbergen AWJ, Fülesdi B, Legemate DA, Csiba L (2000) Collateral configuration of the Circle of Willis. Stroke 31:1346–1351. https://doi.org/10.1161/01.str.31.6.13461
Hostiuc S, Rusu MC, Negoi I, Dorobantu B, Grigoriu M (2019) Anatomical variants of renal veins: a meta-analysis of prevalence. Sci Rep 9:10802. https://doi.org/10.1038/s41598-019-47280-8
Iqbal S (2013) A comprehensive study of the anatomical variations of the Circle of Willis in Adult Human brains. J Clin Diagn Res. https://doi.org/10.7860/jcdr/2013/6580.35631
Jacquens A, Shotar E, Bombled C, Glémain B, Sourour N-A, Nouet A, Premat K, Lenck S, Degos V, Clarençon F (2020) Is anatomical variations a risk factor for cerebral vasospasm in Anterior communicating Complex aneurysms rupture? Stroke 51:998–1001. https://doi.org/10.1161/strokeaha.119.0266611
Jiménez-Sosa MS, Cantu-Gonzalez JR, Morales-Avalos R, de la Garza-Castro O, Quiroga-Garza A, Pinales-Razo R, Elizondo-Riojas G, Elizondo-Omaña RE, Guzmán- López S (2017) Anatomical variants of Anterior cerebral arterial Circle: a study by Multidetector computerized 3D Tomographic Angiography. Int J Morphol 35:1121–1128. https://doi.org/10.4067/s0717-950220170003000491
Jones JD, Castanho P, Bazira P, Sanders K (2020) Anatomical variations of the circle of Willis and their prevalence, with a focus on the posterior communicating artery: a literature review and meta-analysis. Clin Anat 34:978–990. https://doi.org/10.1002/ca.236621
Kamath S (1981) Observations on the length and diameter of vessels forming the circle of Willis. J Anat 133(Pt 3):419–423
Kapoor K, Singh B, Dewan LIJ (2008) Variations in the configuration of the circle of Willis. Anat Sci Int 83:96–106. https://doi.org/10.1111/j.1447-073x.2007.00216.x1
Karatas A, Yilmaz H, Coban G, Koker M, Uz A (2015) The anatomy of circulus arteriosus cerebri (circle of Willis): a study in Turkish population. Turk Neurosurg. https://doi.org/10.5137/1019-5149.jtn.13281-14.11
Kardile PB (2013) Anatomical variations of anterior communicating artery. J Clin Diagn Res Doi. https://doi.org/10.7860/jcdr/2013/6664.37251
Kaspera W, Ładziński P, Larysz P, Hebda A, Ptaszkiewicz K, Kopera M, Larysz D (2014) Morphological, Hemodynamic, and clinical independent risk factors for anterior communicating artery aneurysms. Stroke 45:2906–2911. https://doi.org/10.1161/strokeaha.114.0060551
Kayembe KN, Sasahara M, Hazama F (1984) Cerebral aneurysms and variations in the circle of Willis. Stroke 15:846–850. https://doi.org/10.1161/01.str.15.5.8461
Krabbe-Hartkamp MJ, van der Grond J, de Leeuw FE, de Groot JC, Algra A, Hillen B, Breteler MM, Mali WP (1998) Circle of Willis: morphologic variation on three-dimensional time-of-flight MR angiograms. Radiol 207:103–111. https://doi.org/10.1148/radiology.207.1.95303051
Krzyzewski RM, Tomaszewska IM, Lorenc N, Kochana M, Goncerz G, Klimek-Piotrowska W, Walocha K, Urbanik A (2014) Variations of the anterior communicating artery complex and occurrence of anterior communicating artery aneurysm: A2 segment consideration. Folia Med Cracov 54(1):13–20
Krzyżewski RM, Tomaszewski KA, Kochana M, Kopeć M, Klimek-Piotrowska W, Walocha JA (2014) Anatomical variations of the anterior communicating artery complex: gender relationship. Surg Radiol Anat 37:81–86. https://doi.org/10.1007/s00276-014-1313-71
Leipzig TJ, Morgan J, Horner TG, Payner T, Redelman K, Johnson CS (2005) Analysis of intraoperative rupture in the Surgical treatment of 1694 Saccular aneurysms. Neurosurgery 56:455–468. https://doi.org/10.1227/01.neu.0000154697.75300.c2
López-Sala P, Alberdi N, Mendigaña M, Bacaicoa M-C, Cabada T (2020) Anatomical variants of anterior communicating artery complex. A study by Computerized Tomographic Angiography. J Clin Neurosci 80:182–187. https://doi.org/10.1016/j.jocn.2020.08.0191
Menshawi K, Mohr JP, Gutierrez J (2015) A functional perspective on the Embryology and anatomy of the cerebral blood supply. J Stroke 17:144. https://doi.org/10.5853/jos.2015.17.2.1441
Nyasa C, Mwakikunga A, Tembo LH, Dzamalala C, Ihunwo AO (2021) Anatomical variations and morphometric properties of the circulus arteriosus cerebri in a cadaveric Malawian population. Fol Morphol 80:820–826. https://doi.org/10.5603/fm.a2020.01421
Ogawa A, Suzuki M, Sakurai Y, Yoshimoto T (1990) Vascular anomalies associated with aneurysms of the anterior communicating artery: microsurgical observations. J Neurosurg 72:706–709. https://doi.org/10.3171/jns.1990.72.5.07061
Orakdogen M, Emon ST, Somay H, Engin T, Is M, Hakan T (2016) Vascular variations associated with intracranial aneurysms. Turk Neurosurg. https://doi.org/10.5137/1019-5149.jtn.17839-16.11
Ozaki T, Handa H, Tomimoto K, Hazama F (1977) Anatomical variations of the arterial system of the base of the brain. Arch Jap Chir 46:3–17
Padget DH (1944) The circle of Willis: its embryology and anatomy. In: WE, Dandy (eds) Intracranial arterial aneurysms. Comstock Publishing Co, New York, pp 67–90
Page MJ, McKenzie JE, Bossuyt PM, Boutron I, Hoffmann TC, Mulrow CD, Shamseer L, Tetzlaff JM, Akl EA, Brennan SE et al (2021) The PRISMA 2020 statement: an updated guideline for reporting systematic reviews. BMJ 372:n71. https://doi.org/10.1136/bmj.n71
Papantchev V, Hristov S, Todorova D, Naydenov E, Paloff A, Nikolov D, Tschirkov A, Ovtscharoff W (2007) Some variations of the circle of Willis, important for cerebral protection in aortic surgery — a study in Eastern europeans. Eur J Cardiothorac Surg 31:982–989. https://doi.org/10.1016/j.ejcts.2007.03.0201
Papantchev V, Stoinova V, Aleksandrov A, Todorova-Papantcheva D, Hristov S, Petkov D, Nachev G, Ovtscharoff W (2013) The role of Willis circle variations during unilateral selective cerebral perfusion: a study of 500 circles. Eur J Cardiothorac Surg 44:743–753. https://doi.org/10.1093/ejcts/ezt1031
Puchades-Orts A, Nombela-Gomez M, Ortuño-Pacheco G (1976) Variation in form of circle of Willis: some anatomical and embryological considerations. Anat Rec 185:119–123. https://doi.org/10.1002/ar.10918501121
Ravikanth R, Philip B (2019) Magnetic resonance angiography determined variations in the circle of Willis: analysis of a large series from a single center. Tzu Chi Med J 31:52. https://doi.org/10.4103/tcmj.tcmj_167_171
Raybaud C (2010) Normal and abnormal embryology and development of the intracranial vascular system. Neurosurg Clin N Am 21:399–426. https://doi.org/10.1016/j.nec.2010.03.0111
Rhoton AL (2002) The supratentorial arteries. Neurosurgery 51:S1–53. https://doi.org/10.1097/00006123-200210001-00003
Riveros A, Vega C, Negroni M, Villagrán F, Binvignat O, Olave E (2022) Variations of the cerebral arterial Circle. Morphological and clinical analysis. Int J Morphol 40:632–639. https://doi.org/10.4067/s0717-950220220003006321
Shatri J, Cerkezi S, Ademi V, Reci V, Bexheti S (2019) Anatomical variations and dimensions of arteries in the anterior part of the circle of Willis. Fol Morphol 78:259–266. https://doi.org/10.5603/fm.a2018.00951
Stehbens WE (1963) Aneurysms and anatomic variation of cerebral arteries. Arch Pathol 75:45–64
Stojanovic N, Stefanovic I, Randjelovic S, Mitic R, Bosnjakovic P, Stojanov D (2009) Presence of anatomical variations of the circle of Willis in patients undergoing surgical treatment for ruptured intracranial aneurysms. Vojnosanit Pregl 66:711–717. https://doi.org/10.2298/vsp0909711s1
Suzuki M, Fujisawa H, Ishihara H, Yoneda H, Kato S, Ogawa A (2007) Side selection of pterional approach for anterior communicating artery aneurysms – surgical anatomy and strategy. Acta Neurochir 150:31–39. https://doi.org/10.1007/s00701-007-1466-9
Thenmozhi A, Kalpana R, Subadha C (2019) Anatomic variants of the anterior part of the cerebral arterial circle: a cadaveric study. Int J Anat Res 7:6516–6520. https://doi.org/10.16965/ijar.2019.1561
Tudose RC, Rusu MC, Hostiuc S (2023) The Vertebral Artery: A Systematic Review and a Meta-Analysis of the Current Literature. Diagnostics 13: 2036. https://doi.org/10.3390/diagnostics13122036
Wijesinghe P, Steinbusch HWM, Shankar SK, Yasha TC, De Silva KRD (2020) Circle of Willis abnormalities and their clinical importance in ageing brains: a cadaveric anatomical and pathological study. J Chem Neuroanat 106:101772. https://doi.org/10.1016/j.jchemneu.2020.1017721
Windle BC (1888) The arteries forming the circle of Willis. J Anat Physiol 22(2):289
Żurada A, Gielecki J, Shane Tubbs R, Loukas M, Maksymowicz W, Chlebiej M, Cohen-Gadol AA, Zawiliński J, Nowak D, Michalak M (2011) Detailed 3D-morphometry of the anterior communicating artery: potential clinical and neurosurgical implications. Surg Radiol Anat 33:531–538. https://doi.org/10.1007/s00276-011-0792-z1
Uchino A (2022) Variations of the proximal anterior cerebral artery (ACA), including anterior communicating artery (ACoA). Atlas of the Supraaortic Craniocervical arterial variations. Springer, Singapore. https://doi.org/10.1007/978-981-16-6803-6_9
Schwarzer G, Carpenter JR, Rücker G (2015) Small-study effects in Meta-Analysis. Meta-analysis with R. Use R! Springer, Cham. https://doi.org/10.1007/978-3-319-21416-0_5
Viechtbauer W, Cheung MW-L (2010) Outlier and infuence diagnostics for meta-analysis. Res Synth Methods 1:112–125. https://doi.org/10.1002/jrsm.11
Fu R, Gartlehner G, Grant M, Shamliyan T, Sedrakyan A, Wilt TJ, Grifth L, Oremus M, Raina P, Ismaila A (2011) Conducting quantitative synthesis when comparing medical interventions: AHRQ and the efective health care program. J Clin Epidemiol 64(11):1187–1197
Balduzzi S, Rücker G, Schwarzer G (2019) How to perform a meta-analysis with R: a practical tutorial. Evid Based Ment Health 22(4):153–160
Harrer M, Cuijpers P, Furukawa TA, Ebert DD (2021) Doing Meta-Analysis with R: A Hands-On Guide. Boca Raton, FL and London: Chapman & Hall/CRC Press. ISBN 978-0-367-61007-4
Higgins JP, Thompson SG, Deeks JJ, Altman DG (2003) Measuring inconsistency in meta-analyses. BMJ 327(7414): 557 – 60. https://doi.org/10.1136/bmj.327.7414.5
Funding
None.
Open access funding provided by HEAL-Link Greece.
Author information
Authors and Affiliations
Contributions
George Triantafyllou (GTr) and Razvan Costin Tudose (RCT) equally contributed to this paper, as first authors. Conceptualization: GTs, TK, MP, ML; methodology: GTr, RST, CC, CK, MCR; data collection: GTr, RCT, CT, KN, KAN; writing—original draft: GTr, RCT, MP, ML; statistical analysis: RCT, CT, MCR; schematic drawing of the paper: KAN; writing—review and editing: CT, GTs, TK, CC, KN, RST, CK, KAN, MCR, AK; critical revision of the manuscript: all authors; approval of the final version of the manuscript: all authors.
Corresponding author
Ethics declarations
Ethical approval
As this is a review paper, no ethical clearance was required.
Consent for publication
All the authors gave consent for the publication of this review.
Competing interests
The authors declare no competing interests.
Additional information
Publisher’s Note
Springer Nature remains neutral with regard to jurisdictional claims in published maps and institutional affiliations.
Rights and permissions
Open Access This article is licensed under a Creative Commons Attribution 4.0 International License, which permits use, sharing, adaptation, distribution and reproduction in any medium or format, as long as you give appropriate credit to the original author(s) and the source, provide a link to the Creative Commons licence, and indicate if changes were made. The images or other third party material in this article are included in the article’s Creative Commons licence, unless indicated otherwise in a credit line to the material. If material is not included in the article’s Creative Commons licence and your intended use is not permitted by statutory regulation or exceeds the permitted use, you will need to obtain permission directly from the copyright holder. To view a copy of this licence, visit http://creativecommons.org/licenses/by/4.0/.
About this article

Cite this article
Triantafyllou, G., Tudose, R.C., Tsiouris, C. et al. The anterior communicating artery variants: a meta-analysis with a proposed classification system. Surg Radiol Anat 46, 697–716 (2024). https://doi.org/10.1007/s00276-024-03336-7
Received:
Accepted:
Published:
Issue Date:
DOI: https://doi.org/10.1007/s00276-024-03336-7