
Abstract
Research interest in the reaction of consumption to expected inflation has increased in recent years due to efforts by central banks to kick-start demand by steering inflation expectations. We contribute to this literature by analysing whether various components of households’ balance sheets determine how consumption reacts to expected inflation. Two channels in particular are conceivable: an increase in inflation expectations can raise consumption through direct increases in expected real wealth, e.g. for households with nominal financial liabilities. By affecting the real interest rate, expected inflation can interact with wealth if only those households can adapt their consumption to current real interest rates that are not budget-constrained or sufficiently liquid to shift funds between consumption and savings. We investigate these channels empirically using household-level information on balance sheets, durable consumption and inflation expectations from the Dutch Central Bank’s Household Survey. We find that investments in risky assets as well as net worth moderates the relation between expected inflation and durable spending decisions. The net worth effect is most pronounced for households with fixed interest rate mortgages.
1 Introduction
Hypotheses on why inflation expectations can have an impact on consumption on the micro-level are based on two arguments. First, inflation expectations change the real interest rate and could therefore affect consumption through intertemporal substitution. Second, they affect expected real wealth and therefore consumption out of real wealth. In both cases the composition of a household’s balance sheet can alter the size and direction of the effect of inflation expectations on spending. Attempts to gauge this interaction in the literature have been incomplete. Several authors estimated the impact of inflation expectations on consumption. These studies have often exploited some sort of natural experiment such as the zero lower bound or value-added tax increases to identify a causal relationship using cross-sectional (Bachmann et al. 2015; Ichiue and Nishiguchi 2015; D’Acunto et al. 2016) or panel data (Burke and Ozdagli 2013; Crump et al. 2015; Duca et al. 2018) without reaching consensus on the sign or size of the effect. However, no analysis has properly accounted for the potential role of the balance sheet as a moderator of the effect of price expectations on spending. In this paper we investigate empirically whether different components of a household’s balance sheet interact with its inflation expectations in affecting realised consumer spending. To this end, we use panel data on household level balance sheets, inflation expectations and durable consumer spending from the Dutch Central Bank’s (DNB) Household Survey.
While the use of micro-level data to study the nexus between inflation expectations and consumer spending has allowed researchers to estimate cross-sectional effects, almost no attention has been paid to analyse the economic mechanisms behind these “general” effects. Changes in the real interest rate affect a household’s optimal allocation of consumption over time. Differences in inflation expectations can lead to differences in the perceived real interest rate both over time and across households. Depending on their balance sheets, households might or might not be able to shift funds from savings to current spending or vice versa. Additionally, access to and costs of credit financed consumption might differ between households depending on the available collateral. We characterise these two channels through which inflation expectations can affect spending as real interest rate dependent. Another channel that motivates the research question of this paper is a real wealth channel. Inflation expectations determine expected real wealth. In case of rising inflation expectations debtors expect increases in real wealth, while creditors expect falls in real wealth. The net nominal position of their balance sheet measures their exposure to price level changes. Empirical evidence suggests that consumption is sensitive to changes in wealth (Case et al. 2005; Mian et al. 2013). Consequently, inflation expectations and balance sheet positions might interact on the micro-level. This could have macroeconomic effects if debtors have a higher propensity to consume than creditors. Here we refer to the growing heterogeneous agent literature that emphasises the relevance of differential marginal propensities to consume of households with differing balance sheet compositions (Cloyne et al. 2020; Auclert 2019). Another reason is the inflation-hedging nature of certain assets: owners of real estate and stocks are relatively well protected against devaluation effects of inflation (Fama and Schwert 1977; Kim and In 2005) whereas financial liabilities are repaid in nominal terms. Accordingly, spending of net debtors is expected to be more sensitive to changes in expected inflation than for net owners of real estate and stocks.Footnote 1
Our approach departs from the literature in important ways. First, we try to identify specific economic channels that determine the effect of inflation expectations on spending. The granular information on households’ balance sheet in our data set allows us to test explicitly what role balance sheets play in moderating the effect of price expectations on durable spending. Second, we analyse realised spending, rather than planned spending or attitudes towards spending. These two latter measures, often used in the literature, will likely overestimate a positive effect of inflation expectations on spending since households might be willing to consume but liquidity constraints impede them from doing so. Third, observing households over time allows us to better capture the intertemporal dimension of consumption decisions, which is particularly important if agents are forward looking and expectations play a crucial role.
Sufficient and accurate control for confounders in analyses of large scale surveys poses problems. The DNB Household Survey contains a wide range of household characteristics. Including all characteristics that could potentially impact consumption behaviour is not feasible. Selecting controls only based on personal judgement or theory might lead to omission or unnecessary inclusion of some variables. Instead we apply a data-driven post-double variable selection procedure of the type introduced by Belloni et al. (2014a). With penalised regression techniques, we only select those variables that impact the dependent variable and the independent variables of interest in the data. This limits the danger of omitted variable bias while ensuring a parsimonious specification. Moreover, the panel dimension of our data allows us to control for time-invariant confounders in general.
The results of our paper give support to channels we classified as real interest rate and real wealth dependent. Financial investments moderate the effect of inflation expectations on spending which can be explained by the real interest rate channel. We also find that the positive relation between expected inflation and the probability of positive durable expenditures is amplified for households with lower net worth. The effect is stronger among a subsample of households with fixed interest mortgages. We interpret this result as evidence for the real wealth channel which depends on the net nominal position of the balance sheet combined with heterogeneities arising from the composition of the balance sheet.
The rest of the paper is organised as follows. In Sect. 2 we review the related literature. We discuss possible economic mechanisms that link consumption decisions, inflation expectations and the balance sheet in Sect. 3. The data are presented in Sect. 4. In Sect. 5 we present our econometric framework. Results are discussed in Sect. 6. Section 7 concludes.
2 Related literature
A number of influential contributions by Coibion and Gorodnichenko (2012, 2015a) and Coibion et al. (2017) have initiated a renewed discussion about the formation of inflation expectations and their macro- and microeconomic effects. They provide substantial evidence that inflation expectations by consumers, businesses and even professionals and central bankers do not satisfy the conditions for full information rational expectations. Thus, consumers make systematic forecasting errors that, according to Coibion and Gorodnichenko (2015b), can help explain macro-puzzles, such as the missing disinflation in the US after 2009. In this paper we complement their work by investigating the channels through which consumers’ inflation expectations affect microeconomic choices.
More closely related to our research question are previous studies that have used micro-data to estimate the effects of inflation expectations on consumer spending. As stated above, no clear consensus has been reached on the direction or size of the effect. Bachmann et al. (2015) use repeated cross sections of the Michigan Survey of Consumers to investigate the effect of inflation expectations of households on their “readiness to spend”. The authors relate readiness to spend to a survey question on whether the current period is a good time to spend money on durable goods. They find that during the zero lower bound episode higher inflation expectations had slightly negative effects on the probability for households to have positive spending attitudes arguing that high inflation expectations might be correlated with increased economic uncertainty. The authors perform a number of regressions in search of heterogeneities in the relationship between inflation expectations and spending attitudes, for instance by including binary measures of home ownership and proxying an individual’s debtor status with age. They do not specifically analyse wealth channels that moderate the spending response to inflation expectations. Ichiue and Nishiguchi (2015) approach the problem similarly, but with Japanese data and find strong positive effects of inflation expectations on planned spending. They argue that, after a long period of zero nominal interest rates, Japanese consumers have understood how inflation affects the real interest rate and therefore react. The authors do not further investigate the role of balance sheets. In contrast to both of these studies, we construct a measure of realised spending and allow for a moderating role of balance sheet variables in the relation between expected inflation and spending.
A very different approach has been taken by D’Acunto et al. (2016). Their paper uses a value-added tax increase in January 2007 in Germany to estimate the effects of exogenous changes in inflation expectations. Compared to households in other European countries that did not experience the VAT increase, German households were substantially more likely to have positive attitudes towards spending in the months before the tax increase came into force. A limitation of this approach is that the price expectations of German households in November and December of 2006 contained considerably less uncertainty than those of households in other European countries. Households knew that a VAT increase will unambiguously increase prices of consumer products. They usually cannot form expectations with such certainty and precision. The effect of inflation expectations on consumption might differ substantially in times with less salient events or policy changes that nonetheless impact inflation.
The study most similar to ours is Burke and Ozdagli (2013). Using survey responses on expected inflation and realised spending on a wide range of products of a panel of American households between 2009 and 2012, they find much less clear results than the studies presented above. Households do not seem to increase their durable expenditures as a result of higher inflation expectations. In addition, they find evidence for effects on non-durable expenditures, driven by owners of real estate. Even though we analyse durable expenditures, this finding justifies our strategy of carefully investigating potential interactions of expected inflation with balance sheet variables. Burke and Ozdagli (2013) can only observe binary measures of balance sheet variables, such as home ownership. Crump et al. (2015) estimate the subjective elasticity of intertemporal substitution based on survey responses on expected inflation and planned consumer spending of a panel of American households in the Survey of Consumer Expectations. They find that the elasticity of planned consumption to changes in expected inflation is around 0.5. While planned spending is a better proxy for spending than “readiness to spend”, it isn’t a realised measure neither. Based on a large panel of Eurozone households, Duca et al. (2018) find small positive effects of increased inflation expectations on households’ “readiness to spend”. While they control for household wealth, they do not examine the balance sheet channels we suggest.
3 Mechanisms
Next we discuss different mechanisms through which balance sheets could affect households’ spending responses to changes in expected inflation. Potential candidates are real interest rate and real wealth changes that result from changed inflation expectations. In addition to balance sheet size and its net position, we also discuss how differences in its composition could moderate the spending response of inflation expectations.
3.1 Intertemporal Substitution
Consumers adapt their spending behaviour when relative prices change by substituting the more expensive for the cheaper good. Price changes over time also change the purchasing power of consumers’ income in different periods which may affect their selected intertemporal consumption bundle. These standard substitution and income effects of relative price changes can be illustrated by the following basic set-up. Consider the following intertemporal budget constraint for a household with nominal income \(y_t\), nominal interest rate i and consumption good \(c_t\) with price \(p_t\) in periods 1 and 2:
By normalising \(p_1\) to 1 and defining \(\pi ^e = \frac{p_2 - p_1}{p_1}\), we can rewrite the previous equation as
An increase in \(\pi ^ { e }\) raises the expected future price of the consumption good relative to its current price and lowers the real interest rate. This triggers the standard substitution effect: consumers want to increase current spending relative to future spending since the price of the good is lower in the current period. In contrast, the direction of the income effect depends on whether the consumer is borrower or saver. The lower real interest rate benefits the borrower: by transferring income from period 2 to period 1, one can increase total consumption compared to a situation with higher real interest rates. Savers lose: the income they transfer from period 1 to period 2 earns less real interest, therefore total consumption falls. Even this very basic set-up predicts differential consumption responses for households based on their balance sheet position: debtors will increase their current consumption by more than savers if their expectations about future prices rise. The qualitative conclusion does not change if future income is indexed to inflation, only the degree to which consumption is transferred to the current period would be lower.
However, not all households face the same perceived borrowing conditions. Analogous to the argument made by Bernanke (1993) for firms, households with higher net worth are generally seen as more credit-worthy by banks and might face better borrowing conditions. Thus, even under constant economy-wide nominal interest levels the perceived borrowing conditions for households do not only depend on their inflation expectations. The same change in inflation expectations can lead to different household-specific perceived borrowing conditions if the balance sheet quality differs. Applying this idea to the relationship between inflation expectations and consumption is not new: Ichiue and Nishiguchi (2015) make the same point in their analysis, but cannot convincingly test it.
3.2 Real Wealth
An increase in expected inflation leads to a reduction in expected real wealth since the expected price level of the future period is now higher than before while nominal wealth has remained constant. For debtors the opposite is true: higher inflation will reduce the expected real value of debt and thus increase their expected net worth. The observation that changes in wealth have effects on consumption has been widely documented in the past using both macro- and micro-data (Case et al. 2005; Mian et al. 2013). The most appropriate measure for the exposure of a household’s financial position to changes in the price level is its nominal net worth, i.e. assets minus liabilities.
3.3 Balance Sheet Composition
However, this view on the real wealth channel may be too simplistic. There are various reasons why differences in the composition of the balance sheet could lead to different consumption reactions of households with the same nominal net worth. First, there are differences in the sensitivity of various assets and liabilities to inflation. Real estate or financial investments can serve as a protection against inflation. Fama and Schwert (1977) have shown that returns on real estate protect fully against unanticipated as well as anticipated inflation. They regressed the expected nominal return of several assets on expected inflation. If the coefficient of expected inflation is equal to one, the nominal return compensates for losses in real returns on average. Thus, the expected real return does not change when inflation expectations change. More recent studies have confirmed the long-run inflation hedging nature of real estate and found mixed evidence for the short-run analysis conducted by Fama and Schwert (1977) (Anari and Kolari 2002; Hoesli et al. 2008). While Fama and Schwert (1977) cannot confirm the inflation hedging nature of stocks in the short term, later studies came to the conclusion that in the long-run stock investments have the same inflation hedging property as real estate (Schotman and Schweitzer 2000; Kim and In 2005). Households with a substantial part of their wealth invested in these asset classes might not regard higher future inflation as a threat to their future wealth since their investment strategy is designed to protect against such developments. Even if this protection is not perfect, it is superior to, say, for cash holdings. Households with cash holdings as their only assets have no way of protecting themselves against real losses due to inflation. Similarly, debt contracts usually specify a nominal amount that has to be repaid. Here, higher inflation expectations lead to an expected decrease in the real value of debt, i.e. increasing real wealth. To summarise, households who invested large parts of their wealth into real estate or financial investments are expected to exhibit less sensitivity to inflation expectations in their consumption decisions. Households with relatively large exposure to cash or debt may react more strongly since their expected real wealth necessarily changes in response to changing inflation expectations.
Composition effects could play a role on the liability side as well. While most liabilities are repaid in nominal terms, differences across liabilities arise with respect to the interest payment schemes. Specifics of mortgage contracts play an important role in the transmission of nominal interest rates to household behaviour, especially consumption: Di Maggio et al. (2017) show that holders of adjustable rate mortgages respond significantly stronger to nominal interest rate shocks than those with fixed rate mortgages and without mortgages. These results have been confirmed in different settings. Cloyne et al. (2020) show that household balance sheet composition in the US and the UK alters the spending response to changes in the nominal interest rate, suggesting differing marginal propensities to consume between home owners with mortgages (high) and outright owners (low). Cumming and Hubert (2019) show a positive relation between the share of financially constrained (adjustable rate) mortgage holders and aggregate consumption responses to monetary policy shocks. While in the US and the UK interest on mortgages is predominantly paid at adjustable rates, interest in the Netherlands is predominantly paid at rates fixed for more than one year (83% of the total volume (DNB 2020)). We argue that households with these kind of mortgages are an interesting subsample to study the spending response to changes in inflation expectations on. The argument builds on a similar intuition as that applied by the authors cited above. Without nominal rigidities, changes in inflation expectations should not have real effects. The insensitivity of interest payments on fixed rate mortgages to nominal rates potentially increases the impact of changes in inflation expectations on real expected disposable income.Footnote 2 If the marginal propensity to consume for more constrained households is indeed higher, those fixed rate mortgage holders with lower net worth should exhibit a stronger response to changes in their inflation expectations. We test this hypothesis in Sect. 6.3.
Any of the above channels imply that individuals with a different balance sheet composition (both concerning the relative sizes of assets and liabilities and the relative importance of specific classes of assets and liabilities), but identical changes in inflation expectations could exhibit differing spending responses. These considerations give rise to an econometric specification in which we allow for interactions between households’ expected inflation and its different balance sheet components. Section 5 outlines how we aim to test the different mechanisms and what effects they would imply for our empirical analysis. By accounting for this interaction we depart from the previous literature on the topic. All of the aforementioned authors have stressed in their papers that wealth might play a role in the relationship between expected inflation and (durable) consumption. Our key contribution consists of testing this channel in a novel way.
4 Data
Our aim in this study is to explore the interaction between households’ inflation expectations and their balance sheets in determining spending decisions. Information on all variables needs to be at the household level and available for the same household over several years.
Contrary to previous studies, we set out to analyse realised consumer spending instead of attitudes to spending in general. However, specific survey answers on total (durable) expenditures might involve substantial measurement error. It is much easier to recall expenditures for specific durable goods since these items are seldom purchased and each individual purchase accounts for a substantial fraction of total spending of that period.
Additionally, our analysis requires balance sheet information on the household level. The literature on wealth effects on consumption concludes that different types of assets and liabilities might have different effects on consumer expenditures (Case et al. 2005). To provide a thorough account of the interaction we want to analyse individual balance sheet components as well as the net financial position of the households.
For the reasons mentioned above we make use of the DNB Household Survey (DHS) administered by CentERdata (Tilburg University, The Netherlands) and issued by the Dutch Central Bank (DNB). It includes households’ self-reported balance sheets and their expected one year ahead inflation rate. Part of the self-reported balance sheet consists of vehicles owned by the household. We use this information to construct a variable of household vehicle expenditures (more details below). The DHS is an unbalanced panel of 12.439 households with annual observations between 1993 and 2018. More than one household member can respond to the survey. Since the balance sheets are aggregated at the household level, we primarily use responses to household member specific questions from the first member of the household. If the first member has not answered a specific question we use the response of the second member. This results in 52.055 household-year observations from which we construct our variables of interest. The survey is typically completed by respondents between the 15th and 26th calendar week of a year with some exceptions in case respondents need to be reminded of completion.
We want to stress the unique fit of this data set for our purposes. To our knowledge, no previous study has made use of such extensive balance sheet information to analyse the effect of inflation expectations on realised consumer spending.
In the following, we give an overview of the different variables of interest and provide descriptive statistics.
4.1 Measuring durable consumption
In recent papers many authors concentrate on analysing the effects of inflation expectations on durable consumption (Burke and Ozdagli 2013; Bachmann et al. 2015; Ichiue and Nishiguchi 2015). We follow the literature in this respect. Durable consumption is the component of aggregate consumption most likely to be affected by variations in the real interest rate since it is more likely to be credit financed than expenditures on non-durable goods. Additionally, demand for non-durable consumption is less elastic to changes in macroeconomic conditions in general.
The DNB Household Survey does not include questions on expenditures on different classes of durable goods. However, households do report a large part of their assets. Among those are vehicles, such as cars, motorbikes and boats. For each of these items households report the purchasing price and additional details on the vehicle, such as its build year. We construct our expenditure variable by recording each time the purchasing price changes. If the purchasing price stays constant but the build year changes, a purchase is recorded as well. For the extensive margin, the consumption variable takes the value 0 in case we record no change in the vehicle and 1 in case there is a change.Footnote 3 The fraction of households that have purchased a vehicle in a specific year is shown in Fig. 1a.Footnote 4 For those households that did buy a car we construct a variable capturing the intensive margin of the purchase, i.e. the amount a household spent on vehicles, i.e. the sum of changed purchasing prices. Figure 1b shows the mean, the 10th and 90th percentile of this variable’s distribution over the sample period.
It is unclear whether we should expect the effects outlined above to materialise on the extensive or the intensive margin of a purchase. In theory, the mechanisms could play a role in both decisions a household has to make. When emphasising the extensive margin, we assume that households’ tastes regarding durable goods are relatively fixed over time and the element of the decision that is subject to variations in expected inflation is the timing of the purchase. In a year in which a household has higher inflation expectations it might be more likely to buy the durable item it had already planned to acquire for longer. This reasoning is consistent with some results that emerged from the literature analysing the “hot potato” effect of inflation. The “hot potato” effect refers to the observation that consumers spend their money faster in times of high inflation. In a search based monetary theory model, Liu et al. (2011) find that inflation affects especially the extensive margin of the purchasing decision.
On the extensive margin, we observe 12,620 vehicle purchases throughout the entire sample period. In 39,435 household-year observations, no purchase has taken place. Figure 1c shows from how many household observations we can draw to construct the extensive margin variable. For roughly 30% of households we only observe the purchasing decision once. This means that these households participated in two consecutive waves of the survey, allowing us to evaluate whether the purchasing price of their vehicles changed. Figure 1d depicts the fraction of households with a certain number of vehicle purchases. For a majority of households we do not observe any purchase. Roughly 45% of households we observe between one and five purchases.
However, the sample that enters our regression analysis shrinks considerably since not all households answer all survey questions. Due to limited overlap with the variables capturing expected inflation, the remaining balance sheet variables, current and expected income, we are left with 8663 observations from 3092 households. We use the full sample when applying a linear probability model. The application of the conditional logit model reduces our sample size further as it drops households for which the extensive margin variable does not change value, leaving us with 4790 observations from 909 households.
On the intensive margin we would be limited to a much lower number of observations. In our preferred specification we would have to rely on a sample of 2645 observations from 1396 households. In a fixed-effects framework an average number of 1.89 observations per panel unit would not allow us to draw any meaningful conclusions. Therefore, we do not proceed with analysing the intensive margin further.
How much can vehicle expenditures tell us about durable consumption? To answer this question, we take a look at the aggregate durable and vehicle expenditures in the Netherlands. Figure 1e shows all subcategories of total durable consumption as defined by CBS, the Dutch statistical agency. Vehicle expenditures account for about 20% of total durable consumption in the Netherlands across the whole sample period. They are the second biggest component of durable consumption after textiles and clothing. Additionally, as Fig. 1f shows, they are highly correlated with total durable expenditures (correlation coefficient of 0.95 between 1995 and 2015). We indeed find that, on the aggregate level, vehicle purchases in the Netherlands instrument overall durable consumption very well, as indicated in Fig. 1f and as suggested by an effective (marginal) F-statistic of 183. Furthermore, vehicle purchases have frequently been used in the literature to gauge the dynamic behaviour of aggregate durable spending (see e.g. Mian et al. 2013; Berger and Vavra 2015; Ravn et al. 2020).

Descriptives
4.2 Inflation expectations
In the DHS households are asked the following question about their expectations for one year ahead inflation:
What is the most likely (consumer)prices increase over the next twelve months, do you think?
Since 2008 the possible answers are given between 1 and 10% in steps of one. Before, respondents were free to respond with any number they liked. To ensure consistency between the responses given before and after 2008, we enforce the same limitation in the answer range before 2008. Figure 1g shows the development of this variable over time. There is a clear peak after the introduction of the Euro. After that the downward trend in average expectations continues until well after 2008 and has stabilised close to but above 2% after that.
Figure 1h compares average expected inflation in the Netherlands with the realised CPI values. Expected inflation is structurally higher than realised inflation but trends are well anticipated by households. The latter observation is more relevant for our study since we are mainly interested in changes in inflation expectations. Secondly, this alleviates concerns that inflation expectations by (laymen) survey respondents are completely detached from actual inflation and instead measure expectations or perceptions of some other variables.
4.3 Balance sheet
Table 1 shows the individual balance sheet components that households report as well as the aggregation level at which we include them in our models (in bold). Grouping of assets is largely determined by the liquidity of the balance sheet item. Among illiquid assets we differentiate between real estate and other assets to acknowledge the special role housing wealth could play. We group liabilities according to maturity. Mortgages and other longer term debt (referred to as loans) are aggregated separately. The net worth variable is constructed by subtracting liabilities from assets.
Instead of having to interpret our results in units of currency, we prefer to analyse percentage changes. The usual log-transformation is not well suited for our variables since many households do not possess some of the balance sheet variables. Their observations would be lost in case of a log-transformation. In the case of the net worth variable all negative net worth observations would be dropped as well. Instead, we perform an inverse hyperbolic sine transformation (ihs).Footnote 5 Table 2 gives descriptive statistics for all balance sheet variables that enter our regressions in the empirical analysis.
5 Empirical approach
As pointed out in Sect. 3, there are several arguments why inflation expectations could matter for spending decisions and how wealth could alter size and direction of this relation. In this section we motivate our econometric approach in light of the transmission channels we aim to investigate. To that end, we run fixed effects linear probability models (LPM) as well as conditional logit (CL) regressions with the binary purchasing variable as dependent variable.
5.1 Specification
Our analysis consists of two baseline specifications. We estimate a fixed effects linear probability model as well as a conditional logit. Below we outline these two specifications. For the linear probability model we run the following regression:
where \(\alpha _ { i }\) and \(\kappa _ { t }\) are household and year-fixed effects, \(E _ { it-1 }\left( \pi _ { t } \right) \) is household \(i's\) expectation at time \(t-1\) for the inflation rate at time t, \(W _ { it - 1 }\) is the value of a particular balance sheet variable in \(t-1\), and \({\varvec{X}} _ { it-1 }\) is household i’s set of other characteristics at time \(t-1\).
In addition, we estimate the following conditional logit model:
where \(\lambda \) denotes the logistic function. The fixed effects logit model imposes the condition that \(T>\sum _{t=1}^{T} c _ {it} > 0\), where T is the total number of periods that the household participated in the survey. This condition implies that only households whose expenditure variable takes on both possible values (0 and 1) are included in the estimation. We construct inference based on bootstrapped standard errors.
Next we discuss how to interpret the models in (1) and (2) in light of the mechanisms outlined in Sect. 3. Two coefficients in the above regressions are of special interest: \(\sigma \), the coefficient for expected inflation, and \(\delta \), the coefficient of the interaction term. \(\delta \) measures in which direction and with what magnitude a specific balance sheet component scales the effect of inflation expectations on consumption. Conversely, when including a single balance sheet components, \(\sigma \) measures the effect of expected inflation on consumption if the household has no holdings of the balance sheet component. For instance, when including net worth as the balance sheet variable, \(\sigma \) measures the relation between inflation expenditures and spending if net worth would be zero. As we argued in Sect. 3, the real interest rate channel would suggest a positive effect of the interaction between expected inflation and household wealth, implying negative effects for any interaction between liabilities and expected inflation. In contrast, the real wealth channel would suggest a negative interaction effect between household wealth and expected inflation. However, many assets serve as hedges against inflation. The real wealth channel on its own would thus predict no significant interaction effect when financial investments or real estate holdings are interacted separately with expected inflation. Any interaction between liabilities and expected inflation is thus expected to have positive effects on the spending variable. The mechanisms that we discussed in Sect. 3 suggest opposite effects of the interaction between wealth and expected inflation. The coefficient of the interaction term is the average magnitude of the real interest and the real wealth channel. That is, if \(\sigma \) is significantly different from zero, one of the two effects dominates. However, this would not necessarily prove the absence of the other effect.
Table 3 gives an overview of the coefficients we would expect for the variables of interest in our regression if the channels could be measured separately. Thus, if the coefficients in our models align with the signs or magnitudes of these coefficients we could claim that the respective channel dominates over the other.
5.1.1 Timing of households’ consumption decision
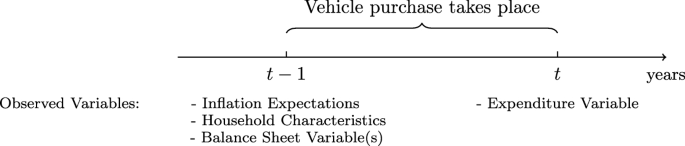
We only include households that are observed in at least two waves of the survey; otherwise, we cannot determine differences (or lack thereof) in their vehicles’ purchasing prices. Since we construct the expenditure variable by comparing purchasing prices of vehicles and do not use specific questions on the subject, we do not observe the exact date of the purchase. In our regressions we relate the vehicle purchase that occurred between period \(t-1\) and t to the balance sheet, inflation expectations and other characteristics observed in period \(t-1\). Since households are asked about their expectations for the coming 12 months, we consider these 12 months as the current period in which the effect on spending should play out. Figure 2 shows which period’s observation of each of the previously introduced variables is used in our analysis.
Timing of the purchasing decision
5.1.2 Selection of controls
Consumers’ purchasing decisions are driven by many factors. We attempt to isolate the role of inflation expectations and various balance sheet items. However, if we do not control for other key predictors, estimation of the coefficients of interest may be biased. While it is plausible to assume that current and expected income are relevant covariates in this context, the survey provides us with detailed information on individual household characteristics (e.g. attitudes toward saving and risk-taking, financial literacy, health, financial situation and expectations, etc.) and, hence, contain other possibly relevant predictors.
In order to identify relevant covariates, we use the “post-double-selection” method proposed by Belloni et al. (2014b). This involves a two-step LASSO regression, which in a first step selects covariates that predict the dependent variable, and in a second step selects variables predicting our independent variables of interest. The second step is necessary to control for the omitted variable bias. Note that selected controls may differ across regressions as we perform the “post-double-selection” for each regression separately. We always include current and expected income. Since we include individual fixed effects in all (LASSO) regressions we expect that most time-invariant household characteristics are controlled for, and only few (if any) additional controls are needed to estimate the impact of inflation expectations on car purchases.Footnote 6
6 Results
For the exposition of the results of our analysis, we proceed in steps. First, we present the results from our baseline analysis in which we are mainly interested in the interaction terms between expected inflation and various balance sheet variables. We present estimates from fixed effects LPM and Logit regressions. In Table 4 results from the Logit regressions are marked as CL in the column title. Lastly, we analyse a subsample of households that have fixed interest rate mortgages.
As we argued in Sect. 3, the different balance sheet components are not expected to moderate the effect of inflation expectations on spending in the same fashion. The main reason are differences in their inflation-hedging potential. Certain assets like stocks or real estate protect the investor better against inflation than cash, for example. Additionally, we expect a difference between assets and liabilities in general. Debt is usually repaid in nominal terms, which makes its expected real value sensitive to expectations about inflation.
6.1 Balance sheet components
Table 4 presents the baseline results. For the regressions results shown in columns one and two, we included all single balance sheet components and their interactions with expected inflation. Collinearity is not an issue since net worth is not included and therefore free to move. The results do not depend much on the specification used, both the linear probability model (LPM) and the conditional logit (CL) give similar results in terms of sign and magnitude of the estimator. All but one balance sheet component do not significantly alter the relationship between inflation expectations and the probability to purchase a vehicle. For the interaction term between financial investments and expected inflation both the LPM and CL estimates are positive, the LPM estimate marginally above the 10% significance threshold, the CL estimate marginally below. The relation between expected inflation and the spending decision seems to be marginally different for households with within-household deviations from their average financial investment holdings compared to those at their average value. Households with higher than average financial investments exhibit a stronger positive reaction of expected inflation on their probability to spend. To quantify this relation, consider a household with inflation expectations 2%-pointsFootnote 7 above their mean: a 10% increase in financial investments increases their predicted purchasing probability by around 3.8%-points. Compare that to a household that is 5%-points above their mean expected inflation: here, a 10% increase in financial investments increases the predicted purchasing probability by almost 10%-points.
Column 2 of Table 4 shows the results of the analogous conditional logit regression to the OLS regression in column 1. The results look qualitatively similar. The only balance sheet item that significantly alters the effect of inflation expectations on spending probabilities are financial investments. The estimated coefficient of 0.0226 corresponds to an odds ratio of roughly 1,023. An odds ratio larger than one means that as the value of the interaction term increases, the odds of having positive vehicle expenditures in a given year rise.Footnote 8
This result is in line with the real interest channel presented in Sect. 3. A falling perceived real interest rate increases incentives to substitute future spending for current spending. Only households with either sufficient collateral or sufficient internal finance are able to act on their increased willingness to spend. However, as the predicted probability plot shows, this moderating effect does not seem to be large enough to affect the outcome in an economically meaningful way.

Plot of the predicted probability of positive vehicle expenditures for households for given percentiles of the net worth distribution (based on estimates of column (5), Table 4)
6.2 Net worth
We continue our analysis by taking a different perspective on the role that individual balance sheet components play. The rationale for analysing components individually is that they differ in terms of their return or real value sensitivity to inflation. At the same time, no component on its own is an appropriate measure of household wealth. Therefore, we now analyse whether net household wealth modifies the relation between expected inflation and the probability to spend. Columns 3 and 4 of Table 4 provide the baseline results of this analysis. We apply the same strategy as above by interacting the expected inflation rate of each household with their net worth to explain the following period’s spending decision. The net worth variable is transformed from levels using the inverse hyperbolic sine transformation that accommodates zero and negative values while mimicking a log-linearisation (see Sect. 4).
In none of the three specifications in which we include net worth (columns 3, 4 and 5 in Table 4, we find strong evidence in favour of a moderating effect of net worth on spending. However, all point estimates are negative and of similar magnitude. This means that for households with a net worth that is below their household specific mean, the predicted probability to spend increases.
A quantification of the fixed effects logit results in the same fashion as previously done for the linear probability model is not possible. Predicted probabilities can only be calculated by setting the fixed effects of all households to a uniform level and assuming different values for the explanatory variables. We want to stress that this is not an innocuous assumption. The reason why we chose to run fixed effects regressions is that we believe there are good reasons why time-invariant household heterogeneity should be controlled for in our analysis. By setting all fixed effects to zero we essentially assume this is not the case. The reason why we present our results in this way nonetheless is to illustrate how the estimated interaction effect would play out absent any other heterogeneity and to quantify our results in a meaningful way. The predicted probabilities are not to be interpreted as such literally. Including fixed effects would certainly alter them. Figure 3 shows the predicted probabilities of positive vehicle expenditures for different values of expected inflation and net worth.Footnote 9 Each panel displays the predicted probability of positive expenditures on the vertical axis and expected inflation on the horizontal axis for values of net worth corresponding to the 50th, 75th, 90th, 95th and 99th percentile of the distribution in 2018.
We can clearly see that at the lower end of the net worth distribution, i.e. households with negative net worth, there is a stark difference in the point estimates of the predicted probability of positive expenditure between low and high levels of expected inflation. The negative point estimates we found are driven by those households at the lower end of the net worth distribution. However, due to its insignificance and the imprecise estimation of the coefficients for expected inflation and net worth, we cannot make strong statements about the robustness of this result. As the figure shows, for households with high expected inflation and low net worth, the 90% confidence interval includes all possible probabilities. Note that unobserved, time-invariant household heterogeneity is not taken into account here. Additionally, the confidence interval becomes very wide for high levels of inflation expectations.
In Column 5 of Table 4 we present the results of a specification in which we include only the two balance sheet measures whose interactions with expected inflation we emphasised above: net worth and financial investments. This exercise supports the findings from above. Financial investments amplify the spending response to expected inflation while net worth has an (insignificant) dampening effect. This shows how the net nominal exposure to inflation (measured by net worth) and balance sheet composition (in this case, financial investments) can alter the spending response. While the former effect would support the relevance of a real wealth channel were it stronger, the latter is in line with the intertemporal substitution channel.

Predicted probability plot: fixed rate mortgages (based on estimates of column (5), Table 5). Percentiles refer to the net worth distribution
6.3 Fixed interest rate mortgage holders
For our research question fixed interest rate mortgage holders are an interesting case. An important part of their expenses is directly tied to the nominal interest rate. In our analysis thus far we have not been able to perfectly control for the nominal interest rate. Time fixed effects take out variation in spending decisions due to movements of the economy-wide nominal interest level. Controlling for net worth can also capture household specific movements in the nominal interest rate by acting as a measure of available collateral or the risk that a household will not be able to service its debt. Especially the latter is an imperfect measure though. The payment of interest on mortgages at fixed rates introduces an insensitivity of a large part of disposable income to business cycles. At the end of 2018 mortgages worth roughly 30 billion € were outstanding in the Netherlands, making up roughly 4% of GDP. Mortgages corresponding to about 83% of the total volume have interest rates that are fixed for more than one year (DNB 2020). With constant real income, changes in inflation expectations therefore have a direct effect on expected real disposable income. If less wealthy households have a higher propensity to consume, those households in our sample that are more financially constrained (i.e. those with a lower net worth) should exhibit a stronger spending response to expected inflation.
We apply this specification to the sub-sample of households with fixed interest rate mortgages. In our sample around 90% of households that report a mortgage as part of their balance sheet have a fixed interest rate mortgage. Unfortunately, the number of households with a variable interest rate mortgage is too low to perform the same analysis. We therefore resort to a sub-sample analysis instead of interacting all variables of interest with the mortgage’s interest rate policy. Table 5 shows the results of this exercise. Apart from interacting the household’s net worth with expected inflation we control for the household’s net income as well as its expected income for the following period. The Lasso post double variable selection procedure did not select any additional control variables. A comparison with the results to those in column 4 of Table 4 reveals that the observed behaviour from the full sample is much stronger in the sub-sample of households with fixed interest rate mortgages. The coefficients on expected inflation, net worth and their interaction are all larger in absolute value and have a p-value below 0.1. Figure 4 shows the predicted probabilities for different values of net worth under the assumption that the fixed effects are equal to zero. (We refer to the previous section for a critical discussion of this assumption.) Absent time-invariant household heterogeneity, the figure visualises the mechanics of the interaction between expected inflation and net worth. Low net worth households with fixed interest rate mortgages react more strongly to higher inflation expectations than those with a higher net worth. This result holds when including an interaction term between expected inflation and the amount of outstanding mortgages the household has in its balance sheet. This interaction term is insignificant and its inclusion barely changes the values of the other coefficients of interest. In column 5 of Table 5 we include net worth and financial investments as balance sheet variables, the two measures that turned out to significantly affect the spending response in the whole sample. Among fixed rate mortgage holders the coefficient on financial investments is roughly the same as before, but not significant anymore. These results show that while individual components of a household’s balance sheet, such as fixed interest mortgages, matter for their consumption decisions the net nominal position determines the strength of this relation.Footnote 10
How can these highly indebted households finance a vehicle purchase? Descriptive statistics can shed some light on this question. First, due to these households’ likely limited access to external finance, we should expect them to buy less expensive vehicles. This is indeed the case: for households with negative net worth, the average purchasing price is only half that of the rest of the sample. Additionally, even though these households are net debtors, over 90% of them have positive cash balances. This suggests that they do have internal finance available to make a car purchase. Another frequently applied method of payment for cars is to include the old car in the payment for the new one, in which case even less cash would be necessary.
As we pointed out in Sect. 4, potential measurement error could be driven by the fact that households incorrectly remember purchasing prices of their cars and change their response to the purchasing price question from one year to the other without actually having purchased a new car. “Appendix A” therefore gives an overview of the results of the preceding sections using a dependent variable that is robust to such small changes in purchasing prices. All results presented above hold when utilising this modified version of the dependent variable.
7 Conclusion
In this paper we provide evidence of a balance sheet channel through which inflation expectations affect durable consumer spending. We use a household survey that contains uniquely detailed balance sheet information as well as a large range of other household characteristics including inflation expectations. We discuss different hypotheses why balance sheets could potentially mediate the spending response to expected inflation. Our results suggest a mediating role of the real wealth channel: the positive response of the probability to spend when inflation expectations increase is stronger for households with lower average net worth. This effect is stronger for households with fixed interest rate mortgages. We relate our findings to the growing literature on the consequences of heterogeneous agents for the transmission of monetary policy, in particular to Cloyne et al. (2020). They show that mortgage holders react particularly strongly to interest rate shocks in their spending choices. We show that a similar pattern is observable for changes in expected inflation.
We find differential effects of inflation expectations across the wealth distribution: households with high amounts of debt and substantially overestimated inflation expectations seem to commit costly mistakes if inflation does not live up to their expectations (which it did not throughout our sample). Here, our study connects well to Vellekoop and Wiederholt (2017). These authors show that households with higher inflation expectations have lower net worth and are less likely to own non-liquid assets, such as bonds, stocks or real estate. The remaining, inflation-sensitive balance sheet components have much higher relative importance than for households with lower inflation expectations. One conclusion for policy is therefore to improve the accuracy of households’ inflation expectations. Recent research has shown that this can be done in two ways. More financially literate individuals tend to be better at forecasting inflation (Bruine de Bruin et al. 2010). At the same time, central banks themselves can contribute to better formation of expectations. Coibion et al. (2019) show that providing survey respondents with details about FOMC meetings—be it only the decision or the entire minutes—substantially improves the accuracy of their inflation forecasts. Better central bank communication could thus play an important role in helping households avoid costly mistakes in their economic decision making.
Availability of data and material
The data are freely available from the sources mentioned in the manuscript.
Notes
Other channels that are not affected by wealth have also been put forward: Wiederholt (2014) suggests that high inflation expectations could be a sign of policy uncertainty and thus depress spending. Cavallo et al. (2017) show that the existence of a relationship between inflation expectations and consumption can be explained by rational inattention: when the benefits of forming accurate expectations outweigh their costs—such as in episodes of high inflation—household spending behaviour is more sensitive to inflation expectations.
This is the case under the assumption that real income stays constant.
In “Appendix A” we show that our results are confirmed when recording purchases only if the purchasing price differs by more than 1000€ between two years. We are therefore confident that our results are not driven by erroneous recollection of purchasing prices.
The peak in 2009 in the extensive margin is due to a car scrapping scheme implemented by the Dutch government as a response to the crisis of 2008. No corresponding peak is observed on the intensive margin. This means households did not buy more expensive cars due to the scrapping scheme, there were simply more households that bought a car in that year. We use year-fixed effects to account for such effects.
This transformation has been widely used in empirical work on household wealth (Burbidge et al. 1988; Pence 2006). For values close to zero, the transformation is approximately linear and resembles a logarithmic shape for larger absolute values: \( x^{ihs}= \log \left( x + \left( x ^ { 2 } + 1 \right) ^ { \frac{ 1 }{ 2 } } \right) \).
Not including fixed effects results indeed in a number of additionally selected controls. Many of the selected covariates are often indeed time-invariant and make intuitive sense, for example “Expected response to credit application”, “Financial literacy”, or “Car provided by employer”.
This corresponds roughly to an increase in inflation expectations of two standard deviations.
One may argue that the significant interaction between financial investment and inflation expectations points to an endogeneity problem. If holders of risky assets would form more accurate expectations about future price level changes, the interpretation of the results above would be altered. To investigate that issue, we compare inflation expectations of households that are holding risky assets with those of households that are not. Year-by-year KS tests show that the distributions of inflation expectations rarely differ between holders of risky assets and the rest of the sample.
The predicted probabilities are obtained in the following way: for all combinations of a given grid of values for expected inflation (1 to 10 in intervals of 1) and the ihs-transformed net worth variable (fixed at the shown percentiles of the net worth distribution in 2018) the plot shows the average predicted probability across the sample (not the predicted probability at the mean of the remaining covariates). Net worth in the regression was measured using positive values only but re-transformed to negative numbers for negative net worth for better readability. Each observation is treated as if the given values in the grids were the observed values for expected inflation and net worth. Then each household’s predicted probability is computed based on the grid values and the remaining observed covariate values. The resulting probability in the graph is the average predicted probability for each combination across households. Additionally, the fixed effect for each household is set to 0.
A similar endogeneity problem as discussed in Sect. 6.1 may bias our results. However, we do not find evidence that fixed interest rate mortgage holders are any better in predicting inflation. Year-by-year KS-tests show that expected inflation does not differ significantly between fixed mortgages holders and the rest of the sample.
References
Anari A, Kolari J (2002) House prices and inflation. Real Estate Econ 30(1):67–84
Auclert A (2019) Monetary policy and the redistribution channel. Am Econ Rev 109(6):2333–67
Bachmann R, Berg TO, Sims ER (2015) Inflation expectations and readiness to spend: cross-sectional evidence. Am Econ J Econ Pol 7(1):1–35
Belloni A, Chernozhukov V, Hansen C (2014a) High-dimensional methods and inference on structural and treatment effects. J Econ Perspect 28(2):29–50
Belloni A, Chernozhukov V, Hansen C (2014b) Inference on treatment effects after selection among high-dimensional controls. Rev Econ Stud 81(2):608–650
Berger D, Vavra J (2015) Consumption dynamics during recessions. Econometrica 83(1):101–154
Bernanke BS (1993) Credit in the Macroeconomy. Q Rev Federal Reserve Bank NY 18:50
Bruine de Bruin W, Van der Klaauw W, Downs JS, Fischhoff B, Topa G, Armantier O (2010) Expectations of inflation: the role of demographic variables, expectation formation, and financial literacy. J Consum Aff 44(2):381–402
Burbidge JB, Magee L, Robb AL (1988) Alternative transformations to handle extreme values of the dependent variable. J Am Stat Assoc 83(401):123–127
Burke MA, Ozdagli A (2013) Household inflation expectations and consumer spending: evidence from panel data. Working papers, Federal Reserve Bank of Boston
Case KE, Quigley JM, Shiller RJ (2005) Comparing wealth effects: the stock market versus the housing market. Adv Macroecon 5(1):1–34
Cavallo A, Cruces G, Perez-Truglia R (2017) Inflation expectations, learning, and supermarket prices: evidence from survey experiments. Am Econ J Macroecon 9(3):1–35
Cloyne J, Ferreira C, Surico P (2020) Monetary policy when households have debt: new evidence on the transmission mechanism. Rev Econ Stud 87(1):102–129
Coibion O, Gorodnichenko Y (2012) What can survey forecasts tell us about information rigidities? J Polit Econ 120(1):116–159
Coibion O, Gorodnichenko Y (2015) Information rigidity and the expectations formation process: a simple framework and new facts. Am Econ Rev 105(8):2644–78
Coibion O, Gorodnichenko Y (2015) Is the Phillips curve alive and well after all? Inflation expectations and the missing disinflation. Am Econ J Macroecon 7(1):197–232
Coibion O, Gorodnichenko Y, Kamdar R (2017) The formation of expectations, inflation and the phillips curve. NBER Working Paper, (No. 23304)
Coibion O, Gorodnichenko Y, Weber M (2019) Monetary policy communications and their effects on household inflation expectations. NBER Working Paper, (No. 25482)
Crump RK, Eusepi S, Tambalotti A, Topa G (2015) Subjective intertemporal substitution. Federal Reserve Bank of New York Staff Reports, Number 734
Cumming F, Hubert P (2019) The role of households’ borrowing constraints in the transmission of monetary policy. Bank of England Staff Working Paper No. 836
D’Acunto F, Hoang D, Weber M (2016) Unconventional Fiscal policy, inflation expectations, and consumption expenditure. SSRN Scholarly Paper ID 2760238, Social Science Research Network, Rochester, NY
Di Maggio M, Kermani A, Keys BJ, Piskorski T, Ramcharan R, Seru A, Yao V (2017) Interest rate pass-through: mortgage rates, household consumption, and voluntary deleveraging. Am Econ Rev 107(11):3550–3588
DNB (2020) Residential Mortgages-Statistics
Duca IA, Kenny G, Reuter A (2018) Inflation expectations, consumption and the lower bound: micro evidence from a large euro area survey. ECB Working Paper Series, No 2196
Fama EF, Schwert GW (1977) Asset returns and inflation. J Financ Econ 5(2):115–146
Hoesli M, Lizieri C, MacGregor B (2008) The inflation hedging characteristics of US and UK investments: a multi-factor error correction approach. J Real Estate Finance Econ 36(2):183–206
Ichiue H, Nishiguchi S (2015) Inflation expectations and consumer spending at the zero bound: micro evidence. Econ Inq 53(2):1086–1107
Kim S, In F (2005) The relationship between stock returns and inflation: new evidence from wavelet analysis. J Empir Financ 12(3):435–444
Liu LQ, Wang L, Wright R (2011) On the “hot potato’’ effect of inflation: Intensive versus extensive margins. Macroecon Dyn 15(S2):191–216
Mian A, Rao K, Sufi A (2013) Household balance sheets, consumption, and the economic slump. Q J Econ 128(4):1687–1726
Pence KM (2006) The role of wealth transformations: an application to estimating the effect of tax incentives on saving. BE J Econ Anal Policy 5(1):1–26
Ravn M, Attanasio O, Larkin K, Padula M (2020) (S) Cars and the great recession. CEPR Discussion Paper (DP15361)
Schotman PC, Schweitzer M (2000) Horizon sensitivity of the inflation hedge of stocks. J Empir Financ 7(3–4):301–315
Vellekoop N, Wiederholt M (2017) Inflation expectations and choices of households. Goethe University Frankfurt mimeo
Wiederholt M (2014) Empirical properties of inflation expectations and the zero lower bound. Goethe University Frankfurt
Funding
No funds, grants, or other support was received by any of the authors for the submitted work.
Author information
Authors and Affiliations
Ethics declarations
Conflict of interest
The authors do not have any conflicts to declare.
Code availability
The code used to conduct the empirical analysis can be provided by the authors upon request.
Additional information
Publisher's Note
Springer Nature remains neutral with regard to jurisdictional claims in published maps and institutional affiliations.
The paper has profited greatly from discussions with Clemens Kool and Tom van Veen, for which we thank them. We thank CentEr Data for making the dataset available to us. We would also like to thank Fiorella De Fiore, Paul Hubert, Narayana Kocherlakota and Wilbert van der Klaauw as well as participants at the GSBE PhD-colloquium at Maastricht University, the Economic Research Seminar at the University of Graz, the 12th International Workshop of Methods in International Finance Network in Louvain-la-Neuve, the 12th International Conference on Computational and Financial Econometrics in Pisa, the Conference of the International Association of Applied Econometrics in Nicosia, the International Panel Data Conference in Vilnius, the Belgian Macroeconomics Workshop in Ghent and the Empirical Monetary Economics Workshop at Sciences Po Paris for helpful comments.
Appendices
Appendices
Appendix A: Measurement of vehicle purchases
We measure vehicle purchases by comparing the survey participants’ responses to questions on the price and build year of their vehicles to the same respondents’ answers from previous years. If the reported purchasing price changes from one year to the next, a purchase is recorded. This comparison could erroneously record a purchase if respondents remember the price incorrectly in one year, but not the next. Therefore, we report the results to all regressions in Sect. 6 replacing the baseline purchasing variable with an alternative variable that is robust to such reporting errors. We exclude any recorded purchases in which the purchasing price differs by 1000 € or less from the price of the previous car. As the observation count in the bottom of the tables show, this reduces the number of households for which we observe years with and without purchases only slightly. At the same time, all effects that we describe in the baseline results remain roughly constant or become somewhat stronger when using the purchasing measure that is robust to small changes.
Rights and permissions
Open Access This article is licensed under a Creative Commons Attribution 4.0 International License, which permits use, sharing, adaptation, distribution and reproduction in any medium or format, as long as you give appropriate credit to the original author(s) and the source, provide a link to the Creative Commons licence, and indicate if changes were made. The images or other third party material in this article are included in the article’s Creative Commons licence, unless indicated otherwise in a credit line to the material. If material is not included in the article’s Creative Commons licence and your intended use is not permitted by statutory regulation or exceeds the permitted use, you will need to obtain permission directly from the copyright holder. To view a copy of this licence, visit http://creativecommons.org/licenses/by/4.0/.
About this article

Cite this article
Lieb, L., Schuffels, J. Inflation expectations and consumer spending: the role of household balance sheets. Empir Econ 63, 2479–2512 (2022). https://doi.org/10.1007/s00181-022-02222-8
Received:
Accepted:
Published:
Issue Date:
DOI: https://doi.org/10.1007/s00181-022-02222-8