
Abstract
The data collected under the European Market Infrastructure Regulation (“EMIR data”) provide authorities with voluminous transaction-by-transaction details on derivatives but their use poses numerous challenges. To overcome one major challenge, this chapter draws from eight different data sources and develops a greedy algorithm to obtain a new counterparty sector classification. We classify counterparties’ sector for 96% of the notional value of outstanding contracts in the euro area derivatives market. Our classification is also detailed, comprehensive, and well suited for the analysis of the derivatives market, which we illustrate in four case studies. Overall, we show that our algorithm can become a key building block for a wide range of research- and policy-oriented studies with EMIR data.
Authors are listed in alphabetic order since their contributions have been equally distributed.
This work was completed while Elisa Letizia was at the European Central Bank.
You have full access to this open access chapter, Download chapter PDF
1 Introduction
During the Pittsburgh Summit in 2009, G20 leaders agreed to reform the derivatives markets to increase transparency, mitigate systemic risk, and limit market abuse [14]. As a result of this internationally coordinated effort, counterparties trading derivatives in 21 jurisdictions are now required to daily report their transactions to trade repositories (TR) [16]. To accomplish the G20’s reform agenda, the EU introduced in 2012 the European Market Infrastructure Regulation (EMIR, hereafter).
However, the use of these data poses numerous challenges, especially when it comes to data aggregation [15, 16]. To enhance data quality and usability, over the past years public institutions and private entities have jointly worked to harmonize critical data fields [27]. The harmonization effort has focused on key variables, one of which is the legal entity identifier (LEI). The LEI uniquely identifies legally distinct entities that engage in financial transactions based on their domicile.Footnote 1 The LEI was introduced in 2012, and currently covers 1.4 million entities in 200 countries. It identifies entities reporting over-the-counter (OTC) derivatives with a coverage close to 100% of the gross notional outstanding, and debt and equity issuers for 78% of the outstanding amount, across all FSB jurisdiction [17]. LEIs are linked to reference data which provide basic information on the legal entity itself, such as the name and address, and its ownership (direct and ultimate parent entities). However, the counterparties’ sector is not included in the reference data. This information is crucial to derive the sectoral risk allocation in this global and diverse market, especially if the aim is to identify potential concentration of risk in specific sectors of the financial system. In EMIR data, even though counterparties are obliged to report their sector using a classification given in the regulation, the available information suffers from several conceptual and data quality limitations. In particular, the sector breakdown is not detailed enough to obtain a comprehensive view of the sectoral allocation of risk. For example, central clearing counterparties (CCPs), which play a key role in the market, are not readily identifiable, as they do not need to report to any sector. To fill this gap, we propose an algorithm to enrich the current classification and uniquely assign a sector to each counterparty trading derivatives, identified by its LEI. We employ a greedy algorithm [7] based on eight different data sources. Firstly we use lists of institutions available from relevant EU public authorities competent for various sectors. Even though comprehensive at EU level, these lists are not sufficient to gain the whole picture because of the global scale of the derivatives market, where many entities outside EU interact with EU investors. Therefore we complement the official lists with sector-specialized commercial data providers. Our work contributes to the existing body of published research dealing with the problem of assigning sectors to individual institutions. In [13] this is done by grouping firms according to their Standard Industrial Classification code in a way to have similar exposure to risk factors within the same group. Despite the popularity of this method in the academic literature, [5] showed that the Global Industry Classifications Standard (GICS) system, jointly developed by Standard & Poor’s and Morgan Stanley Capital International (MSCI), is significantly better at explaining stock return co-movements with respect to [13]. The GICS, however, is not very detailed for the financial sector, so not suitable to fairly describe the derivatives market. More recent works [32] have used deep learning to predict the sector of companiesFootnote 2 from the database of business contacts.
The methodology presented in this chapter has a proven track record, as it has been used by several studies. It has been effectively employed to support analysis in the areas of financial stability [19, 12, 23] and monetary policy [6].
Our approach has three main advantages with respect to existing research: it is comprehensive and detailed, flexible, and helps reproducibility and comparability.
We use a multilayered taxonomy to allow a wide range of applications and granularity. The final classification allows classifying entities trading 96% of notional outstanding in the euro area at the end of 2018Q2 and is tailored for the derivatives market, recognizing entities having crucial roles (like market makers, large dealers, and CCPs).
The algorithm is flexible and can easily accommodate future changes in regulation regarding institutional sectors and can be used in other markets.
Lastly, by choosing to give prominence to publicly available official lists, our method makes the aggregates produced from transactional data comparable with other aggregates published by the same authorities we use as sources. At the same time, the data being public and easily available to any researcher helps produce stable and reproducible results, which is of paramount importance in many policy and research applications. Reproducibility is dependent on the researcher having access to EMIR data, which is currently available to a number of public authorities in the EU. However, the core of the algorithm is based on publicly available data, while commercial data sources can be easily excluded or replaced depending on what is available to the researcher or policy officer. The reproducibility also depends on the fact that the algorithm can be adapted to other datasets of transactional data, such as those collected under SFTR.
To this regard, our methodology contributes to the growing body of research using TR data [1, 29, 20, 15, 6, 10] by providing a stable building block to conduct a wide range of analyses. To show this potential, we present four cases studies where we use our classification on the sample of EMIR data available to the ECB.Footnote 3 In the first case we describe, for the first time to our knowledge, the derivatives portfolios of euro area investment funds, with emphasis on their overall investment strategy. In the second, we disentangle the role of investment and commercial banks in the market. In the third, we measure how large dealers provide liquidity in the Credit Default Swaps (CDS) market. In the last, we show how relying only on the sector reported in EMIR data can lead to a very different picture of the euro area insurance companies activity in the market.
The rest of the chapter is structured as follows: Sect. 2 describes reporting under EMIR, Sect. 3 describes the methodology, Sect. 4 discusses the performance of the algorithm, Sect. 5 includes the four case studies.
2 Reporting Under EMIR
EMIR enabled authorities in the EU to improve their oversight of the derivatives market by requiring European counterparties to report their derivatives transactions to TRs.Footnote 4 The reporting obligation applies to both OTC and exchange-traded derivatives in all five main asset classes, i.e., commodity, equity, foreign exchange, credit and interest rate derivatives.
Since 2014 all EU-located entities that enter a derivatives contract must report the details of the contract, within one day from its execution to one of the TRs authorized by the European Securities and Markets Authority (ESMA).Footnote 5 Each opening of a new contract should be reported by the counterparties to the trade repository as a new entry, and all life-cycle events must be reported as well (modification, early termination, compression, and valuation update of contracts). Intragroup transactions are not exempt from the obligation, and trades with nonfinancial counterparties must be reported alike.Footnote 6
The EU implemented the reform with double reporting, i.e., counterparties of the trade have to be compliant in reporting the details of the transaction to one of the trade repositories active in the jurisdiction.
Daily transaction-by-transaction derivatives data are made available by the TRs to over one hundred authorities in the EU, depending on their mandate and jurisdiction. The ECB has access to trades where at least one of the counterparties is located in the euro area, the reference entity is resident in the euro area, to euro-denominated contracts or when the derivatives contract is written on sovereigns domiciled in the euro area: these trades constitute the sample for the implementation of the algorithm presented in this chapter.
With more than 2000 entities reporting every day roughly 30 million outstanding derivatives contracts, with an overall value of slightly less than €300 trillion, EMIR data can be classified as “big data.” On a daily basis, counterparties report roughly 250 fields, of which 85 are subject to mandatory reporting.Footnote 7 These include information on entities involved in the transactions, the characteristics and terms of the contract, which are static and common across asset classes, and the value of the contract, which may change over the life cycle of a trade.
The regulation requires counterparties to report their own sector choosing from a specific list of codes as reported in EMIR.Footnote 8 For nonfinancial corporations, a single letter distinguishes the sector each firm belongs to, while for others the relevant regulation assigns entities to a specific sector (as shown in Table 1).
The existing reporting requirements present five main drawbacks related either to data quality or to the level of granularity:
-
i.
The sector breakdown is not sufficiently detailed, or at least not for all industries. For example, it distinguishes between Alternative Investment Funds (AIF) and Undertakings for Collective Investments in Transferable Securities (UCITS) in the investment fund sector but does not allow to distinguish between commercial and investment banks.
-
ii.
The granularity for the banking sector is not sufficiently detailed. For example, banks belonging to the G16 group of dealersFootnote 9 and entities acting as clearing membersFootnote 10 cannot be identified through a dedicated field.
-
iii.
Does not recognize Central Clearing Counterparties (CCPs) as a separate sector, even though they play an important role in efficiently reallocating counterparty credit risks and liquidity risks. In recent years, derivatives and repo markets have become heavily reliant on CCPs for the clearing of transactions either on voluntary basis or because traders are obliged to use a CCP to clear their trades. In such cases, CCP interposes itself between the original buyer and seller, acting as the buyer to each seller and the seller to each buyer.
-
iv.
Although the sector definition of each entity is in line with the one provided by either the European System of National and Regional accounts (ESA)Footnote 11 or the European Classification of Economic Activities (NACE),Footnote 12 the classifications do not overlap consistently, making comparisons difficult. For example, nonfinancial corporations are classified using a one-digit NACE, while for other sectors there is no explicit mapping.
-
v.
It happens that the same counterparty reports to belong to different sectors over time even if other data sources do not suggest a material change in its activity.
3 Methodology
To overcome the limitations of the sectors available in EMIR, we define a greedy algorithm in order to uniquely identify to which sector each counterparty belongs to. As shown in Fig. 1 the algorithm comprises three parts:
-
Data collection from several data sources
Fig. 1 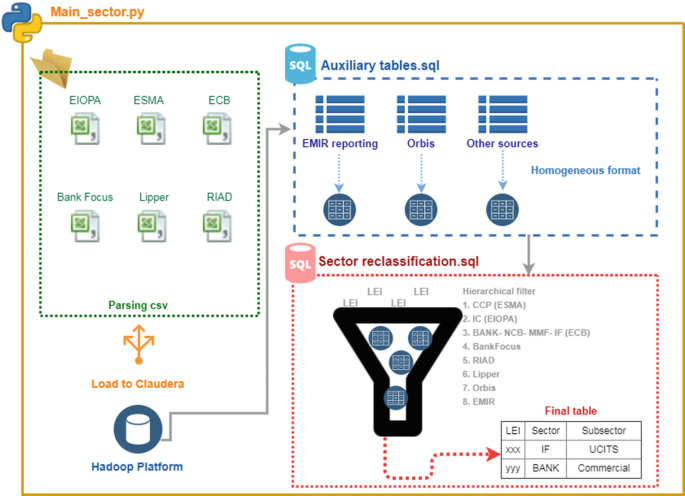
A schematic overview of the algorithm
-
Data harmonization
-
Greedy assignment of a unique sector to each LEI

Our algorithm is greedy as the “local” optimal is determined by looking at a single (ordered) source at the time, without considering whether the same LEI appears in another source later in the hierarchy.
3.1 First Step: The Selection of Data Sources
In the first step we collect information from different data sources using both publicly available official lists and commercial data providers . The choice of sources is crucial, therefore in what follows we explain the reasons for choosing each of them.
As counterparties are identified by LEI in EMIR data, we opt for sources which include this identifier systematically. The final set of sources used is a trade-off between completeness and parsimony: we aim at assigning a sector to as many LEIs as possible, but also keeping a simple and updatable procedure for data collection.
The list of Central Clearing Counterparties (CCP) is published officially by ESMA and includes authorized EU CCPs, recognized third-country CCPs, and CCPs established in non-EEA countries which have applied for recognition.Footnote 13 At the last update in January, July, and September 2019, these lists comprised 17, 34, and 54 CCPs, respectively.
The list of Insurance Undertakings (IC) rely on the public Register provided by the European Insurance and Occupational Pensions Authority (EIOPA).Footnote 14 The Register of Insurance undertakings is a representation of the information provided by the respective National Competent Authorities that are responsible for authorization and/or registration of the reported insurance undertakings activities. It comprises roughly 30,000 institutions operating in the EU, which are either domestic undertakings or EEA/3rd country branches or insurers domiciled in EEA or having branches in the EEA using the internet or other communication tools to sell insurance in the EU under Freedom of Providing Services (FPS).
The ECB publishes the list of monetary financial institutions (MFIs) according to several regulations.Footnote 15 The list is updated on a daily basis and comprises, as of October 2019, 20 NCBs, 4526 credit institutions, 455 MMFs, and 224 other deposit taking corporations.
The ECB also publishes a list of EU investment funds on a quarterly basis.Footnote 16 The list included 63427 institutions as of 2019 Q2 and allows to distinguish between Exchange Trade Funds (ETF), Private Equity Funds (PEF), and Mutual funds; it provides further details in terms of capital variability (open-ended vs. closed mutual funds), UCITS compliance, investment policy (mixed, equity, bond, hedge, real estate), and the legal setup.
Furthermore, we use the Register of Institutions and Affiliated Database (RIAD). RIAD is the European System of Central Banks registry and is compiled by National Central Banks, National Competent Authorities, international organizations, and commercial data providers. RIAD collects information on institutions, financial and nonfinancial companies, including granular relationship data on eight million individual entities. From RIAD we take the information on the ESA 2010 sector code associated with LEIs, as detailed in Table 2.
To facilitate the reproducibility of the final classification, the algorithm would ideally rely only on publicly available lists. However ESMA, ECB, and EIOPA collect information for different purposes and their registers do not cover institutions domiciled outside the EU. For this reason it is crucial to identify entities not operating or domiciled in the EU but trading derivatives referencing euro area underlying and subject to the reporting mandate under EMIR. Consequently, the algorithm enriches the pool of sources using commercial data providers as well . These additional sources are used to classify entities which are not in the public lists.
Data on investment firms and commercial banks are complemented using BankFocus from Moody’s Analytics. These data include information on specialization on more than 138,000 institutions active worldwide (see also Sect. 3.3.1 below).
To enlarge the set of investment funds, asset managers, and pension funds, the algorithm relies also on 768,000 undertakings reported in Lipper Fund Research Data from Refinitiv.
Orbis is used to assign a sector to LEIs not classified using any of the previous publicly and commercial sources, it represents the main database to identify pension funds via NACE codes. Orbis is the most comprehensive database, not being specialized in any particular sector, and provides cross reference for all the industry classification codes (NACE, NAICS, and SIC) for 310 million entitiesFootnote 17 including banks, insurance companies, and non-bank financial institutions covering all countries.
Finally, we rely on the EMIR reported sector for entities not reporting with LEI or not classified using any official or commercial data source.
3.2 Second Step: Data Harmonisation
In the second stage, data from each source is harmonized and made compatible with the EMIR data structure. In the harmonization phase, the algorithm rearranges information from several data providers in a functional way with respect to the final classification. For example, from the ESMA list it treats in the same way euro area CCPs and third-country CCPs with rights to provide their services in the euro area; from the EIOPA list, as well as for other lists, it excludes insurance companies which do not have the LEI. From ECB Investment Fund and Lipper lists, the algorithm makes uniform the breakdowns provided by each source to the ones provided by our classification: e.g., by merging government and corporate fixed income funds from Lipper in one category like “bond-funds,” by merging closed-ended funds and funds with no redemption rights from Lipper in “closed funds” and so on. The algorithm also uniforms the itemization provided by BankFocus in saving, cooperative, and universal banks by creating only one category, like “commercial bank.” For each public and commercial data provider, the algorithm creates a table storing relevant fields in a uniform way.
To extract a stable information from the sector reported in EMIR we proceed as follows. We extract the reported sector from EMIR data, keeping only consistently reported classification. That is, an auxiliary table tracks, for each reporting counterparty, the number of times, starting from November 2017, it declares to belong to one of the six sectors in Table 3.
For each reporting counterparty, the procedure assigns to each LEI the sector corresponding to the mode values, only when no ties occur. For example, if entity i reports to be a credit institution in 500 reports and an insurance company in 499 reports, the procedure assigns to the LEI of entity i the sector “CDTI.”Footnote 18 This step tackles the fifth drawback of the existing reporting requirements presented in Sect. 2, i.e., the same counterparty reporting different sectors. As of 2019Q2, 10.9% of reporting entities reported two sectors, and around 0.3% reported at least three different sectors for the same LEI. In this way, the algorithm cleans the reported sector information, and, hereafter, we refer to the outcome of this procedure as source “EMIR sector.” A description of the algorithm performing this procedure is presented in Sect. 3.4.
3.3 Third Step: The Classification
In the third stage, the final classification is performed in a greedy way: an entity is classified by looking at one source at a time, establishing a hierarchy of importance among sources.
With the exception of Orbis and RIAD, which are useful to classify several sectors, the majority of sources are specialized to classify one sector. Table 4 summarizes the sectors in our classification and its sources in order, reflecting our ranking which prioritizes official lists followed by commercial data providers.
The final classification recognizes ten sectors and includes a more granular subsector, when available (see Table 5). The following sections describe the subsector granularity for banks and investment funds. For the latter we also provide a further set of dedicated dimensions in terms of structure, vehicle, and strategy (see Sect. 3.3.2).
Entities acting as clearing members and banks within the group of G16 dealers are identified by the algorithm with a proper flag.
We complement sector classification with information on geographical dispersion by providing the country of domicileFootnote 19 from GLEIF. In addition to that, we add three dummy variables for entities domiciled in the euro area, in Europe and in the European Economic Area.
For reproducibility purposes, the final table includes a column indicating the source used for the classification. The algorithm is implemented for regular updates and we keep track of historical classification to account for new or inactive players.
Even though our classification shares some features of EU industry classifications (like ESA and NACE which we use as sources), we chose not to rely solely on them to make our classification more tailored to the derivatives market.
On one side, we inherit the concepts of assigning a sector to legally independent entities, and the use of multilayered classification, which allows different levels of detail depending on the analysis to be carried out. On the other side, ESA classification is aimed at describing the whole economies of Member States and the EU in a consistent and statistically comparable way. For this reason ESA classification covers all aspects of the economy, of which the derivatives market is a marginal part. As a result, entities which play key roles in the derivatives market, but not in other segments of the economy, do not necessarily have a dedicated code in ESA. For example, CCPs may be classified under different sectors and not have a specific oneFootnote 20 and the banking sector is all grouped under one category, without clear distinction for dealers. As these two categories are crucial for the market, we provide a clear distinction for them. Similarly, not much granularity is available in ESA and NACE for the investment fund sector, while we provide several dimensions to map this sector which is of growing importance in the derivatives market. Other sectors, like households, nonprofit institutions, government and nonfinancial corporations, play a marginal role in the derivatives market; therefore we do not provide further breakdown, even though they are more prominent in ESA (and NACE). Finally, ESA and NACE only refer to EU domiciled entities, therefore we needed to go beyond their scope because of the global scale of the derivatives market.
3.3.1 Classifying Commercial and Investment Banks
For entities classified as banks, we disentangle those performing commercial banking from those performing investment banking activities. This is important because of the different role they might have in the derivatives market. Due to the exposure of commercial banks towards particular sectors/borrowers via their lending activity, they might need to enter the derivatives market to hedge their position via credit derivatives, to transform their investments or liabilities’ flows from fixed to floating rate or from one currency to another via interest rate or currency swaps respectively. Moreover, commercial banks might use credit derivatives to lower the risk-weighted assets of their exposures for capital reliefs [22, 4, 26]. On the contrary, investment banks typically enter the derivatives market with the role of market makers. Leveraging on their inventories from large turnovers in the derivatives and repo market, their offsetting positions result in a matched book [24]. The distinction between commercial and investment banks is based on two sources: the list of large dealers and BankFocus. The list of large dealers is provided by ESMA and includes roughly one hundred LEIs and BIC codes referring to G16 dealers and institutions belonging to their group. The classification of investment and commercial banks using BankFocus relies on the field specialization. We classify as commercial banks those reporting in the specialization field as commercial banks as well as cooperative, Islamic, savings, and specialized governmental credit institutions. Investment banks includes entities specialized both as investment banks and securities firms.Footnote 21
Combining the two sources above, the algorithm defines firstly as investment banks all entities flagged as G16 dealers in the ESMA list and all banks classified as such from BankFocus, secondly as commercial banks all banks defined as such by BankFocus. As residuals, when LEIs are not filtered in any of the two, entities can still be classified as banks using the ECB official list of Monetary Financial Institutions, RIAD when reported with ESA code S122A, Orbis, or EMIR. In these cases it is not possible to distinguish between commercial and investment banks and we leave the subsector field blank.
3.3.2 Classifying Investment Funds
Since EMIR requires reporting at the fund level and not at the fund manager level, the investment fund sector in EMIR comprises a very high number of entities and it is very heterogeneous. For this reason, we include dedicated dimensions for this sector which allows to better characterize entities broadly classified as investment funds. We focus on three aspects, namely, their compliance to the UCITS and AIFM directives,Footnote 22 their capital variability, their strategy, and the vehicle according to which they run their business in order to define the following dimensions: subsector, structure, vehicle, strategy.
We recognize as subsectors UCITS, AIF, and Asset Managers. We identify Asset Managers when the trade is reported with the LEI of the Asset Manager and not at the fund level, as it should be reported. This might occur when the trade refers to proprietary trading of the asset manager or when the transaction refers to more than one fund. To disentangle UCITS from AIFs,Footnote 23 we rely first on the ECB official list of investment funds which includes a dummy for UCITS compliance and secondly on Lipper, which also has separated fields for funds compliant with one or the other regulation. Both sources assign to each fund the LEI of the fund manager allowing to create a list of asset managers and define the subsector as AM when the trade is reported by the asset manager.
Using the ECB list of investment funds and Lipper, we filter investment funds according to their capital variability.Footnote 24 The algorithm leaves the field blank when the source does not provide information on the structure for a specific mutual fund.
The vehicle defines the legal structure according to which the fund operates. We distinguish exchange trade funds (vehicles in the form of investment funds that usually replicate a benchmark index and whose shares are traded on stock exchanges), private equity funds, and we leave the field blank for all mutual funds.
Strategy defines the investment profile of the fund in terms of asset allocation. Relying on the investment policy reported in ECB’s official list, on the asset type field as well as the corporate and government dummies reported in Lipper, we define the fund investment strategy encompassing bond, real estate, hedge, mixed, and equity. Those investing mainly in corporate and government bonds are identified as bond funds.
3.4 Description of the Algorithm
The classification consists of an SQL-code and it is made up by eight intermediate tables which could be grouped into the stages below:
-
1.
Data preparation. The first five tables aim at defining the sample on which the algorithm will be applied and identifying the most frequently reported sector among those allowed by the Regulation (see Table 6).Footnote 25 The first table creates a list of distinct LEI-sector tuples. In this stage, LEIs which report different sectors over time are included. A mapping from EMIR sector to our classification is done based on Table 3. We count how many times each LEI report belongs to each sector. Each reporting counterparty is then assigned the sector which is reported more often. In case of ties, OFI and NFC are not considered as options. Finally, LEIs only available as other counterparty in trades but not reporting are added to the sample.
Table 6 Sector classification: dedicated dimensions for investment funds -
2.
Data enrichment. The list of distinct LEIs is joined with various sources. In particular, the list is complemented with the NACE, RIAD, or Orbis sectors, and the algorithm adds Boolean flags for CCPs, G16 dealers, IC, banks, and MMF funds if the LEI is classified from an official list and adds other attributes according to each data provider.
-
3.
The third stage creates the final table via a greedy process implemented in SQL through the case condition. Thus, while stage 2 enriches the list of LEIs with information from different data providers, here LEIs pass through a bottleneck for the final classification. Using the enrichment performed in stage 2, this stage scans each LEI and assigns a unique sector according to the first source which includes that LEI, in the order of hierarchy as per Table 4. In practice this means checking each Boolean flag added in the enrichment phase, and have an assignment if one is TRUE. The sources are ordered, so the first TRUE value causes the clause to terminate, without further checks if the LEI exists in other sources, in a greedy approach. If no list includes the LEI, i.e., all Boolean flags are FALSE and additional classification from RIAD, Orbis, and EMIR are empty, it is assigned to the residual class “Other.” For example, to classify an LEI as BANK, the algorithm first looks for that LEI in the ECB list of MFIs, then in the list of G16 dealers, then in RIAD if that LEI is reported with ESA sector “S122A,” then in BankFocus, then in Orbis, and finally in the EMIR reported sector. The same process is used for the identification of the subsector and for the investment funds’ strategy, vehicle, and structure.
4 Results
In this section we test our algorithm on the ECB’s sample of EMIR data, including outstanding contracts as of 2018Q2, and we demonstrate its added value with respect to the EMIR sector classification, both as reported and processed to avoid ambiguous classification.Footnote 26
We first show in Table 7 how our sector classification (rows) compares to the sector reported in EMIR data (columns). To this aim, aggregation is based on the sector of the reporting counterparty.Footnote 27 By increasing the overall granularity from ten to seventeen categories (including subsectors), there is not only a reshuffling among existing categories but also a transition towards other sectors. As expected, the most significant transitions occur towards the sectors of CCP and investment bank, which are known to play a very important role in the market, but do not have a dedicated sector in EMIR classification. 88% of gross notional outstanding which was in the residual group (NULL) is now classified as traded by CCPs.Footnote 28 Furthermore, 69% and 73% of gross notional traded by credit institutions (CDTI) and investment firms (INVF), respectively, is allocated to investment banks according to our classification.
The sectors of insurance companies, pension funds, and nonfinancial corporations are also deeply affected. Forty-four percent (7%) of gross notional allocated to assurance companies (ASSU) are reclassified as investment funds (nonfinancial corporations) once we apply our classification.Footnote 29 Only 62% of gross notional outstanding reported by pension funds under EMIR remains as such, while the remaining 23% of gross notional is found to be traded by insurance companies, investment funds, other financial institutions, or nonfinancial corporations.
Our method shows its value also when compared to EMIR data as source for the sector of both counterparties. In this case, aggregation is based on the two sectors, and in order to assign a sector also to the other counterparty, EMIR data needs to be processed to avoid ambiguity.Footnote 30 Our algorithm reaches a coverage of 96% of notional amount outstanding, for which it successfully classifies both counterparties. For the remaining 4%, entities’ domicile is either located outside EU or not available.Footnote 31 This compares with 80% when using only EMIR data as source, but this figure is inflated by the fact that one CCP is wrongly identified as a credit institution.Footnote 32
On top of the improved coverage, the detailed granularity of our classification enhances the understanding of the market structure (see Fig. 2). It allows to recognize that CCPs and investment banks play a key role in the market, being a counterparty in 76% of outstanding trades in terms of gross notional.

Notional breakdown by sector based on outstanding contracts, 2018Q2. The size of the circles is proportional to the notional amounts. The colors indicate the pair of sectors, e.g., blue indicates trades between CCPs and banks, and when available we present further breakdown by subsector
Specifically, trades between CCP and investment banks represent 32% notional (blue bubble CCP—Investment Bank in Fig. 2), while 14% is interdealer activity (yellow bubble Investment Bank—Investment Bank). Among CCPs, the volume of notional is concentrated in a few large players, with seven players clearing 98% of the market. The largest player covers 60% of the outstanding notional among cleared contracts, the second 15% and the third 14%, each specialized in some segments of the market: interest rate, equity, and credit derivatives, respectively. Some asset classes are characterized by a monopoly-oriented market in the provision of clearing services, where the first player clears more than 50% of cleared contracts in interest rate, commodity, and equity derivatives. While credit and currency derivatives show a sort of duopoly. Finally, two major European CCPs seem to benefit from economies of scope providing clearing services in the commodity and credit derivatives market, and currency and interest rate derivatives market, respectively. For further details on the CCPs’ business model, and their role in the derivatives market after the reforms, see, e.g., [28, 9, 25, 18].
Commercial banks trade mainly with CCPs and investment banks, with notional amounts of similar magnitude (9% each pair). On the other hand investment banks interact with all the other sectors in the market, owing to their market making and dealer activities. Notably, we find that 7% of notional outstanding is represented by trades between investment funds and investment banks (three red-labeled bubbles at the bottom).
When RIAD, and hence ESA classification, is employed instead of the official lists, results for some sectors change considerably. Most notably, 86% of notional allocated to CCPs according to our classification is allocated to OFIs (S125) with ESA classification. Furthermore, 14% of notional allocated to banks in our classification is allocated as OFI (S125), financial auxiliaries (S126), and captive financial institutions (S127), and 1% is not classified at all. Five percent of notional allocated to the insurance sector is not allocated in ESA while 8% is classified as nonfinancial corporations (S11) or pension funds (S129). Finally, using only ESA classification does not allow to classify 15%, 23%, and 22% of entities classified as nonfinancial corporations, OFI, and pension funds, respectively ,according to our classification.
Overall, the results show several advantages of our sector classification with respect to the reported EMIR sector classification. Firstly, it improves the coverage, allowing for a more comprehensive market description. Secondly, it introduces separate categories for key players in the market, CCPs and investment banks, providing a fairer representation of the market. Lastly, its detailed and multilayered granularity allows to better characterize the market structure.
5 Applications
This section presents four case studies that demonstrate our new classification effectiveness and robustness. At the same time, this section shows the potential of our method as a building block for economic and financial econometric research on the derivatives market. For example, it can be used to investigate market microstructure implications and price formation in these markets, to indicate whether a specific sector would bear more information than others or to study the pricing strategies of derivatives market participants aggregated at the sector level. The application of this algorithm could also be used to deepen the research on monetary economics, e.g., by studying trading strategies on underlyings subject to QE with a breakdown by counterparties’ sector. Finally, thanks to the level of automation the algorithm can support a time series setting and can be used to analyze the number of counterparties active in the euro area derivatives market, with a breakdown of the sector they belong to, or in econometric modeling and forecasting.
In some case studies the enhanced granularity provides further insight on the market or on investors’ behavior, in others, the extended coverage allows for more precise assessment of sectoral exposures. Case study I leverages on the dedicated taxonomy for investment funds, to show how their strategy significantly affects their portfolio allocation in the derivatives market; Case study II shows the role of investment and commercial banks in the euro area derivatives market; Case study III focuses on the euro area sovereign CDS market, showing the liquidity provisioning role of G16 dealers in one of the major intermediated OTC markets; Case study IV compares the derivatives portfolio of insurance companies as reported in EMIR to previous published reports.
5.1 Case Study I: Use of Derivatives by EA Investment Funds
In this case study, we present, for the first time to our knowledge, a detailed breakdown of euro area investment funds portfolio composition. Furthermore we take full advantage of the detailed level of information on investment fund strategy to investigate whether some asset classes are more or less used by some investment funds depending on their strategy. Data refers to a snapshot at 2019Q3. We select only funds in ECB’s publicly available list.
Funds can opt for different products in the derivatives market according to their mandate. Like other counterparts, they can use derivatives both for hedging balance sheet exposures or to take position; in the second case they are building the so-called synthetic leverage.
Overall we find 20, 494 funds trading derivatives in the euro area,Footnote 33 of which 61% are UCITS. For 83% of them, we are able to assign a strategy, with a clear abundance of Mixed (33%), Bond (23%), and Equity (20%) funds. They trade a notional amount of €14 tr, of which 59% is traded by UCITS funds. The most commonly used derivatives are currency derivatives (39%) followed by interest rate (37%) and equity (27%).
There is, however, a large heterogeneity in the portfolio composition when grouping funds by their strategy. Figure 3 provides a summary of funds portfolios according to their strategy. Bond funds largely use interest rate derivatives (47% of their portfolio in terms of notional). They are also the largest users of credit derivatives. Equity funds almost exclusively use currency (56%) and equity (41%) derivatives. Hedge and Mixed funds have similar portfolios, with a large share of interest rate (around 40% for each) and currency derivatives (around 28% for each).

Notional breakdown of investment funds derivatives portfolio by asset class of the underlying and strategy of the fund. Data refer to 2019Q3
To assess whether these differences are statistically significant, we perform a multinomial test on the portfolio allocation of the groups of investment funds with the same strategy, using the overall portfolio allocation as the null distribution (see [31] for details on the methodology). The idea is that for every billion of notional, the fund can decide how to allocate across the six asset classes according to its strategy. If the fraction of notional allocated to a certain asset class is greater (smaller) than the percentage in the overall sample, we will say that it is over-(under-)represented.
The significance is assessed by computing the p-value for the observed fraction in each subgroup using as null a multinomial distribution with parameters inferred from the whole sample. To control for the fact that we are performing multiple tests on the same sample, we apply the Bonferroni correction to the threshold values, which we set at 1% and 5%.
We find that the differences in strategy are generally statistically significant. Bond funds use significantly less currency, commodity, and equity derivatives than average, while they use significantly more credit and interest rate. Equity funds use significantly less interest rate derivatives, while they use significantly more equity, and to a lesser extent currency derivatives. Hedge funds use less credit and currency derivatives, while they significantly use all other asset classes. Real estate funds use significantly less credit and equity derivatives than average, while they use significantly more currency derivatives.
For robustness, we repeat the test on the subsamples of UCIT and non-UCIT and we find very similar results. The only discrepancy is in the use of equity and interest rate derivatives by funds with hedge strategy, which are concentrated in UCIT and non-UCIT funds, respectively.
5.2 Case Study II: The Role of Commercial and Investment Banks
As proved by several studies, the participation of the banking sector in the derivatives market is overriding [8, 3, 26, 2, 30, 21]. Banks participate in the derivatives market typically with two roles: (i) as liquidity providers or (ii) as clearing members. In their liquidity provisioning role, a few dealers intermediate large notional amounts acting as potential sellers and buyers to facilitate the conclusion of the contract. Dealers are willing to take the other side of the trade, allowing clients to buy or sell quickly without waiting for an offsetting customer trade. As a consequence, dealers accumulate net exposures, sometimes long and sometimes short, depending on the direction of the imbalances. Thus, their matched book typically results in large gross exposures.
Given their predominance, the aim of this case study is to analyze the participation of commercial and investment banks in the euro area derivatives market (see Fig. 2). EMIR classification (Table 1) mandates counterparties to report their sector as Credit Institutions or Investment firms as defined by the regulation. However, the classification proposed by our algorithm (Table 5) categorizes banks based on their activity and operating perspective. The reason behind this choice refers to the business model and the domicile of banks operating in the euro area derivatives market. The UK, US, Japanese, and Switzerland counterparties are active in the euro area derivatives markets as much as euro area banks are. Due to the different banking models with which they operate in their home jurisdiction this might affect the final classification and, more importantly, the role they play in the market. Using information from several data sources, we define as investment banks those entities performing investment banking activities other than providing credit, while as commercial banks entities which are involved only in the intermediation of credit. Figure 4 shows a comparison between the notional traded by Credit Institutions (CDTI) and Investment Firms (INVF) according to EMIR (LHS) and our classification (RHS). For interest rate derivatives, according to EMIR classification, 68 €trillion is traded by credit institutions and 30 €trillion by investment banks while, applying our classification, these amounts swap. At the same time the breakdown by contract type remains fairly the same across the two groups. The amount traded in currency derivatives by investment banks is the same applying EMIR and our classification, but the breakdown by contract type shows different results: 9% and 52% are the shares of the notional traded in forwards and options according to EMIR reporting which become 79% and 19% according to our classification. For credit and equity derivatives, the gross notional traded by commercial banks double when passing from EMIR to our classification, although the breakdown by contract types remains fairly the same.

Banks classified according to EMIR reporting vs. our reclassification, with a breakdown by asset classes. On top of each bar the gross notional reported at the end of the third quarter 2019
5.3 Case Study III: The Role of G16 Dealers in the EA Sovereign CDS Market
The flag G16 allows to identify entities belonging to the group of G16 dealers. These are investment banks that provide liquidity in the market by buying and selling derivatives on request of the other counterparties. Figure 5 shows the role of these players in the euro area sovereign CDS market as of 2019Q2. The protection traded on euro area government bonds amounts to 600 billion euro in terms of gross notional outstanding. Almost 67% of the gross notional outstanding is traded on Italian government bonds, while the remaining is traded on French, Spanish, German, Portuguese, Irish, Dutch, and Greek government bonds. The position of G16 banks in the market is characterized by a large notional outstanding but a very tiny net notional, because a lot of buying and selling positions offset each other. Although the market making activity implies that the net positions of entities making the market is close to zero, banks may temporarily or persistently have a directional exposure in one market. Hence, the G16 flag helps to identify which institutions are providing liquidity on specific segments, whether they are specialized or operate across several segments, and how long they maintain their positions. If this might seem irrelevant during calm periods, it might have financial stability implications when liquidity in the derivatives market dries up.

Net notional exposure on EA sovereign bonds. (a) Country level. (b) Solo level
Figure 5 shows G16 net exposures in sovereign CDS aggregated at country level (left) and at solo level (right). Overall, UK dealers have the largest net exposures in the euro area sovereign CDS market. G16 domiciled in the UK and US do not have a homogeneous exposure on EA countries: net buying positions result in net buying/selling when passing from exposures aggregated at country level to exposures at solo level. On the contrary, G16 banks domiciled in France or Germany have a directional exposure as net sellers at country level, which is reflected when banks’ positions are shown at solo level.
5.4 Case Study IV: The Use of Derivatives by EA Insurance Companies
In this application we show how our classification significantly improves assessing euro area insurance companies derivatives portfolio.
In [12], the authors presented the first evidence of insurance companies activity in the market, by employing our proposed classification. The authors considered as insurers only those companies listed in the publicly available register of insurance undertaking companies published by EIOPA. They could easily select those companies from our sector classification, owing to the dedicated column which indicates the data source. The choice to disregard other sources was linked to the intent to make results comparable to those published by EIOPA.Footnote 34
To assess the quality of our classification, we compute the same statistics as presented in [12] but using a sample filtered by the categories INSU, ASSU, or REIN as reported in EMIR data (see again Table 1).
Using only reported information, the total notional outstanding for the insurance sector amounts to €784bn, e.g., 51% of the gross notional of €1.3tr presented in [12], and considerably lower than the figures published by EIOPA.Footnote 35 The reason for this discrepancy is largely due to several trades that are reported only by the other counterparty in the contract, represented as null (in blue) in Fig. 6. To this extent, our classification efficiently exploits the double reporting implementation of EMIR.Footnote 36 For those with a misreported sector, a significant share identify themselves as investment firms (23% of misclassified notional) or in the residual class Other (10% of misclassified notional).

Percentage of notional associated with LEIs in the EIOPA list allocated to each reported sector in the case it differs from INUN, ASSU, or REIN. Class Null includes trades for which the reporting is one sided from the noninsurance counterparts.
Notes
- 1.
The LEI is a 20-digit alpha-numeric code based on ISO standards provided by the Global Legal Entity Identifier Foundation (GLEIF). It excludes natural persons, but includes governmental organizations and supranationals.
- 2.
More specifically the North American Industry Classification System code.
- 3.
This includes trades where at least one counterparty is domiciled in the euro area, or the reference entity is in the euro area.
- 4.
The reporting obligation extends to non-European counterparties when the reference entity of the contract is resident in the EU and when they trade CDS written on EU-domiciled sovereigns.
- 5.
Currently there are seven TRs authorized by ESMA in the EU.
- 6.
Only individuals not carrying out an economic activity are exempt from the reporting obligation.
- 7.
All fields included in the Annex of the Commission Delegated Regulation (EU) No 148/2013 are subject to mandatory reporting, except those not relevant for the specific asset class.
- 8.
Commission Implementing Regulation (EU) 2017/105 of October 19, 2016, amending Implementing Regulation (EU) No 1247/2012 laying down implementing technical standards with regard to the format and frequency of trade reports to trade repositories according to Regulation (EU) No 648/2012 of the European Parliament and of the Council on OTC derivatives, central counterparties, and trade repositories.
- 9.
G16 dealers are defined as such by NY Fed as the group of banks which originally acted as primary dealers in the US Treasury bond market but nowadays happens to be also the group of largest derivatives dealers. The sample, which has world coverage, changed over time, and originally comprised: Bank of America, Barclays, BNP Paribas, Citigroup, Crédit Agricole, Credit Suisse, Deutsche Bank, Goldman Sachs, HSBC, JPMorgan Chase, Morgan Stanley, Nomura, Royal Bank of Scotland, Société Générale, UBS, and Wells Fargo. In 2019, the list is made up of 24 entities and is available at https://www.newyorkfed.org/markets/primarydealers.
- 10.
All G16 dealers are usually member of one or more CCPs with the role of clearing members. Only clearing members can clear trades on behalf of their clients.
- 11.
For details on the ESA, see https://ec.europa.eu/eurostat/cache/metadata/Annexes/nasa_10_f_ esms_an1.pdf.
- 12.
For details on NACE, see https://ec.europa.eu/eurostat/documents/3859598/5902521/KS-RA- 07-015-EN.PDF.
- 13.
The list is disclosed in accordance with Article 88 of EMIR and is updated on a nonregular frequency, when changes occur. Furthermore, under Article 25 of EMIR, non-EEA CCPs have to expressly agreed to have their name mentioned publicly; therefore the list is not necessarily exhaustive for this category. For the latest update see https://www.esma.europa.eu/sites/default/files/library/ccps_authorised_under_emir.pdf.
- 14.
In accordance with Article 8 of EIOPA Regulation (Regulation EU No 1094/2010). For the latest update see https://register.eiopa.europa.eu/registers/register-of-insurance-undertakings.
- 15.
Regulation ECB/2013/33 as resident undertakings belonging to central banks (NCB), credit institutions according to Art. 4 575/2013 (BANK), and other resident financial institutions whose business is to receive deposits or close substitutes for deposits from institutional units, to grant credit, and/or to make investments in securities for their own account, electronic money institutions (Art.2 2009/110/EC), and money market funds (MMF). For the latest update see https://www.ecb.europa.eu/stats/financial_corporations/list_of_financial_institutions/html/index.en.html.
- 16.
Under Regulation EC No 1073/2013 concerning statistics on the assets and liabilities of investment funds (ECB/2013/38), collects information on investment fund undertakings (IF) to provide a comprehensive picture of the financial activities of the sector and to ensure that the statistical reporting population is complete and homogeneous. For the latest update see https:// www.ecb.europa.eu/stats/financial_corporations/list_of_financial_institutions/html/index.en.html.
- 17.
Only 1.3 million entities have LEIs.
- 18.
We exclude entities reporting with sector “OTHR.”
- 19.
ISO 3166 country code.
- 20.
Some CCPs are classified in ESA with the code S125, which includes also other types of institutions, e.g., financial vehicle corporations. Others, with a banking license, have as ESA sector S122.
- 21.
When preparing the reference data from BankFocus the algorithm disregards some specializations. They are: bank holding companies, clearing institutions, group finance companies, multilateral government bank, other non-banking credit institutions, real estate, group finance company, private banking, and microfinancing institutions.
- 22.
Alternative investment fund—AIFD—are authorized or registered in accordance with Directive 2011/61/EU while UCITS and its management company—UCIT—are authorized in accordance with Directive 2009/65/EC.
- 23.
UCITS-compliant funds are open-ended European and non-EU funds compliant with the EU regulation which raise capital freely between European Union members. Alternative investment funds (AIF) are funds that are not regulated at EU level by the UCITS directive. The directive on AIF applies to (i) EU AIFMs which manage one or more AIFs irrespective of whether such AIFs are EU AIFs or non-EU AIFs; (ii) non-EU AIFMs which manage one or more EU AIFs; (iii) and non-EU AIFMs which market one or more AIFs in the Union irrespective of whether such AIFs are EU AIFs or non-EU AIFs.
- 24.
We define as closed-ended those non-MMMFs which do not allow investors to redeem their shares in any moment or which can suspend the issue of their shares, while as open-ended all funds which allow investors ongoing withdrawals and can issue an unlimited number of shares.
- 25.
For each trade, EMIR prescribes that the reporting counterparty report only its sector and not the sector of the other counterparty involved in the trade.
- 26.
See Sect. 3 for details on how we process the sector reported in EMIR data to avoid ambiguous cases.
- 27.
As mentioned in Sect. 2 this is the only information mandated to be reported.
- 28.
The remaining part of the residual group is traded by banks (4%), nonfinancial corporations (3%), other financial institutions (2%), and governments or alternative investment funds (1% each).
- 29.
A similar finding applies to insurance companies (INUN) where 10% of gross notional outstanding refers either to investment funds, pension funds, or nonfinancial corporations, and reinsurance companies where 4% refers to investment funds or nonfinancial corporations.
- 30.
See footnote 28.
- 31.
The fact that there is no domicile is indication of missing or misreported LEI.
- 32.
Since CCPs do not report any sector according to the regulation, a single mis-reported trade alters greatly the final classification. Some euro area CCPs have a banking license to facilitate their role in the market, but they cannot provide credit and are exempted from some capital requirements.
- 33.
They represent 35% of active EA funds.
- 34.
EIOPA has access to the central repository of the quantitative reporting under Solvency II. The data collection includes a template on derivatives positions, see, e.g., [11]
- 35.
- 36.
As mentioned in Sect. 2, EMIR is implemented with double reporting. This means that the ECB sample should include two reports for any trade between euro area counterparties, each declaring its own sector. If this is not the case, the information on the sector of the entity failing to report is lost, and therefore the sector aggregates based only on the sector reported in EMIR may not be accurate.
References
Abad, J., Aldasoro, I., Aymanns, C., D’Errico, M., Rousová, L., Hoffmann, P., Langfield, S., Neychev, M., & Roukny, T. (2016). Shedding light on dark markets: First insights from the new EU-wide OTC derivatives dataset. Technical report, ESRB Occasional Paper Series 11. European Systemic Risk Board. https://www.esrb.europa.eu/pub/pdf/occasional/20160922_occasional_paper_11.en.pdf.
Adkins, L. C., Carter, D. A., & Simpson, W. G. (2007). Managerial incentives and the use of foreign-exchange derivatives by banks. Journal of Financial Research, 30(3), 399–413.
Akhigbe, A., Makar, S., Wang, L., & Whyte, A. M. (2018). Interest rate derivatives use in banking: Market pricing implications of cash flow hedges. Journal of Banking & Finance, 86, 113–126.
Ashraf, D., Altunbas, Y., & Goddard, J. (2007). Who transfers credit risk? Determinants of the use of credit derivatives by large US banks. The European Journal of Finance, 13(5), 483–500.
Bhojraj, S., Lee, C. M. C., & Oler, D. K. (2003). What’s my line? A comparison of industry classification schemes for capital market research. Journal of Accounting Research, 41(5), 745–774. https://doi.org/10.1046/j.1475-679X.2003.00122.x.
Boninghausen, B., Boneva, L., Fache Rousová, L., & Letizia, E. (2019). Derivatives transactions data and their use in central bank analysis. ECB Economic Bulletin, 6. https://www.ecb.europa.eu/pub/economic-bulletin/articles/2019/html/ecb.ebart201906_01~dd0cd7f942.en.html.
Cormen, T. H., Leiserson, C. E., Rivest, R. L., & Stein, C. (2009). Introduction to algorithms. Cambridge, MA: MIT Press.
Duffee, G. R., & Zhou, C.: Credit derivatives in banking: Useful tools for managing risk? Journal of Monetary Economics, 48(1), 25–54 (2001).
Duffie, D., & Zhu, H.: Does a central clearing counterparty reduce counterparty risk? The Review of Asset Pricing Studies, 1(1), 74–95 (2011).
Duffie, D., Scheicher, M., & Vuillemey, G.: Central clearing and collateral demand. Journal of Financial Economics, 116(2), 237–256 (2015).
EIOPA: EIOPA Financial Stability Report June 2018 (2018). https://www.eiopa.europa.eu/content/financial-stability-report-june-2018_en.
Fache Rousová, L., & Letizia, E. (2018). Insurance companies and derivatives exposures: Evidence from EMIR data. In ECB Financial Stability Review—Box 8. https://www.ecb.europa.eu/pub/pdf/fsr/ecb.fsr201811.en.pdf.
Fama, E. F., & French, K. R. (1997). Industry costs of equity. Journal of Financial Economics, 43(2), 153–193. https://doi.org/10.1016/S0304-405X(96)00896-3.
Financial Stability Board (2010). Implementing OTC derivatives market reforms. In Financial Stability Board Report. https://www.fsb.org/wp-content/uploads/r_101025.pdf.
Financial Stability Board (2017). Review of OTC derivatives market reforms: Effectiveness and broader effects of the reforms. In Financial Stability Board Report. https://www.fsb.org/wp-content/uploads/P290617-1.pdf.
Financial Stability Board (2019). OTC derivatives market reforms thirteenth: Progress report on implementation. In Financial Stability Board Report. https://www.fsb.org/wp-content/uploads/P151019.pdf.
Financial Stability Board (2019). Thematic review on implementation of the legal entity identifier. Financial Stability Board Report. https://www.fsb.org/wp-content/uploads/P280519-2.pdf.
Ghamami, S., & Glasserman, P. (2017). Does OTC derivatives reform incentivize central clearing? Journal of Financial Intermediation, 32, 76–87.
Guagliano, C., Lenoci, F., Mazzacurati, J., & Weistroffer, C. (2019). Use of CDS by non-bank financial institutions in the EU. In Financial Stability Board (FSB) Global Monitoring Report on Non-Bank Financial Intermediation (2018). https://www.fsb.org/wp-content/uploads/P040219.pdf.
Hau, H., Hoffmann, P., Langfield, S., & Timmer, M. Y. (2019). Discriminatory pricing of over-the-counter derivatives. In International Monetary Fund Working Paper, No. 19/100. https://www.imf.org/-/media/Files/Publications/WP/2019/WPIEA2019100.ashx.
Hirtle, B.: Credit derivatives and bank credit supply. Journal of Financial Intermediation, 18(2), 125–150 (2009).
Jones, D. (2000). Emerging problems with the Basel Capital Accord: Regulatory capital arbitrage and related issues. Journal of Banking & Finance, 24(1–2), 35–58.
Jukonis, A., Cominetta, M., & Grill, M. (2019). Investigating initial margin procyclicality and corrective, tools using EMIR data. ECB Macroprudential Bulletin, 9. https://econpapers.repec.org/scripts/redir.pf?u=https%3A%2F%2Fwww.ecb.europa.eu%2F%2Fpub%2Ffinancial-stability%2Fmacroprudential-bulletin%2Fhtml%2Fecb.mpbu201910_5~6c579ba94e.en.html;h=repec:ecb:ecbmbu:2019:0009:5.
Kirk, A., McAndrews, J., Sastry, P., & Weed, P. (2014). Matching collateral supply and financing demands in dealer banks. In Federal Reserve Bank of New York, Economic Policy Review (pp. 127–151). https://www.newyorkfed.org/medialibrary/media/research/epr/2014/1412kirk.pdf.
Loon, Y. C., & Zhong, Z. K. (2014). The impact of central clearing on counterparty risk, liquidity, and trading: Evidence from the credit default swap market. Journal of Financial Economics, 112(1), 91–115.
Minton, B. A., Stulz, R., & Williamson, R. (2009). How much do banks use credit derivatives to hedge loans?. Journal of Financial Services Research, 35(1), 1–31.
OICV-IOSCO (2012). Report on OTC derivatives data reporting and aggregation requirements. In Committee on Payment and Settlement Systems and Technical Committee of the International Organization of Securities Commissions. https://www.iosco.org/library/pubdocs/pdf/IOSCOPD366.pdf.
Pirrong, C. (2011). The economics of central clearing: Theory and practice. In ISDA Discussion Papers, number 1-May-2011. https://www.isda.org/a/yiEDE/isdadiscussion-ccp-pirrong.pdf.
Rosati, S., & Vacirca, F. (2019). Interdependencies in the euro area derivatives clearing network: A multilayer network approach. Journal of Network Theory in Finance, 5(2). https://doi.org/10.21314/JNTF.2019.051.
Sinkey Jr, J. F., & Carter, D. A. (2000). Evidence on the financial characteristics of banks that do and do not use derivatives. The Quarterly Review of Economics and Finance, 40(4), 431–449.
Tumminello, M., Miccichè, S., Lillo, F., Varho, J., Piilo, J., & Mantegna, R. N. (2011). Community characterization of heterogeneous complex systems. Journal of Statistical Mechanics: Theory and Experiment, 2011(01), P01019.
Wood, S., Muthyala, R., Jin, Y., Qin, Y., Rukadikar, N., Rai, A., & Gao, H. (2017). Automated industry classification with deep learning. In Proceedings of the 2017 IEEE International Conference on Big Data (Big Data) (pp. 122–129). https://doi.org/10.1109/BigData.2017.8257920.
Acknowledgements
This chapter should not be reported as representing the views of the European Central Bank (ECB) or the Single Resolution Board (SRB). The views expressed are those of the authors and do not necessarily reflect those of the European Central Bank, the Single Resolution Board, or the Eurosystem. We are kindly grateful for comments and suggestions received by Linda Fache Rousová. We also thank P. Antilici, A. Kharos, G. Nicoletti, G. Skrzypczynski, C. Weistroffer, and participants at the ESRB EMIR Data Workshop (Frankfurt, December 2018), at the ESCoE Conference on Economic Measurement (London, May 2019), and at the European Commission/Joint Research Centre Workshop on Big Data (Ispra, May 2019).
Author information
Authors and Affiliations
Corresponding author
Editor information
Editors and Affiliations
Rights and permissions
Open Access This chapter is licensed under the terms of the Creative Commons Attribution 4.0 International License (http://creativecommons.org/licenses/by/4.0/), which permits use, sharing, adaptation, distribution and reproduction in any medium or format, as long as you give appropriate credit to the original author(s) and the source, provide a link to the Creative Commons license and indicate if changes were made.
The images or other third party material in this chapter are included in the chapter's Creative Commons license, unless indicated otherwise in a credit line to the material. If material is not included in the chapter's Creative Commons license and your intended use is not permitted by statutory regulation or exceeds the permitted use, you will need to obtain permission directly from the copyright holder.
Copyright information
© 2021 The Author(s)
About this chapter

Cite this chapter
Lenoci, F.D., Letizia, E. (2021). Classifying Counterparty Sector in EMIR Data. In: Consoli, S., Reforgiato Recupero, D., Saisana, M. (eds) Data Science for Economics and Finance. Springer, Cham. https://doi.org/10.1007/978-3-030-66891-4_6
Download citation
DOI: https://doi.org/10.1007/978-3-030-66891-4_6
Published:
Publisher Name: Springer, Cham
Print ISBN: 978-3-030-66890-7
Online ISBN: 978-3-030-66891-4
eBook Packages: Computer ScienceComputer Science (R0)