
Abstract
Cell-free production is a valuable and alternative method for the synthesis of membrane proteins. This system offers openness allowing the researchers to modify the reaction conditions without any boundaries. Additionally, the cell-free reactions are scalable from 20 μL up to several mL, faster and suitable for the high-throughput protein production. Here, we present two cell-free systems derived from Escherichia coli (E. coli) and Spodoptera frugiperda (Sf21) lysates. In the case of the E. coli cell-free system, nanodiscs are used for the solubilization and purification of membrane proteins. In the case of the Sf21 system, endogenous microsomes with an active translocon complex are present within the lysates which facilitate the incorporation of the bacterial potassium channel KcsA within the microsomal membranes. Following cell-free synthesis, these microsomes are directly used for the functional analysis of membrane proteins.
The original version of this protocol was revised. An erratum to this protocol can be found at DOI 10.1007/978-1-4939-7366-8_21
You have full access to this open access chapter, Download protocol PDF
Key words
1 Introduction
Membrane proteins (MPs) represent one third of the total proteins encoded by the human genome. These include receptors, ion channels , transporters, and porins. They play an important role in a wide range of biological processes like cell-to-cell communication, extracellular and intracellular ligand recognition, signal transduction, ion-channel conductance, and transport of a range of substrates across the membranes which are vital for survival of any organism. Any functional defect in the MPs could affect the cellular activities which could often lead to a wide range of diseases like Alzheimer’s disease, cystic fibrosis, epilepsy, cardia arrhythmia, and migraine [1,2,3]. Due to their medical importance, MPs have become more than 50% of the total drug targets from pharmaceutical companies. However, despite their significance in cellular physiology, complete structural information is only known for a small percentage of MPs. This is due to the lack of methods to synthesize high quality MPs essential for structural and functional analysis. Functional synthesis of MPs in vivo is challenging due to low yields, solubilization and purification problems, and overexpression often leads to toxicity. Having a flexible approach and faster synthesis method are crucial for synthesizing a wide range of high quality MPs which might help the researchers and drug companies to develop functional assays and to design new therapeutics. For more detailed understanding of the protein function, one needs to have an open isolated system where one can vary the parameters regulating the protein expression systematically. Cell-free system offers all the conveniences required for proper synthesis of MPs. This method offers a high degree of controllability and provides a completely open system allowing direct manipulation of the reaction conditions to optimize protein folding, disulfide bond formation, incorporation of noncanonical amino acids and the synthesis of toxic proteins [4,5,6,7,8,9]. In comparison to conventional cell-based systems , cell-free systems offer rapid protein synthesis, purification and functional analysis. One of the most widely used cell-free systems is based on E. coli extracts. This system is widely used for synthesis of MPs in the presence of membrane solubilization supplements in the form of nanodiscs , detergents, proteoliposomes etc. added externally into the cell-free reaction [5, 10]. Nanodiscs are synthetic discoidal nanoparticles consisting of a phospholipid bilayer surrounded by two copies of membrane scaffold proteins (MSPs). MSPs are modified apolipoproteins consisting of a hydrophobic part toward the lipid bilayer and a hydrophilic part outside thus providing stability to the nanodiscs and make them soluble without any detergents [8]. These nanoparticles can be added directly into the cell-free reaction system. Another existing cell-free system derived from insect (Spodoptera frugiperda Sf21) extracts is also used for synthesizing MPs. This eukaryotic cell-free system offers additional advantages in the form of native, ER-derived endogenous microsomes. Such microsomes contain the entire translocon machinery responsible for proper folding of MPs [8,9,10,11,12,13]. Recently, the potassium channel KcsA was synthesized successfully in this system [13]. The synthesized MP showed tetrameric configuration and exhibited single-channel activity characteristic to the protein.
In this chapter, we will present a general method for measuring the functionality of MPs derived from E. coli and insect-based cell-free systems. The expression and analysis will be shown exemplary with the proteins bacteriorhodopsin (BR) and mannitol permease (MtlA) using the E. coli cell-free system (Subheading 3.2), whereas the insect cell-free system will be used to produce the potassium channel protein KcsA (Subheading 3.3). We recommend using these proteins as positive controls when establishing the described protocols for your proteins of interest. The methodology we present here is also suitable for functional analysis of MPs synthesized by additional cell-free systems not discussed in this chapter. The main objective of this chapter is to propose two simple methods for the functional analysis of MPs derived from cell-free systems. These protocols can also be applied for screening protein variants.
2 Materials
2.1 Preparation of Nanodiscs
-
1.
Membrane scaffold protein (MSP) (MSP1D1) (Sigma-Aldrich).
-
2.
Dimyristoyl phosphatidylcholine (DMPC) (Avanti Polar Lipids).
-
3.
1,2-dioleoyl-3-trimethylammonium-propane (DOTAP).
-
4.
1,2-dioleoyl-sn-glycero-3-phospho-(1′-rac-glycerol) (DOPG).
-
5.
Biobeads SM-2 (Bio-Rad).
-
6.
Purified water (Milli-Q system).
-
7.
Cholate buffer: 100 mM sodium cholate, 20 mM Tris, 100 mM NaCl, pH 7.4.
2.2 Prokaryotic Cell-Free Synthesis
-
1.
E. coli lysate and reaction buffer (EasyXpress E. coli kit, BR1402001) (Biotechrabbit GmbH, Germany).
-
2.
14C-labeled leucine (PerkinElmer) (100 dpm/pmol).
-
3.
Genes encoding proteins bacteriorhodopsin (BR) and mannitol permease (MtlA) cloned in the pIX3.0 plasmid (100 nM stock solutions).
-
4.
Ni-NTA magnetic beads (Qiagen).
2.3 Synthesis of MPs in the Insect Cell-Free System
-
1.
Transcription reaction mixture containing 80 mM HEPES–KOH buffer, pH 7.6, 15 mM MgCl2, 3.75 mM NTPs, 0.5 mM m7G(5′)ppp(5′)G-CAP analog, and 1 U/μL T7 RNA polymerase.
-
2.
DyeEx spin columns (Qiagen).
-
3.
Insect (Spodoptera frugiperda Sf21) lysates used for the cell-free reaction have to be prepared as described [5,6,7] (see Note 1 ).
-
4.
Translation mixture containing 25% (v/v) Sf21 lysate, 30 mM HEPES–KOH, pH 7.6, 2.5 mM Mg(OAc)2, 75 mM KOAc, 0.25 mM spermidine, 200 μM amino acids and energy regeneration components 20 mM creatine phosphate, 1.75 mM ATP, and 0.45 mM GTP.
-
5.
Genes encoding the protein KcsA cloned in the pIX3.0 plasmid.
2.4 Preparation of Proteoliposomes and Lipid Bilayers
-
1.
2.5 mM Puromycin (Sigma-Aldrich) dissolved in 500 mM KCl.
-
2.
1,2-diphytanoyl-sn-glycero-3-phosphocholine (DPhPC) (Avanti Polar Lipids).
-
3.
Octane.
-
4.
Multi electrode cavity arrays (MECA) chips (Nanion GmbH, Germany).
-
5.
0.1 M phosphate buffered saline (PBS) pH 7.0.
2.5 Analysis of Synthesized Proteins
-
1.
Trichloroacetic acid.
-
2.
Filter paper (MN GF-3, Macherey-Nagel).
-
3.
Scintillation tubes (Zinsser Analytic).
-
4.
Scintillation cocktail (Quicksafe A, Zinsser Analytic).
-
5.
NuPAGE® LDS Sample Buffer (Invitrogen).
-
6.
Precast SDS-PAGE gels (NuPAGE 10% Bis–Tris Gel with MES SDS buffer) (Invitrogen).
2.6 Instrumentation and Software
-
1.
Thermomixer comfort.
-
2.
NanoDrop 2000c.
-
3.
Vacuum filtration system.
-
4.
Orbital shaker.
-
5.
Unigeldryer.
-
6.
Size measurements are done by using dynamic light scattering measurements, e.g., using the Zetasizer Nano ZS instrument (Malvern, UK).
-
7.
The functionality of MPs is analyzed with the Port-a-Patch system using borosilicate glass chips with an aperture diameter of approximately 1 μm and chip-based, parallel bilayer recording setup Orbit 16 System (Nanion Technologies GmbH, Munich, Germany) with multi-electrode-cavity -array (MECA) chips (Ionera Technologies). This also requires a single channel amplifier (EPC-10, HEKA Electronic Dr. Schulze GmbH, Lambrecht, Germany) and the data acquisition software Patchmaster (HEKA).
-
8.
Electrophysiology recordings are analyzed by Clampfit 10.7 software (Molecular devices, Sunnyvale, California, USA).
-
9.
For quality control of the synthesized proteins, typical radionucleotide laboratory equipment is required, including for example a LS6500 Multi-Purpose scintillation counter (Beckman Coulter) and a phosphorimager system (Typhoon TRIO + Imager, GE Healthcare).
3 Methods
3.1 Preparation of Nanodiscs (NDs)
-
1.
First prepare 5 mg/mL of MSP protein solution (200 μM) containing 20 mM Tris, pH 7.4, with 0.1 M NaCl and 0.5 mM EDTA.
-
2.
Dissolve DMPC, DOTAP and DOPG lipids in cholate buffer at a concentration of 15 mM (see Note 2 ).
-
3.
Set up the reactions: mix the lipid solutions (see Notes 3 and 4 ) with MSP as indicated in Table 1.
-
4.
Incubate the reactions at 25 °C for 30 min. Then, biobeads SM-2 are added almost to 80 vol % of the Lipid-MSP mixtures and left to react at 25 °C for 45 min and then centrifuged at 1000 × g for 1 min. Remove the upper supernatants.
-
5.
For each reaction , add a second set of 80 vol % biobeads-SM2 and incubate for 15 min. After centrifugation at 1000 × g for 1 min at RT, recollect the top solution. The finally recovered solution is further centrifuged at 5000 × g for 5 min and just the top solution (leaving the lower 5 μL volume) is recollected and analyzed by zetasizer.
-
6.
Place 20 μL of the recovered solution in a zeta sizer cuvette and measure the size intensity of the particles present in the solution. Figure 1 shows an exemplary measurement: the presence of a strong peak with maximum intensity at around 11.5 nm indicates the presence of NDs.
Table 1 Pipetting scheme for reaction setup of NDs Fig. 1 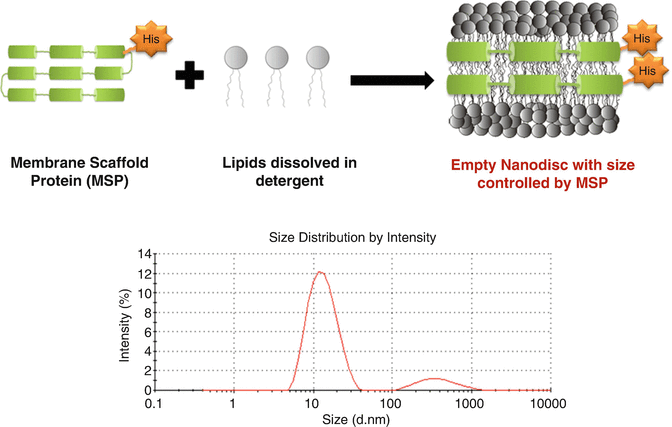
Scheme depicting the preparation of NDs by detergent based reconstitution. Zetasizer measurements showing the presence of a single significant peak at around 11.5 nm indicating the presence of nanodiscs

3.2 Membrane Protein Synthesis in Prokaryotic Cell-Free Systems
-
1.
BR and MtlA proteins are synthesized in cell-free systems using E. coli lysates. A typical 50 μL standard reaction comprises 35% (v/v) E. coli lysate containing T7 RNA-polymerase, 40% reaction buffer containing the complete amino acid mix (1.2 mM each), 25 × XE-solution (EasyXpress E. coli kit), 1 μL of the respective plasmid (0.75 μg/mL) and 14C-labeled leucine, final concentration: 50 μM; 4 DPM/pmol) (see Note 5 ), and 10% (v/v) of the prepared ND . Set up the following reactions and controls (without NDs) (Table 2).
-
2.
Perform the protein synthesis in a thermomixer with shaking at 500 rpm and 37 °C for 90 min.
-
3.
Once the reaction is completed, all the qualitative and quantitative measurements are done by SDS-PAGE combined with autoradiography and TCA precipitation using 14C-leucine. Initially 2 × 5 μL of the reaction mixture (suspension) is collected for TCA precipitation and 1 × 5 μL for SDS-PAGE analysis. Next, centrifuge the remaining reaction mixture at 16,000 × g for 10 min at 4 °C.
-
4.
Collect the supernatant into a separate Eppendorf tube. 2 × 5 μL of the supernatant is collected for TCA precipitation and 1 × 5 μL for SDS-PAGE analysis.
-
5.
For TCA precipitation, mix 5 μL aliquots (both suspension and supernatant) with 3 mL trichloroacetic acid (TCA) and incubate the mixture in a water bath at 80 °C for 15 min. Afterward, keep the reaction vessel on ice for 30 min.
-
6.
Filter the solution using the vacuum filtration system to retain the radiolabeled proteins on the surface of the filter paper. Wash proteins twice with TCA and twice with acetone, dry the filter papers for some minutes under the hood.
-
7.
Transfer the dried protein-enriched filter papers to scintillation tubes (Zinsser Analytic), overlay with 3 mL of scintillation cocktail and let it shake on the orbital shaker for at least 1 h. Measure the incorporation of 14C-leucine by liquid scintillation counting using the scintillation counter.
-
8.
For SDS-PAGE analysis, precipitate 5 μL aliquots (both suspension and supernatant) of the cell-free reaction mixtures by cold acetone precipitation: Add 45 μL of the water and 150 μL of ice cold acetone to the 5 μL aliquot and incubate on ice for 15 min. Next, centrifuge the mixture at 16,000 × g for 10 min at 4 °C. Discard the supernatant containing the acetone.
-
9.
Resuspend the pellets in 20 μL of NuPAGE® LDS Sample Buffer and load the samples on precast SDS-PAGE gels. Run the gel at 200 V for 35 min. After drying the gels for 70 min at 70 °C using the Unigeldryer, visualize radioactively labeled proteins with the phosphorimager.
-
10.
BR in the presence of NDs is folded in a correct form and shows a purple color due to the conversion of all-trans retinal to 11-cis retinal (Fig. 2). Confirm this by analyzing the supernatant samples of BR (Subheading 3.2, step 4) by UV-Visible spectroscopy for measuring the BR-specific peak.
Table 2 Setup of the E. coli based cell-free synthesis of BR and MtlA proteins in the presence of NDs Fig. 2 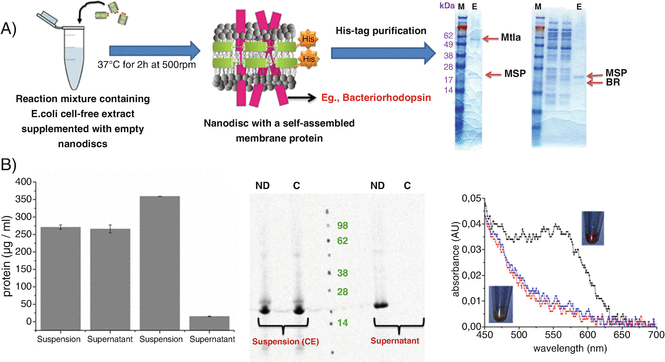
(a) E. coli based cell-free synthesis of MPs in the presence of NDs. Proteins solubilized in NDs can be purified by using the His-tag available on the MSP. The SDS-PAGE gel (right) shows the presence of two bands corresponding to the MSP and the synthesized protein (MtlA and BR). (b) Quantification of de novo synthesized BR based on TCA-precipitation. The cell-free system shows the recovery of the synthesized BR MP only in the presence of NDs in the supernatant fraction. SDS-PAGE combined with autoradiography shows the presence of bands corresponding to the synthesized BR protein in the supernatant fraction only in the presence of NDs. UV-Visible measurements showing the presence of a peak around 550 nm corresponding to the presence of BR. Inset shows the purple color formation corresponding to the BR incorporated in the NDs

An absorbance peak at around 550 nm corresponds to the purple color of the BR protein. Supernatants from the control reaction (without NDs) should neither produce a purple color nor show an absorbance peak at 550 nm. This indicates that NDs help in correct folding of the BR. Figure 3 shows the synthesis of functional BR in the presence of NDs with saturated DMPC lipids doped with cationic (DOTAP) and anionic lipids (DOPG) (Reactions 1 and 6, Table 1). The intensity of the purple color, which indicates the presence of functional BR, varies with lipid composition with higher intensity in the presence of DOPG lipids. This clearly shows that doping of DOPG lipids along with DMPC helps in a better folding of the BR compared to DOTAP lipids. These results suggest that ND with different lipids can have influence on the functionality of the protein [14].

(a) Reaction tubes showing the BR synthesized in the presence of nanodiscs containing different lipid composition by using E. coli based cell-free system. (b) UV-visible absorbance peak of BR synthesized in the presence of nanodiscs with different lipid compositions at 550 nm
3.3 Membrane Protein Synthesis in Eukaryotic Cell-Free Systems
Cell-free protein synthesis is performed in the linked reaction mode by performing transcription and translation individually (see Notes 5 and 6 ). Details can be found in Refs. [4, 7]:
-
1.
In the first step, mRNA is generated by transcription from the plasmid DNA (plasmid encoding the KcsA protein, final concentration: 60 μg/mL) or E-PCR product (final concentration: 8 μg/mL) and is incubated for 2 h at 37 °C. The reaction is performed with 80 mM HEPES–KOH buffer, pH 7.6, 15 mM MgCl2, 3.75 mM NTPs, 0.5 mM m7G(ppp)G-CAP analog and 1 U/μL T7 RNA polymerase.
-
2.
Once the reaction is completed, purify the mRNA using DyeEx spin columns according to the manufacturer’s instructions.
-
3.
Quantify the purified mRNA using the NanoDrop 2000c. After estimating the concentration, mRNA is used for protein synthesis.
-
4.
In the second step, translation is performed by adding mRNA at a final concentration of 260 μg/mL. To monitor protein quality and quantity, add 14C-labeled leucine to the translation reaction mixture to yield a final concentration of 60 μM. The translation mixture is incubated for 90 min at 27 °C.
-
5.
Quantification of the synthesized protein is done by hot trichloroacetic acid (TCA) precipitation followed by radioactivity measurements as described in Subheading 3.2, steps 4–7. To analyze homogeneity and molecular weight of in vitro translated proteins, take 5 μL aliquots of radiolabeled cell-free translation reaction mixtures for SDS-PAGE analysis using precast gels as explained in Subheading 3.2, step 8 and in Refs. [4,5,6,7].
-
6.
KcsA forms a stable tetramer as seen in Fig. 4a. A prolonged time of translation leads to an increase in the intensity of the tetramer band in the vesicular fraction (VF). These observations correlate with the protein yields for different time periods (Fig. 4b).
Fig. 4 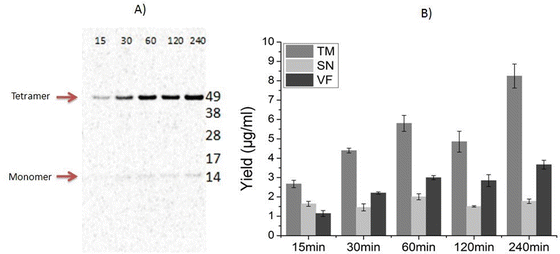
Cell-free synthesis of KcsA . (a) Time course analysis of KcsA assembly during cell-free translation. Products of the cell-free reaction mixture were separated in a 10% SDS polyacrylamide gel. De novo synthesized proteins were labeled with 14C-leucine and visualized by autoradiography showing the KcsA tetramer band at approximately 49 kDa. (b) Time course analysis of protein yields in different fractions. Quantification is performed by hot TCA precipitation of 14C-leucine labeled KcsA. Translation mixture (TM) is separated by centrifugation into supernatant (SN) and vesicular fractions (VF)

3.4 Preparation of Proteoliposomes
Once the protein is synthesized, the vesicular fraction (VF) harboring the synthesized protein of interest is used for functional analysis. One can add either the translation reaction mixture harboring the microsomes and synthesized proteins directly onto the lipid bilayer or prepare proteoliposomes for a faster fusion, as described in the following steps:
-
1.
50 μL of the cell-free translation mixture (TM) is centrifuged at 16,000 × g for 10 min at 4 °C. Supernatant (SN) is separated from the pellet (VF). VF contains the microsomes incorporating the MP of interest.
-
2.
Resuspend the VF in 0.1 M PBS pH 7.0 by pipetting up and down. Repeat the centrifugation step. After the second centrifugation, separate the SN from the VF. The VF contains the washed microsomes.
-
3.
Dissolve the washed VF in 50 μL of the cholate buffer. Resuspend vigorously.
-
4.
Mix 50 μL of the detergent resuspended microsomal fraction with 50 μL of the 15 mM lipid solution of choice (DOPG in our case) and keep the solution for rotation at 300 rpm at 4 °C for 1 h (see Note 3 ).
-
5.
Add Biobeads-SM2 up to 80 vol% of the lipid mixture and incubate further overnight (ON) at 4 °C.
-
6.
After ON incubation at 4 °C, spin down all the Biobeads-SM2 by using a short centrifugation step for few seconds and collect the supernatant from the top. The proteoliposomes can be stored at 4 °C for few days when measured continuously (see Note 7 ).
-
7.
For measuring the activity of the native translocon sec61 pore naturally present in the microsomes, add 30 μL of 2.5 mM puromycin dissolved in 500 mM KCl to the vesicular fraction and incubate on ice for 45 min (VF from step 1 in this section) to get a final concentration of 250 μM in 500 mM KCl. Puromycin combined with high salt concentration unplugs the ribosome from the microsomes and opens the sec61 pore [18].
-
8.
Centrifuge the microsomal fraction once again at 16,000 × g for 10 min at 4 °C and remove the SN. Prepare the proteoliposomes by repeating the steps 2–6 in this section.
3.5 Formation of Lipid Bilayers
-
1.
Lipids of interest are dissolved in octane at a concentration of 2 mg/mL. All the stocks of lipids are stored at −20 °C.
-
2.
Lipid bilayers are formed on MECA array chips mounted on the Orbit 16 System [16].
-
3.
Lipid bilayers are formed as described in [16, 17]: Briefly, 200 μL of electrolyte solution is added to the measurement chamber containing the MECA chip. Once the buffer is added, all the electrodes will be in open (seal resistance of few MΩ).
-
4.
For the automated bilayer formation on the 16 cavities in parallel, a small amount of approx. 0.1 μL of DPhPC at 2 mg/mL in octane is pipetted on to the chip surface and painted with the help of a magnetic bar lying on the MECA chip [16]. Following pipetting of lipids, the bar is moved across the apertures in a circuitious fashion by performing one slow (45–180°/s) rotation of a counter magnet positioned below the chip with the help of the electromotor.
-
5.
Lipid bilayer formation will be indicated by the change in resistance from MΩ to GΩ (for confirmation of lipid bilayer formation, see Notes 8 and 9 ).
3.6 Functional Assessment of MPs
-
1.
Once the lipid bilayer is formed, add 4 μL of the proteoliposomes prepared from the puromycin treated native microsomes (no protein synthesized) directly into the buffer chamber containing the lipid bilayers and wait for fusion.
-
2.
After incubating the lipid bilayer with the proteoliposomes, measure activity from the voltage-clamped lipid bilayers of the sec61 pore by a single channel amplifier single channel amplifier (EPC-10) and the data acquisition software Patchmaster connected to the multiplexer electronics port of the Orbit16 system [14,15,16]. Recordings are done at a sampling rate of 50 kHz with a 10 kHz Bessel filter (see Subheading 2.6, step 7). Unitary currents are recorded from the voltage-clamped lipid bilayers.
-
3.
Analyze data: Parameters like voltage ramps for monitoring currents are measured by using Patchmaster software and analyzed by the Clampfit software version 10.7.
3.7 Case Study: Exemplary Data for sec61 and KcsA Proteins
Figure 5 shows the functional analysis of native endogenous translocon sec61 protein activity from the microsomal membranes. The diagram shows the typical voltage-gating behavior of native sec61 translocon pore typically present in the microsomes obtained after fusion to the planar lipid bilayer . At lower voltages of −20 and −40 mV, the channel is open without any subconductance states. When the potential is increased to −60, −80, and −100 mV, one can notice the subconductance states. The probability of the channel to be either closed or in one of its open states was constantly reduced at larger potentials. From these activity studies, we observed that the rate of fusion of the protein to the lipid bilayer is increased with modified microsomes (proteoliposomes ) when compared to the unmodified. This also shows us the efficiency of the fusion of microsomal proteoliposomes to the lipid bilayer. From Fig. 5a, we can see that with increase in the holding potential, the probability of the channel to be open continuously is reduced [18].

Measurement of native endogenous translocon activity from the proteoliposomes formed from PG and microsomal lipids derived from the insect cell-free system. (a) Two Voltage ramp traces (shown in black and grey) showing the translocon currents (−100 mV to +100 mV). (b) Current voltage relationship of a single sec61 channel unit from the microsomal proteoliposomes at different negative voltages (−100 mV shown in black and other voltages shown in different colors) (observe the sub conductance states at larger potentials)
The next step was to prove that this observation is applicable to the newly expressed proteins into the microsomes. The results of the activity measurements of KcsA synthesized in the eukaryotic cell-free system are presented in Fig. 6. After the synthesis reaction, steps 1 and 2 in the Subheading 3.4 were repeated and the microsomes were extracted and used for the functionality measurements. Electrophysiology measurements were recorded and analyzed as shown in Subheading 3.6, steps 2 and 3. KcsA present in the microsomes showed the functional activity after fusion with the lipid bilayer . Parameters like single-channel conductance events (in the case of KcsA), all point histograms (see Note 10 ) were measured and analyzed. The protein exhibits a typical single-channel gating characteristic of KcsA at a transmembrane voltage of +60 mV, with a varying mean open time of few ms followed by the closure of the channel (inactivation) [13] (see Note 11 ).

(a) Electrophysiological characterization of KcsA demonstrating the single-channel activity. All the electrophysiology measurements were done in symmetrical 10 mM Tris, 200 mM KCl solutions with asymmetric pHs 4.0 and 7.0 on either side of the lipid bilayer . The closed state of the channel is marked with a red arrow indicating a baseline. Single-channel KcsA trace obtained at +60 mV. Zoomed-in view of the 1 s current trace obtained at +60 mV (pointed by blue arrow). (b) All-point histograms of the current trace plotted as amplitudes (pA) of the KcsA currents against counts of current amplitudes at +60 mV
4 Notes
-
1.
Preparation of Sf21 lysate : Fall army worm (Spodoptera frugiperda 21, Sf21) cells which were grown exponentially in well-controlled fermenters at 27 °C in an animal component free insect cell medium (Sf21: Insect-XPRESS medium, Lonza) were harvested at a density of approximately 4 × 10⁶ cells/mL. Sf21 cells were collected by centrifugation at 200 × g for 10 min, washed and resuspended with a HEPES-based [4-(2-hydroxyethyl)-1-piperazineethanesulfonic acid] buffer consisting of 40 mM HEPES–KOH (pH 7.5), 100 mM KOAc, 4 mM DTT to reach a final cell density of approximately 2 × 10⁸ cells/mL. Sf21 cells were disrupted mechanically by passing the cell suspension through a 20-gauge needle or by high-pressure homogenization followed by centrifugation at 10,000 × g for 10 min to remove the nuclei and cell debris. The supernatant was applied to a Sephadex G-25 column (GE Healthcare, Freiburg, Germany), equilibrated with the above mentioned resuspension buffer, and the fractions with the highest RNA content, as measured by absorbance at 260 nm, were pooled. Cell lysates were treated with micrococcal nuclease (S7) in order to degrade residual mRNA. Finally, aliquots of the cell lysate were immediately shock-frozen in liquid nitrogen and stored at −80 °C to preserve maximum activity.
-
2.
Always aliquot the samples (lysates, cell-free components, NDs, proteoliposomes etc) to avoid repeated freeze thaw cycles.
-
3.
The choice of using the lipids is flexible and can be changed according to the protein of interest. Some proteins, especially voltage-gated ion channels , are sensitive to the lipid composition [19]. The above-explained strategy can be modified with different lipids to improve the activity of the protein.
-
4.
NDs can be prepared with different lipids and the proteins functionality can be improved by carefully adjusting the lipid composition. BR is shown as an example as it emits purple color when folded correctly but the NDs protocol can be applied to any type of MP.
-
5.
Wait until all samples are completely thawed and fully dissolved before use. Do not keep the cell-free components outside on ice for longer periods. Once the cell-free components are mixed, it is recommended to shock-freeze them immediately in liquid N2 and store at −80 °C.
-
6.
In order to increase the protein yields, plasmids can be designed with additional regulatory elements such as CrPV IRES etc. [6].
-
7.
For longer storages we recommend to store them by shock freezing in liquid N2 at −80 °C. Always thaw the proteoliposomes or microsomes on ice when taken from −80 °C.
-
8.
Once we notice the formation of Gigaseals indicating the formation of lipid bilayers , it is better to confirm by applying the ZAP pulse button (900 mV for 200 ms) to the underlying microelectrode cavities. Application of ZAP pulse clearly breaks the lipid bilayer (Resistance changes from GΩ to few MΩ). If there is no effect on the seal current, it indicates the clogging of MEC by the solvent or formation of multiple layers of lipids.
-
9.
If there is an indication of clogging, it is recommended to turn the magnet multiple times until we notice the lipid bilayer presence (ZAP function test).
-
10.
All point histograms presents the total number of opening and closing events within a defined time scale.
-
11.
This lipid bilayer reconstitution protocol for studying the functionality of the synthesized proteins is applicable only with proteoliposomes or microsomes. In the case of soluble proteins (e. g., porins), one can directly add the purified protein over the lipid bilayer.
References
Bear CE, Li CH, Kartner N et al (1992) Purification and functional reconstitution of the cystic fibrosis transmembrane conductance regulator (CFTR). Cell 68:809–818
Caterina MJ, Schumacher MA, Tominaga M et al (1997) The capsaicin receptor: a heat-activated ion channel in the pain pathway. Nature 389:816–824
Sanguinetti MC, Tristani-Firouzi M (2006) hERG potassium channels and cardiac arrhythmia. Nature 440:463–469
Sachse R, Wüstenhagen D, Šamalíková M et al (2012) Synthesis of membrane proteins in eukaryotic cell-free systems. Eng Life Sci 13:39–48
Brödel AK, Raymond JA, Duman JG et al (2013) Functional evaluation of candidate ice structuring proteins using cell-free expression systems. J Biotechnol 163:301–310
Brödel AK, Sonnabend A, Roberts LO et al (2013) IRES-mediated translation of membrane proteins and glycoproteins in eukaryotic cell-free systems. PLoS One 8:e82234
Zeng A, Stech M, Broedel AK et al (2013) Cell-free systems: functional modules for synthetic and chemical biology. Adv Biochem Eng Biotechnol 137:67–102
Sachse R, Dondapati SK, Fenz SF et al (2014) Membrane protein synthesis in cell-free systems: from bio-mimetic systems to bio-membranes. FEBS Lett 588:2774–2781
Quast RB, Kortt O, Henkel J et al (2015) Automated production of functional membrane proteins using eukaryotic cell-free translation systems. J Biotechnol 203:45–53
Bechlars S, Wüstenhagen DA, Drägert K et al (2013) Cell-free synthesis of functional thermostable direct hemolysins of Vibrio parahaemolyticus. Toxicon 76:132–142
Quast RB, Claussnitzer I, Merk H et al (2014) Synthesis and site-directed fluorescence labeling of azido proteins using eukaryotic cell-free orthogonal translation systems. Anal Biochem 451:4–9
Quast RB, Mrusek D, Hoffmeister C et al (2015) Cotranslational incorporation of non-standard amino acids using cell-free protein synthesis. FEBS Lett 589:1703–1712
Dondapati SK, Kreir M, Quast RB et al (2014) Membrane assembly of the functional KcsA potassium channel in a vesicle-based eukaryotic cell-free translation system. Biosens Bioelectron 59:174–183
Cappuccio JA, Blanchette CD, Sulchek TA et al (2008) Cell-free co-expression of functional membrane proteins and apolipoprotein, forming soluble nanolipoprotein particles. Mol Cell Proteomics 7:2246–2253
Baaken G, Ankri N, Schuler AK et al (2011) Nanopore-based single-molecule mass spectrometry on a lipid membrane microarray. ACS Nano 5:8080–8088
Baaken G, Halimeh I, Bacri L et al (2015) High-resolution size-discrimination of single nonionic synthetic polymers with a highly charged biological nanopore. ACS Nano 9:6443–6449
del Rio Martinez JM, Zaitseva E, Petersen S et al (2015) Automated formation of lipid membrane microarrays for ionic single-molecule sensing with protein nanopores. Small 11:119–125
Erdmann F, Jung M, Maurer P et al (2010) The mammalian and yeast translocon complexes comprise a characteristic Sec61 channel. Biochem Biophys Res Commun 396:714–720
Lee SY, Lee A, Chen J et al (2005) Structure of the KvAP voltage-dependent K+ channel and its dependence on the lipid membrane. Proc Natl Acad Sci U S A 102:15441–15446
Acknowledgment
This work is supported by the European Regional Development Fund (EFRE) and the German Ministry of Education and Research (BMBF, No. 031B0078A).
Author information
Authors and Affiliations
Corresponding author
Editor information
Editors and Affiliations
Rights and permissions
Open Access This chapter is licensed under the terms of the Creative Commons Attribution 4.0 International License (http://creativecommons.org/licenses/by/4.0/), which permits use, sharing, adaptation, distribution and reproduction in any medium or format, as long as you give appropriate credit to the original author(s) and the source, provide a link to the Creative Commons license and indicate if changes were made.
The images or other third party material in this chapter are included in the chapter’s Creative Commons license, unless indicated otherwise in a credit line to the material. If material is not included in the chapter’s Creative Commons license and your intended use is not permitted by statutory regulation or exceeds the permitted use, you will need to obtain permission directly from the copyright holder.
Copyright information
© 2018 The Author(s)
About this protocol

Cite this protocol
Dondapati, S.K., Wüstenhagen, D.A., Kubick, S. (2018). Functional Analysis of Membrane Proteins Produced by Cell-Free Translation. In: Bornscheuer, U., Höhne, M. (eds) Protein Engineering. Methods in Molecular Biology, vol 1685. Humana Press, New York, NY. https://doi.org/10.1007/978-1-4939-7366-8_10
Download citation
DOI: https://doi.org/10.1007/978-1-4939-7366-8_10
Published:
Publisher Name: Humana Press, New York, NY
Print ISBN: 978-1-4939-7364-4
Online ISBN: 978-1-4939-7366-8
eBook Packages: Springer Protocols