
Abstract
Chemical geothermometry using silica was employed in the present study to estimate the sub-surface groundwater temperature and the corresponding depth of the groundwater in parts of Kali watershed in Bulandshahr and Aligarh district. 42 groundwater samples each were collected from borewells during pre-monsoon and post-monsoon season 2012 and analysed for all major ions and silica. Silica values in the area range from 18.72 to 50.64 mg/l in May 2012 and from 18.89 to 52.23 mg/l in November 2012. Chalcedony temperature >60 °C was deduced for five different locations in each season, which corresponds to a depth of more than 1,000 metres. Spatial variation of silica shows high values along a considerable stretch of River Kali, during pre-monsoon season. Relationship of silica with Total Dissolved Solids and Chloride was established to infer the role of geogenic and anthropogenic processes in solute acquisition. It was found that both water–rock interaction and anthropogenic influences are responsible for the observed water chemistry.
Introduction
Groundwater temperature is a direct indicator of geothermal influence. Chemical geothermometry is a technique that can be used to estimate sub-surface reservoir temperatures using concentration of certain elements in groundwater. Geothermometers provide important information on the reservoir temperatures. They are based on temperature-dependent mineral equilibria. The information obtained from geothermometers is inexpensive and reliable. The quartz and Na–K geothermometers are the most commonly used chemical geothermometers (Hailemichael 2008). Unfortunately, the predicted temperatures generally show a wide dispersion even when applying a single geothermometer to all the wells in an area. Many reasons have been proposed to justify the discrepancies, including gain or loss of steam phase in the reservoir, mixing of different types of fluids, re-equilibration during ascension to superficies, precipitation–dissolution, etc. (Truesdell and Fournier 1977; Verma 2000).
The application of chemical geothermometers is based on a number of assumptions (Fridriksson and Armannsson 2007). When geothermometers are applied to estimate sub-surface or aquifer temperatures, a basic assumption is that temperature-dependent chemical or isotopic equilibria prevail in the source aquifer. It is assumed that the chemical and isotopic reactions do not significantly modify the composition of fluid as it ascends from the source aquifer to the sampling point (Karingthi 2009).
Silica in groundwater is exclusively derived from water–rock interaction. The circulating groundwater dissolves the silica derived from the chemical weathering of silicate minerals in rocks and sediments (Hem 1959). SiO2 concentration in groundwater ranges from 1 to 30 mg/l, usually around 17 mg/l. Silica content in groundwater is directly proportional to its residence time (Marchand et al. 2002), since prolonged contact with silicate rocks increases the Si concentration. Hence, water ascending from deeper reservoir is rich in silica as compared to shallow groundwater. Factors like permeability, lithology and residence time of groundwater control the intensity of water–rock interaction which in turn dictates the silica content in groundwater. Study by McMahon et al. (1995) has shown that organic acid-rich groundwater enhanced quartz/k-feldspar dissolution in the aquifer. However, temperature has a direct control over the silica solubility in groundwater (Fournier 1983). Due to the consistency of the temperature-silica solubility relationship, it is used as a geothermometer in groundwater and geothermal studies.
Silica concentration in groundwater has been correlated with different parameters such as regional heat flow values (Swanberg and Morgan 1978; Geological survey of India 1991), temperature condition at the time of silica acquisition (Fournier 1983; Boughton and McCoy 2006), water–rock interaction (Marchand et al. 2002; Fournier 1983), total dissolved solids (TDS) and specific electrical conductivity (Barbara and Harry 1984) and TDS and Chloride (Cl−) (Khan and Umar 2010). Silica geothermometry was applied on thermal groundwaters in the Gulf of Suez region, Egypt (El-Fiky 2009) and the results showed that the sub-surface temperatures range between 29.4 and 104.5 °C. Ferguson et al. (2009) studied the potential for mixing and re-equilibration of water by examining heat and fluid flow along crustal scale faults along tectonic geothermal systems and found that significant mixing with shallow groundwater will occur resulting in an under-prediction of maximum circulation temperature by 10–35 % using silica and chalcedony geothermometers. Silica was correlated with TDS and Cl− (Khan and Umar 2010) to study the effect of various geogenic and anthropogenic processes on groundwater chemistry.
In the present study, silica-based geothermometer of Fournier (1983) has been used because the formulation provides a simple and unique relationship between temperature and silica concentration. It was employed to estimate the sub-surface groundwater temperature and the corresponding depth of groundwater. Further, silica values were correlated with TDS and Cl− values, using the conventional graphical methods, to understand the role of anthropogenic activities and geogenic processes on groundwater chemistry.
Study area
The study area, covering about 665 km2, is a part of Kali watershed in Bulandshahr and Aligarh district. Geographic coordinates of the area are 28°N to 28°15′N and 77°E to 77°15′E. Kali is the major river flowing through the area, which experiences a tropical monsoon type of climate. The study area is flat plain with a general slope from north-west to south-east. The area is underlain by a moderately thick pile of Quaternary sediments, which comprise sands of various grades, clays and kankar. Alluvial sediments overlie Vindhyan group of rocks of Proterozoic age in an unconformable way, and thickness of alluvial deposits varies from 287 to 380 m (CGWB 2002). The entire area has a top clay layer ranging in thickness from 3 to 8 m below ground level. Sandy horizon forms the potential aquifer. Groundwater occurs under water table conditions and depth to water varies between 2.23 and 12.4 m bgl. The general groundwater flow direction is from NW to SE.
Methodology
Groundwater samples were collected from 42 borewells in the study area during May and November 2012 for silica and major ion analysis (Fig. 1). The sampling wells were carefully selected to spread the sampling points over the study area evenly. The geographical coordinates of the borewells were captured using a handheld Garmin e-Trex GPS receiver. Silica analysis was carried out using ammonium molybdate spectrophotometric method. Major ions were analysed as per the standard methods of APHA (1992).

Map of the study area showing sampling locations
Silica geothermometry
Swanberg and Morgan (1978) applied silica geothermometer to over 70,000 non-thermal groundwater samples of USA and unequivocally showed that there is a strong correlation between silica geotemperatures for a given region and the known regional heat flow. They arrived at a relationship
where q is the regional heat flow in mWm−2 and m and b are constants with values 0.67 °C m2 mW−1 and 13.2 °C, respectively. Constant b is related to the mean air temperature and m is related to the depth to which water descends. They further demonstrated that the estimated depth of the occurrence of the groundwater in deep steady state is 1,400–2,000 m.
The first silica geothermometer equation was presented by Morey et al. (1962). Various silica geothermometer equations have been developed over the years to assess sub-surface temperatures from the silica content of natural water in equilibrium with either quartz or chalcedony. Temperatures estimated by these geothermometers are referred to as quartz and chalcedony temperatures, respectively (Arnorsson 2000). The quartz geothermometer is generally applied in high-temperature systems while the chalcedony geothermometer is used in low-temperature systems. The one which seems to be appropriate for groundwater systems is given by Fournier (1983).The following equation takes into account the solubility of chalcedony:
where, SiO2 concentration of water sample is in mg/l and t °C is the chalcedony-derived temperature of groundwater.
Substituting the determined silica values in the above equation, we can calculate the chalcedony temperature of the groundwater. Thus, a groundwater sample with higher silica content would represent more water–rock interaction at a relatively high temperature level than a sample with lower silica content. Converting silica values to aquifer temperature provides an estimate to the depth of aquifer assuming normal geothermal gradient of 30 °C/km. The main purpose of this approach is to make a distinction between water of deeper origin and shallower origin, which can provide a significant clue either to geogenic or anthropogenic involvement in evolving groundwater quality.
Results and discussion
Results of silica analysis and temperatures deduced using the chalcedony thermometry for both the time periods (May 2012 and November 2012) are given in Table 1. In addition to silica and the temperatures estimated, the table also gives other parameters such as Cl and TDS with which silica has been correlated. All the parameters, including silica, are given in mg/l.
The silica values in the region vary from about 18.72 to 50.64 mg/l in May 2012 with an average value of around 27 mg/l and from 18.89 to 52.23 mg/l in November 2012 with an average of 29 mg/l. Five samples in May 2012 and 4 samples in November 2012 show silica values >40 mg/l. In May 2012, maximum chalcedony temperatures of more than 60 °C were determined at Jagdishpur, Bahlolpur, Pindrawal, Bigupur and Kazimabad. The temperatures deciphered for the remaining samples range from 28 to 58 °C.
In Nov 2012, the chalcedony temperature of the sample at Pindrawal still shows a high value of about 60 °C, while the samples of Kazimabad, Bigupur and Jagdishpur show a decline in silica values which correspond to a temperature of about 41.5, 42 and 36 °C, respectively, and this decline can be attributed to the dilution of silica concentration in post-monsoon period. The silica concentration of samples in Nov 2012 varies from 18.89 to 52.23 mg/l and the chalcedony temperature varies from approximately 29 to 74 °C with 5 values having >60 °C temperature.
In May 2012, when the ambient air temperature was in excess of 30 °C, a silica temperature of 66 °C would mean a temperature of about 35 °C over and above the average air temperature, which in turn would correspond to a depth of about 1,000 m taking into account an average geothermal gradient of 30 °C/km (GSI 1991). In this way, samples that have silica values > 40 mg/l and temperature more than 60 °C correspond to a depth of about 1,000 m or more.
The spatial variation in the silica values in groundwater of the study area is shown in Fig. 2a and b, representing pre-monsoon and post-monsoon distributions, respectively. In Fig. 2a, high values of silica (>36 mg/l) are observed in the eastern and the central part (Bigupur, Kazimabad and Pindrawal) and two isolated silica highs are also observed, one in the northern part (Jagdishpur) and the other (Bahlolpur) in the southern part. In most of the region, the values range from 22 to 28 mg/l. Except a few locations, it is generally observed that silica values are higher along river Kali. This suggests that river Kali is receiving groundwater discharge from local groundwater system and possibly from deeper and regional groundwater system, too.

a Spatial distribution map of silica (May 2012). b Spatial distribution map of silica (November 2012)
In post-monsoon period, isolated silica highs are observed in some areas in the north with values 36.49, 38.81 and 37.68 mg/l in Lalner, Aterna and Danpur, respectively. Most of the region shows an average value of 28 mg/l. However, these silica highs do not coincide with the Kali River. This may be due to the enhanced circulation of groundwater in the shallow local groundwater system. Silica concentration is dependent on the relative proportion of local (shallow) and regional (deep) groundwater flux. Since local system has a rapid response to seasonal fluctuation, shallow groundwater influx will decrease in pre-monsoon and increase in post-monsoon. This will lead to the dilution of deeper, silica-rich, regional groundwater flow during post-monsoon.
Relationship of silica with chloride
Chloride acts as an inert element in practically all natural water–rock environments, i.e. once in solution, it stays there both at ambient and elevated temperatures (Ellis 1970). It usually does not enter common rock-forming minerals due to the large size of its ion and hence does not participate in ion exchange in groundwater. Presence of high amounts of Cl in groundwater undoubtedly indicates anthropogenic influence on the groundwater chemistry, whereas silica enters the groundwater system exclusively and unequivocally through rock–water interaction (Hem 1959). Keeping this in consideration, Cl values have been related to silica concentrations for both the time periods (Fig. 3a, b) to evaluate the role of anthropogenic and natural activities in ion acquisition.

a SiO2 vs. Cl plot (May 2012). b SiO2 vs. Cl plot (November 2012)
SiO2 versus Cl plot of May 2012 (Fig. 3a) shows that for almost similar SiO2 values of 19–25 mg/l, Cl increases to as high as 173 mg/l. This indicates that bulk of Cl− has been acquired by processes other than geogenic. Samples 9, 18 and 40 show high SiO2 as well as high Cl values suggesting that both rock–water interaction and anthropogenic factors influence the chemistry of these samples.
SiO2 vs. Cl plot of Nov 2012 (Fig. 3b) shows three distinct features:
-
Few samples (6, 10, 11, 18, 19 and 41) in the post-monsoon season show a trend similar to that of pre-monsoon with Cl values progressively increasing for almost constant SiO2 values of about 20–24 mg/l. This group shows relatively high Cl concentrations and average chalcedony temperature of about 31 °C.
-
A particular group of 7 samples (7, 8, 9, 17, 21, 30, 41) shows a positive correlation with increasing Cl and SiO2 values and average chalcedony temperature of about 42 °C implying some contribution of water–rock interaction in acquisition of species.
-
Eight samples (13, 15, 16, 23, 24, 26, 35, 36) cluster to from a group with low Cl (11–31 mg/l) and high SiO2 values (37–52 mg/l) and average chalcedony temperature of about 62 °C which corresponds to a depth of roughly 1,000 m. At such depth water strongly interacts with rocks for relatively longer period and acquires silica in high proportions. Thus, these samples indicate geogenic processes contributing to ion acquisition.
Relationship of silica with TDS
SiO2 vs. TDS plot of both the seasons shows almost similar trend with most of the samples showing a very high TDS value for a narrow range of silica values. Few significant points that can be deciphered from the pre-monsoon plot are:
-
In Fig. 4a, for silica values between 19 and around 25 mg/l in the pre-monsoon season, TDS varies from approximately 188–1,037 mg/l suggesting that the bulk of TDS has been acquired by processes other than those responsible for acquisition of SiO2.
Fig. 4 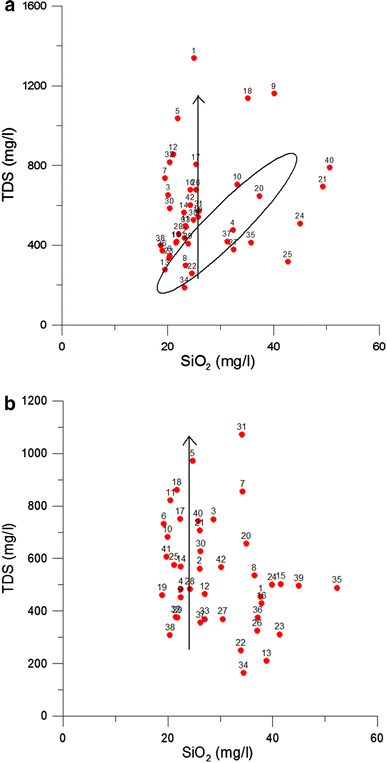
a SiO2 vs. TDS plot (May 2012). b SiO2 vs. TDS plot (November 2012)
-
Further, samples 4, 8, 10, 20, 22, 27, 34, 35 and 37 constituting a group shown on the plot exhibit a positive correlation between SiO2 and TDS, which indicates that both water–rock interaction and anthropogenic influences contribute to the chemistry of the groundwater.

The post-monsoon plot (Fig. 4b) clearly indicates increasing TDS values with near similar silica values. Most of the samples have silica values in the range of 19–28 mg/l with varying TDS reaching up to about 1,000 mg/l. This suggests direct impact of anthropogenic activities on groundwater.
Conclusion
Silica geothermometry as applied to the present study shows that the groundwater of five different locations during each sampling season indicates high chalcedony temperature >60 °C, which correspond to a depth of more than 1,000 metres. Spatial variation of silica shows high values along a considerable stretch of River Kali, during pre-monsoon season, which suggests that river Kali is receiving groundwater discharge from local groundwater system and possibly from deeper and regional groundwater system, too. However, this trend is not observed during post-monsoon. This may be due to the enhanced circulation of groundwater in the shallow, local groundwater system, relatively deficient in silica. Relationship of silica with TDS and Cl− to infer the role of geogenic and anthropogenic processes in solute acquisition showed that both water–rock interaction and anthropogenic influences are responsible for the observed water chemistry.
References
APHA (1992) Standard methods for the examination of water and waste waters, 18th edn. American Public Health Association, Washington DC
Arnorsson S (2000) Isotopic and chemical techniques in geothermal exploration, development and use. Sampling methods, data handling, interpretation. International Atomic Energy Agency, Vienna, p 351
Barbara AD, Harry IN (1984) Relationships between ground-water silica, total dissolved solids, and specific electrical conductivity. Groundwater 22(1):80–85
Boughton CJ, McCoy JK (2006) Hydrogeology, aquifer geochemistry and groundwater quality in Morgan County. Scientific invetsigation report 2006. US department of interior and US Geological Survey, Reston
CGWB (2002) Groundwater resource and development potentials of Aligarh, Uttar Pradesh. Central Ground Water Board, Ministry of Water Resources, pp 40
El-Fiky AA (2009) Hydrogeochemistry and geothermometry of thermal groundwater from the Gulf of Suez region, Egypt. Earth Sci 20(2):71–96
Ellis AJ (1970) Quantitative interpretation of chemical characteristics of hydrothermal systems. Geothermics 2:516–527
Ferguson G, Grasby SE, Hindle SR (2009) What do aqueous geothermometers really tell us? Geofluids 9:39–48
Fournier RO (1983) A revised and expanded silica geothermometer. Bull Geotherm Resour Counc 11:329
Fridriksson T, Armannsson H (2007) Application of geochemistry in geothermal resource assessments. In: Short course on geothermal development in Central America resource assessment and environmental management, El-Salvador, 25 Nov–1 Dec 2007
Geological Survey of India (1991) Geothermal atlas of India, special publication no. 19
Hailemichael DW (2008) Origin of geothermal waters and subsurface temperature estimates in the southern lowlands of Iceland. Geothermal training programme, reports 2008, no. 28
Hem JD (1959) Study and interpretations of chemical characteristics of natural water. USGS 2254:263 Water Supply Paper
Karingthi CW (2009) Chemical geothermometers for geothermal exploration. Short course IV on exploration for geothermal resources, Kenya, 1–22 Nov 2009
Khan MMA, Umar R (2010) Significance of silica analysis in groundwater in parts of Central Ganga plain, Uttar Pradesh, India. Current Sci 98(9):1237–1240
Marchand D, Rayan MC, Bethune DN, Chu A (2002) Groundwater–surface water interaction and nitrate origin in municipal water supply aquifers, Sanjose, Costa Rica
McMahon PB, Vroblesky DA, Bradley PM, Chapelle FH, Gullett CD (1995) Evidence for enhanced mineral dissolution in organic acid-rich shallow groundwater. Groundw J 33(2):207–216
Morey GW, Fournier RO, Rowe JJ (1962) The solubility of quartz in water in the temperature interval from 29 to 300°C. Geochim Cosmochim Acta 26:1029–1043
Swanberg CA, Morgan P (1978) The linear relation between temperatures based on the silica content of groundwater and regional heat flow: a new heat flow map of the united state. J Pure Appl Geophys 117(1–12):227–241
Truesdell AH, Fournier RO (1977) Procedure for estimating the temperature of a hot water component in mixed water by using a plot of dissolved silica versus enthalpy. USGS J Res 5:49–52
Verma MP (2000) Limitations in applying silica geothermometers for geothermal reservoir evaluation. In: Proceedings, 25th workshop on geothermal reservoir engineering, Stanford University, Stanford, 24–26 Jan 2000
Acknowledgments
The financial assistance received by first author in the form of Junior Research Fellowship from University Grant Commission, New Delhi is acknowledged. The authors are thankful to the reviewers for their suggestions that improved the work. Thanks are due to Chairman, Department of Geology, Aligarh Muslim University, Aligarh for providing the basic facilities to carry out the work.
Author information
Authors and Affiliations
Corresponding author
Rights and permissions
This article is published under license to BioMed Central Ltd.Open Access This article is distributed under the terms of the Creative Commons Attribution License which permits any use, distribution, and reproduction in any medium, provided the original author(s) and the source are credited.
About this article
Cite this article
Khan, A., Umar, R. & Khan, H.H. Significance of silica in identifying the processes affecting groundwater chemistry in parts of Kali watershed, Central Ganga Plain, India. Appl Water Sci 5, 65–72 (2015). https://doi.org/10.1007/s13201-014-0164-z
Received:
Accepted:
Published:
Issue Date:
DOI: https://doi.org/10.1007/s13201-014-0164-z