
Abstract
Background
Wasting and stunting are common. They are implicated in the deaths of almost two million children each year and account for over 12% of disability-adjusted life years lost in young children. Wasting and stunting tend to be addressed as separate issues despite evidence of common causality and the fact that children may suffer simultaneously from both conditions (WaSt). Questions remain regarding the risks associated with WaSt, which children are most affected, and how best to reach them.
Methods
A database of cross-sectional survey datasets containing data for almost 1.8 million children was compiled. This was analysed to determine the intersection between sets of wasted, stunted, and underweight children; the association between being wasted and being stunted; the severity of wasting and stunting in WaSt children; the prevalence of WaSt by age and sex, and to identify weight-for-age z-score and mid-upper arm circumference thresholds for detecting cases of WaSt. An additional analysis of the WHO Growth Standards sought the maximum possible weight-for-age z-score for WaSt children.
Results
All children who were simultaneously wasted and stunted were also underweight. The maximum possible weight-for-age z-score in these children was below − 2.35. Low WHZ and low HAZ have a joint effect on WAZ which varies with age and sex. WaSt and “multiple anthropometric deficits” (i.e. being simultaneously wasted, stunted, and underweight) are identical conditions. The conditions of being wasted and being stunted are positively associated with each other. WaSt cases have more severe wasting than wasted only cases. WaSt cases have more severe stunting than stunted only cases. WaSt is largely a disease of younger children and of males. Cases of WaSt can be detected with excellent sensitivity and good specificity using weight-for-age.
Conclusions
The category “multiple anthropometric deficits” can be abandoned in favour of WaSt. Therapeutic feeding programs should cover WaSt cases given the high mortality risk associated with this condition. Work on treatment effectiveness, duration of treatment, and relapse after cure for WaSt cases should be undertaken. Routine reporting of the prevalence of WaSt should be encouraged. Further work on the aetiology, prevention, case-finding, and treatment of WaSt cases as well as the extent to which current interventions are reaching WaSt cases is required.
Background
An estimated 52 million children are wasted (16 million severely wasted) and 155 million children are stunted [1]. Each year, approximately 800,000 deaths are attributable to wasting, 60% of these attributable to severe wasting (SAM), and over one million deaths are attributable to stunting. These figures are based on prevalence estimates from cross-sectional surveys. Wasting is an acute condition and many wasted children will either recover or die within a few weeks. Estimating the number of wasted children present in a population over a given period of time using unadjusted prevalence estimates is likely to miss many new (i.e. incident) cases and significantly underestimate burden and attributable deaths [2]. A recent estimate of the annual global SAM burden that attempts to account for incident cases suggests that 110 million cases per year might be a more accurate estimate for severe wasting alone [3, 4]. Wasting and stunting are also estimated to be associated with the loss of 64.6 and 54.9 million disability-adjusted life years (DALYs) respectively, accounting for 14.8 and 12.6% of the total global DALYs lost for children under five years of age [5]. Recent global analyses reported that substantial progress has been made in reducing the number of stunted children [1, 6]. There has, however, been less progress in reducing the number of wasted children. It seems unlikely that the World Health Assembly goals of a 40% reduction in the prevalence of stuntedness and reducing and maintaining the prevalence of wasting below 5% will be met by the 2025 target date [6].
A number of recent reviews have noted that addressing wasting and stunting as separate issues, as has historically been the case, may not be justified [7,8,9,10,11]. Wasting and stunting are often present in the same populations and there is evidence suggesting that they share many causal factors [12, 13]. Investigations into whether there is a direct causal relationship between wasting and stunting is ongoing and a number of gaps in the evidence base have been identified [14]. One of these evidence gaps relates to the recognition that children can be both wasted and stunted at the same time [6, 15]. The factors leading to this state of ‘concurrence’ are poorly understood but evidence indicates that considerable excess mortality is experienced by children who are concurrently wasted, stunted, and underweight [16].
National estimates of the prevalence and burden of children concurrently wasted and stunted (a condition referred to as WaSt throughout this article) have recently been made for 84 countries [17]. Prevalence ranged between zero and 8% and exceeded 5% in 9 of the 84 countries for which estimates were made.
Questions remain regarding mortality and developmental risks associated with WaSt, which children are most affected, how WaSt cases may be practictably identified at facility and community level, and implications for programs, health policy and planning, and development policy.
This article reports on an analysis of a large database of cross sectional nutritional anthropometry surveys and aims to answer six basic questions: The degree of overlap between being wasted, being stunted, and being underweight; the maximum possible weight-for-age z-score (WAZ) in children with WaSt; the direction and strength of the association between being wasted and being stunted; the severity of wasting and stunting in WaSt cases; the prevalence of WaSt by age and sex; and how WaSt cases may be identified. The analysis of the overlap between being wasted, being stunted, and being underweight was prompted by work demonstrating considerable excess mortality in children who were concurrently wasted, stunted, and underweight who have been described as having “multiple anthropometric deficits” [16].
Methods
Data management
A database of nutritional anthropometry survey datasets was compiled. Three existing databases were combined. These were a database compiled by Save the Children in 2007 to investigate the implications of replacing the National Centre for Health Statistics (NCHS) reference with the World Health Organisation (WHO) growth standards [18,19,20], a database compiled by the Community-based Management of Acute Malnutrition (CMAM) Forum and Action Against Hunger in 2015 to describe and map the prevalence of nutritional oedema, and a database of Standard Expanded Nutrition Survey (SENS) datasets from refugee settings compiled by the United Nations High Commissioner for Refugees (UNHCR) in 2016 for monitoring and evaluation (M&E) purposes [21]. All surveys followed the 30-by-30 nutritional anthropometry survey design, the Standardised Monitoring of Assessment of Relief and Transitions (SMART) survey design, or the SENS survey design [21,22,23].
Survey datasets were transformed into a standard format with the same variables, variable names, variable types, variable lengths, coding schemes, units of measurement, and file format. The scope of the datasets was limited to a small core set of common variables (i.e. cluster identifier, age, sex, weight, height, mid-upper arm circumference (MUAC), and the presence or absence of bilateral pitting oedema). Records with ages below 6 months and above 59 months, with heights below 45 cm and above 120 cm, and with bilateral pitting oedema were censored. Possible duplicate datasets were detected using a checksum algorithm. Duplication was confirmed using record-by-record validation. Confirmed duplicate datasets were removed from the database. Age data were grouped into year-centred age-groups [22]. Z-scores for weight-for-height (WHZ), height-for-age (HAZ), and weight-for-age (WAZ) were calculated using the WHO growth standards [19, 20]. WHO flagging criteria were applied and flagged records censored [19, 20]. The following standard case-definitions were applied to each record:
-
Wasted : WHZ < -2.0
-
Stunted : HAZ < -2.0
-
Underweight : WAZ < -2.0
Case-definitions for being both wasted and stunted (WaSt), being wasted but not stunted (wasted only), and being stunted but not wasted (stunted only) were also applied:
-
Wasted and stunted (WaSt) : WHZ < -2.0 and HAZ < -2.0
-
Wasted but not stunted (wasted only) : WHZ < -2.0 and HAZ ≥ -2.0
-
Stunted but not wasted (stunted only) : WHZ ≥ -2.0 and HAZ < -2.0
Datasets were transformed into a standard format and saved as comma-separated-value (CSV) files using the spreadsheet module of OpenOffice version 4.1.3. All other data-management tasks were performed using purpose-written R language (version 3.4.2) scripts managed using the R Analytic-Flow scientific workflow system (version 3.1.1).
The degree of overlap between wasting, stunting, and underweight in surveys
The degree of overlap between wasted, stunted and underweight was examined using a Venn diagram [24]. The main purpose of this analysis was to determine the magnitudes of the sets:
where ∩ denotes intersection. A ∩ B is the set that contains all members of A that are also members of B (or, equivalently, all members of B that are also members of A). Intersection is the set theory equivalent of the Boolean AND operation.
The maximum possible WAZ in children with WaSt using the WHO growth standards
The maximum expected WAZ for any child aged between 6 and 59 months with WaSt was explored using the WHO growth standards. The height required to give HAZ = − 2.0 at all ages between 6 and 59 months was found using the WHO height-for-age reference data. The weight at each height required to give WHZ = − 2.0 was found using the WHO weight-for-height reference data. These weights were then used to find the age specific WAZ for children aged between 6 and 59 months with both WHZ = − 2.0 and HAZ = − 2.0. Separate analyses were performed for males and females.
The association between being wasted and being stunted
The association between being wasted and being stunted was explored by calculating country-specific odds ratios. The odds ratio (OR) was used as a measure of the strength and direction of association because it is symmetrical (i.e. the OR for being wasted given stuntedness and the OR for being stunted given wastedness are identical). Use of the OR avoids the question of what comes before and what comes after, which is not answerable with cross-sectional data. The country-specific ORs were pooled using a random effects meta-analysis [25, 26]. A random effects model was used because WHZ is known to be associated with body-shape which is known to vary between populations [27, 28].
The severity of wasting and stunting in WaSt cases
The severity of wasting in wasted only and WaSt children, and the severity of stunting in stunted only and WaSt children were compared. Robust estimators of location and scale were calculated and non-parametric tests used because the distributions of both WHZ and HAZ were right-truncated (i.e. at − 2 z-scores) and severely non-normal. Effect sizes were evaluated using the Common Language Effect Size (CLES) statistic [29]. CLES estimates the probability that a random value drawn from one group will be greater than a random value drawn from a second group. The null (i.e. no difference) value is 0.5. A bootstrap estimator of the CLES was used.
The prevalence of WaSt by age and sex
The prevalence of WaSt by sex was investigated by calculating a male to female prevalence ratio (i.e. the prevalence of WaSt in males divided by the prevalence of WaSt in females). Country-specific prevalence ratios were calculated for countries with a total of 30 or more WaSt Cases. These were pooled using an inverse variance weighted average fixed effects meta-analysis [26]. The prevalence of WaSt by age and sex was investigated using a pyramid plot of data from all datasets from all countries. Age-specific male to female prevalence ratios were also calculated.
Using weight-for-age and mid-upper arm circumference to detect cases of WaSt
Weight-for-age is widely used in growth monitoring and promotion (GMP) programs and in paediatric clinics [30,31,32,33]. MUAC is widely used for community-based case-finding and deciding admission into therapeutic feeding programs [34]. The performance of WAZ and MUAC for detecting cases of WaSt was examined by calculating the sensitivity and specificity of WAZ and MUAC below systematically varied thresholds for detecting cases of WaSt. Thresholds ranged between the 0.5th percentile and the 99.5th percentile of the variable of interest in steps of 0.1 z-scores for WAZ and 1 mm for MUAC. The sensitivity and specificity estimated at each threshold were plotted as receiver operating characteristic (ROC) curves [35]. Areas under the curve (AUC) were estimated for each ROC curve using the trapezoidal rule [36]. Optimal thresholds were identified using the maximum observed value of Youden’s Index [37, 38]. Youden’s Index is a function of both sensitivity and specificity:
and is a commonly used measure of diagnostic effectiveness. The maximum value of Youden’s Index occurs at the threshold that optimizes a test’s differentiating ability when equal weight is given to sensitivity and specificity. It occurs at the point on the ROC curve with the maximum vertical distance from the diagonal (chance) line.
All data analysis was performed using purpose-written R language (version 3.4.2) scripts managed using the R Analytic-Flow scientific workflow system (version 3.1.1).
Results
A large database of 2426 survey datasets collected in 51 countries between 1992 and 2015 with data from 1,796,991 children was compiled. Table 1 describes the database used in the reported analyses.
All children who were simultaneously wasted and stunted were also underweight (see Fig. 1). No child in the database with WHZ < − 2 and HAZ < − 2 had a WAZ ≥ − 2.

Venn diagram showing the relations between sets of children who are wasted, stunted and underweight in all 51 countries (n = 1,796,991)*. * Wasted (weight-for-height z-score < − 2.0), stunted (height-for-age z-score < − 2.0), and underweight (weight-for-age z-score < − 2.0) were defined using z-scores calculated using the WHO growth standards. The number of cases in each division is reported. The zero cell indicates that all WaSt cases were also underweight
The maximum WAZ in children who are simultaneously wasted and stunted was WAZ ≈ − 2.36 for males and WAZ ≈ − 2.42 for females when the WHO growth standards are used. Low WHZ and low HAZ have a joint effect on WAZ which varies with age and sex (see Fig. 2).
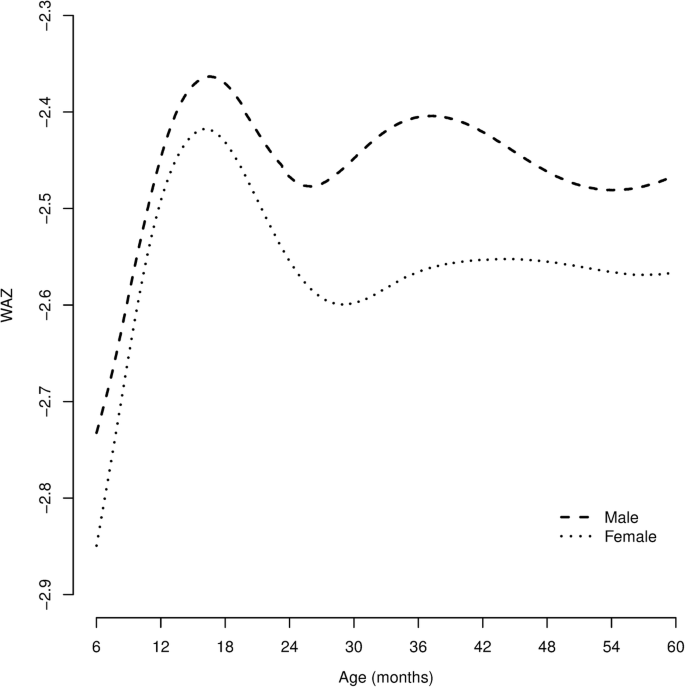
Weight-for-age z-score (WAZ) at different ages for males and females aged between 6 and 59 months with WHZ = − 2.0 and HAZ = − 2.0 calculated using the WHO growth standards. All WaSt cases must also be underweight (i.e. present with WAZ < − 2.0)
Significant positive associations between being wasted and being stunted were found in 37 of the 51 countries represented in the database. No significant association was found in 13 countries. A significant negative association was found in one country (Kenya). The pooled estimate of the odds ratio between being stunted and being wasted was 1.40 (95% CI = 1.32–1.49). Detailed results are presented in Table 2.
The median WHZ in wasted only cases was − 2.47 compared to − 2.52 in WaSt cases (p < 0.0001) with probability of superiority = 0.522 (95% CI = 0.519–0.525) The median HAZ in stunted only cases was − 2.81 compared to − 2.98 in WaSt cases (p < 0.0001) with probability of superiority = 0.555 (95% CI = 0.554–0.556).
The male to female WaSt prevalence ratio found in 46 countries for which sufficient data (i.e. n ≥ 30 WaSt cases) was available are shown in Table 3. The pooled analysis showed the male to female prevalence ratio for WaST to be 1.63 (95% CI = 1.63–1.65). Figure 3 shows prevalence of WaSt by age and sex found in all 51 countries with age-specific male to female prevalence ratios.
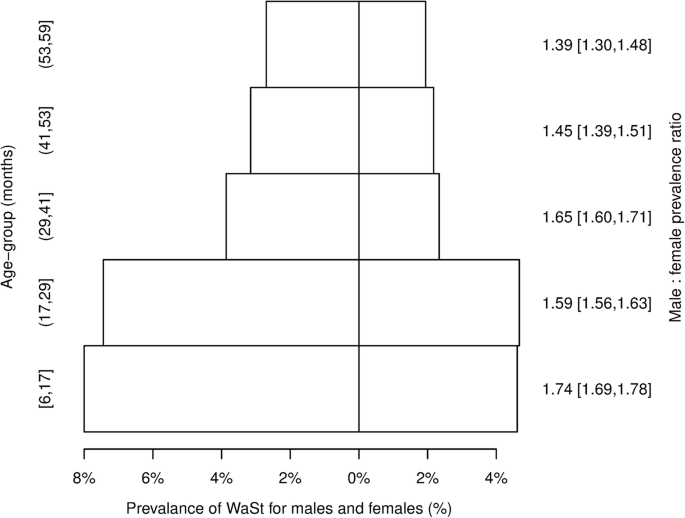
Male and female WaSt prevalence by age group in all 51 countries. Intervals (ranges) are expressed in ISO 31–11 form. The form (a, b) expresses the interval a < x ≤ b. For example, (17, 29) is used to represent the set {18, 19, 20, 21, 22, 23, 24, 25, 26, 27, 28, 29} of ages in months. Year-centred age-groups are used. The form (a, b) expresses the interval a ≤ x ≤ b. For example, [1.69, 1.78] is used to represent a 95% confidence interval that ranges between 1.69 and 1.78
The sensitivity and specificity for detecting cases of WaSt at the thresholds identified using Youden’s Index (i.e. WAZ < − 2.6, MUAC < 133 mm) are shown in Table 4. The areas under the ROC curves are 0.9726 for WAZ and 0.8759 for MUAC.
Discussion
The set:
are identical to each other. The category of “multiple anthropometric deficits [16]”:
is not, therefore, different from the WaSt category:
Other workers have noted that “a child cannot simultaneously experience stunting and wasting and not be underweight” but have not formally demonstrate this [39]. It seems sensible to abandon the category of “multiple anthropometric deficits” in favour of WaSt which is both simpler and more descriptive. Mortality estimates calculated for “multiple anthropometric deficits” will also apply for WaSt. Table 5 shows the pooled hazard ratios for wasted only, stunted only, and WaSt from the original work on “multiple anthropometric deficits” [16]. There appears to be a strong interaction effect of wasting and stunting on mortality. This suggests that a common mechanism may link wasting and stunting to an increased risk of death [11]. WaSt children are “at a heightened risk of mortality and may benefit most from nutrition and other child survival interventions” [16]. The observed hazard ratio for WaSt is comparable to that observed in children with severe wasting defined as WHZ < − 3 (hazard ratio = 12.75, 95% CI = 10.48–15.50) [40]. The high mortality associated with WaSt (i.e. pooled hazard ratio = 12.25, 95% CI = 7.67–19.58) compared to not stunted, wasted, or underweight children [16] means that stunted children with moderate wasting should be treated as a priority group for curative interventions.
Wasting and stunting were found to be positively and significantly associated with each other in most (i.e. 37 of 51) of the countries from which data were available. The pooled estimate of the odds ratio between stunting and wasting was 1.40 (95% CI = 1.32–1.49). The direction of causality cannot be addressed using cross-sectional data but the results are consistent with WaSt being something other than coincidental wasting and stunting.
WaSt cases were both more severely wasted than wasted only cases, and more severely stunted than stunted only cases. Effect sizes are small and are probably insufficient to account for the heightened risk of mortality for WaSt shown in Table 5. This suggests a multiplicative rather than an additive interaction between wasting and stunting is occurring.
The male to female prevalence ratio for WaSt was significantly greater than one in most (i.e. 40 of 46) of the countries from which sufficient data were available. In no country was the male to female prevalence ratio significantly below one and all point estimates were above one. The pooled male to female prevalence ratio was 1.63 (95% CI = 1.60–1.65). WaSt appears to be a condition affecting males more than females. The pattern of prevalence by age and sex shown in Fig. 3 was consistently found in country-specific analyses. WaSt appears to be a condition that affects children aged below 30 months more than it does older children.
Both WAZ and MUAC performed better than chance at detecting cases of WaSt. The performance of WAZ was superior to that of MUAC. Cases of WaSt attending, for example, GMP programs and paediatric clinics could be detected with excellent sensitivity and good specificity using WAZ. Cases of WaSt could be detected in the community using MUAC but with only moderate sensitivity and specificity.
Limitations
The narrow scope of the datasets limited the analyses that could be performed. The cross-sectional nature of the data means that no definitive statements about causality could be made. The database was compiled from survey datasets from emergency and post-emergency settings collected for programmatic reasons and provided by agencies that have a policy of archiving survey data and reports, and who are willing to share their data. The database should be treated as ‘found data’ that is subject to a number of selection biases. Results should, therefore, be interpreted with appropriate caution.
Conclusions
The key findings of the analysis presented in this article are that WaSt and “multiple anthropometric deficits” are the same condition, wastedness and stuntedness are positively associated with each other, WaSt cases have more severe wasting than wasted only cases. WaSt cases have more severe stunting than stunted only cases, WaSt is largely a disease of younger children and of males, and that WaSt can be detected with excellent sensitivity and good specificity using WAZ.
The use of WAZ < − 2 in the case-definition for “multiple anthropometric deficits” introduces a redundant term into the case-definition and the category should be abandoned in favour of the simpler and more descriptive category of WaSt.
There is no pressing need for studies to estimate excess mortality associated with WaSt since the available estimates for “multiple anthropometric deficits” may be used [16].
The heightened risk of mortality associated with WaSt means that further work on the aetiology, prevention, case-finding, and treatment of children with WaSt as well as the extent to which current interventions are reaching children with WaSt is urgently required. Work on the mechanisms of the interaction between wasting and stunting on mortality may also prove useful. Work on mortality could be done ethically using data from historical cohort studies.
Treatment of moderate wasting in stunted children should be regarded as a public health priority. Urgent consideration should be given to expanding the admission criteria of therapeutic feeding programs to include children who are WaSt. This could be achieved by admitting children with low WAZ identified in paediatric clinics, in GMP programs operating at clinics sites, and in the community. The WAZ threshold used for this purpose could be decided by examination of mortality data from historical cohort studies. The use of MUAC and WAZ is compatible with recent recommendations regarding entry criteria for programs treating SAM in infants aged under six months [41, 42]. How best to identify WaSt cases in community settings with no GMP program or a GMP program achieving only low coverage warrants further investigation.
Work on treatment effectiveness, duration of treatment, and relapse after cure for WaSt cases should be undertaken. Much of this could be done using existing program data since many WaSt cases may already be admitted to CMAM programs [43].
Consideration should be given to encouraging the routine reporting of the prevalence of WaSt from nutritional anthropometry surveys, broader surveys (e.g. Multiple Indicator Cluster Surveys and Demographic and Health Surveys), surveillance systems, and other nutrition information systems that collect and report on anthropometric data.
Abbreviations
- ACF:
-
Action Contre la Faim (Action Against Hunger)
- AUC:
-
Areas under the curve
- CLES:
-
Common Language Effect Size
- CMAM:
-
Community-based Management of Acute Malnutrition
- CSV:
-
Comma-separated-value
- DALY:
-
Disability adjusted life year
- ENN:
-
Emergency Nutrition Network
- FSNAU:
-
Food Security and Nutrition Analysis Unit
- GMP:
-
Growth monitoring and promotion
- HAZ:
-
Height-for-age z-score
- IMC:
-
International Medical Corps
- M&E:
-
Monitoring and evaluation
- MSF:
-
Médecins Sans Frontières
- MUAC:
-
Mid-upper arm circumference
- NCHS:
-
National Centre for Health Statistics
- OR:
-
Odds ratio
- PPS:
-
Population proportional sampling
- ROC:
-
Receiver operating characteristic
- SAM:
-
Severe acute malnutrition
- SC:
-
Save the Children
- SENS:
-
Standard Expanded Nutrition Survey
- SMART:
-
Standardised Monitoring of Assessment of Relief and Transitions
- TDH:
-
Terre des Hommes
- UNHCR:
-
United Nations High Commissioner for Refugees
- UNICEF:
-
United Nations Children’s Fund
- WaSt :
-
Concurrent wasting and stunting
- WAZ:
-
Weight-for-age z-score
- WHO:
-
World Health Organisation
- WHZ:
-
Weight-for-height z-score
References
Development Initiatives, Global Nutrition Report 2017 : Nourishing the SDGs, Development Initiatives, Bristol, UK, 2017.
Briend A, Collins S, Golden M, Manary M, Myatt M. Maternal and child nutrition. Lancet. 2013;382(9904):1549.
Isanaka S, Boundy EO, Grais RF, Myatt M, Briend A. Improving Estimates of Numbers of Children With Severe Acute Malnutrition Using Cohort and Survey Data. Am J Epidemiol Dec. 2016;184(12):861–69.
Hure A, Oldmeadow C, Attia J. Invited commentary: improving estimates of severe acute malnutrition requires more data. Am J Epidemiol. 2016;184(12):870–2.
Black RE, Allen LH, Bhutta ZA, Caulfield LE, de Onis M, Ezzati M, Mathers C, Rivera J. Maternal and child undernutrition: global and regional exposures and health consequences. Lancet. 2008;371(9608):243–60.
IFPRI, Global Nutrition Report 2016. From Promise to Impact: Ending Malnutrition by 2030. Washington DC: International Food Policy Research Institute. p. 2016.
Shoham J, Dolan C, Gostelow L. The Management of Acute Malnutrition at Scale: A Review of Donor and Government Financing Arrangements. London: Humanitarian Policy Network. p. 2013.
Menon P, Stoltzfus RJ. Building convergence in science, programs, and policy actions on child undernutrition: symposium rationale and overview. Adv Nutr. 2012;3(2):224–6.
Bergeron G, Castleman T. Program responses to acute and chronic malnutrition: divergences and convergences. Adv Nutr. 2012;3(2):242–9.
Khara T, Dolan C. The relationship between wasting and stunting, policy, programming and research implications. Oxford: Technical Briefing Paper, Emergency Nutrition Network. p. 2014.
Briend A, Khara T, Dolan C. Wasting and stunting - similarities and differences: policy and programmatic implications. Food Nutr Bull. 2015;36(S1):S15–23.
Victora CG. The association between wasting and stunting: an international perspective. J Nutr. 1992;122(5):1105–10.
Martorell R, Young MF. Patterns of stunting and wasting: potential explanatory factors. Adv Nutr. 2012;3(2):227–33.
Angood C, Khara T, Dolan C, Berkley JA. Research priorities on the relationship between wasting and stunting. PLoS One. 2016;11(5):e0153221.
IFPRI. Global nutrition report 2015: Actions and Accountability to Advance Nutrition & Sustainable Development. Washington DC: International Food Policy Research Institute; 2015.
McDonald CM, Olofin I, Flaxman S, Fawzi WW, Spiegelman D, Caulfield LE, Black RE, Ezzati M, Danaei G. The effect of multiple anthropometric deficits on child mortality: meta-analysis of individual data in 10 prospective studies from developing countries. Am J Clin Nutr. 2013;97(4):896–901.
Khara T, Mwangome M, Ngari M, Dolan C. Children concurrently wasted and stunted: a meta-analysis of prevalence data of children 6-59 months from 84 countries. Maternal and Child Nutrition. 2018;14:e12516.
Dibbley MJ, Goldsby JB, Staehling NW, Trowbridge FL. Development of normalised curves for the international growth reference: historical and technical considerations. Am J Clin Nutr. 1987;46:736–48.
WHO, WHO Child Growth Standards: LFH, LFA, WFA, WFL, WFH, and BMI/A: Methods and development, WHO, Geneva, Switzerland, 2006.
WHO Multicentre Growth Reference Study (MGRS) Group, de Onis M. WHO child growth standards based on length/height, weight and age. Acta Paediatr. 2006;95(S450):76–85.
Wilkinson C, Andresen E, Oman A, Mattinen H, Porteaud D, Schilperoord M, Spiegel P. UNHCR standardised expanded nutrition survey (SENS) guidelines for refugee populations. Geneva: UNHCR. p. 2013.
Médecins Sans Frontières, Nutrition Guidelines, Paris, France, 1995.
Golden M, Brennan M, Brennan R, Kaiser R, Mone C, Nathan R, Robinson WC, Woodruff B, Seaman J, Measuring mortality, nutritional status, and food security in crisis situations: SMART methodology version 1, SMART Project, 2006.
Venn J. On the diagrammatic and mechanical representation of propositions and reasonings, London Edinburgh Dublin philosophical magazine and. J Sci. 1880;10:1–18.
DerSimonian R, Laird N. Meta-analysis in clinical trials. Control Clin Trials. 1986;7(3):177–88.
Higgins JPT, Green S. Cochrane handbook for systematic reviews of interventions. Chichester: The Cochrane Collaboration and John Wiley & Sons Ltd. p. 2008.
Eveleth PB, Tanner JM. Worldwide variation in human growth. 2nd ed. Cambridge: Cambridge University Press. p. 1990.
Myatt M, Duffield A, Seal A, Pasteur F. The effect of body shape on weight-for-height and mid-upper arm circumference based case definitions of acute malnutrition in Ethiopian children. Ann Hum Biol. 2008;36(1):5–20.
McGraw KO, Wong SP. A common language effect size statistic. Psychol Bull. 1992;111(2):361–5.
Ashworth A, Shrimpton R, Jamil K. Growth monitoring and promotion: review of evidence of impact. Maternal & Child Nutrition. 2008;4(Suppl 1):86–117.
WHO/UNICEF, Handbook : IMCI Integrated Management of Childhood Illness, Department of Child and Adolescent Health and Development (CAH), WHO, Geneva, Switzerland, 2005.
de Onis M, Wijnhoven T, Onyango AW. Worldwide practices in child growth monitoring. J Paediatr. 2004;144:461–5.
de Onis M, Onyango A, Borghi E, Siyam A, Blössner M, Lutter C. Worldwide implementation of the WHO child growth standards. Public Health Nutr. 2012;15(9):1603–10.
WHO/UNICEF, WHO child growth standards and the identification of severe acute malnutrition in infants and children: A Joint Statement by the World Health Organization and the United Nations Children’s Fund, WHO, Geneva, 2009.
Metz CE. Basic principles of ROC analysis. Semin Nucl Med. 1978;8:283–98.
Atkinson KE. An introduction to numerical analysis. 2nd ed. Hoboken, New Jersey: John Wiley & Sons; 1989.
Youden WJ. Index for rating diagnostic tests. Cancer. 1950;3:32–5.
Schisterman EF, NJm P, Liu A, Bondell H. Optimal cut-point and its corresponding Youden index to discriminate individuals using pooled blood samples. Epidemiology. 2005;16:73–81.
Nandy S, Irving M, Gordon D, Subramanian SV, Davey Smith G, Poverty, child undernutrition and morbidity: new evidence from India, bulletin of the World Health Organization, 2005;83(3):210–216.
Olofin I, McDonald CM, Ezzati M, Flaxman S, Black RE, Fawzi WW, Caulfield LE, Danaei G. Associations of suboptimal growth with all-cause and cause-specific mortality in children under five years: a pooled analysis of ten prospective studies. PLoS One. 2013;28(5):e64636.
Mwangome M, Ngari M, Fegan G, Mturi N, Shebe M, Bauni E, Berkley JA. Diagnostic criteria for severe acute malnutrition among infants aged under 6 mo. Am J Clin Nutr. 2017;105(6):1415–23.
Lelijveld N, Kerac M, McGrath M, Mwangome M, Berkley JA. A review of methods to detect cases of severely malnourished infants less than 6 months for their admission into therapeutic care. Oxford, UK: Emergency Nutrition Network. p. 2017.
Binns PJ, Dale NM, Banda T, Banda C, Shaba B, Myatt M. Safety and practicability of using mid-upper arm circumference as a discharge criterion in community based management of severe acute malnutrition in children aged 6 to 59 months programmes. Archives of Public Health. 2016;74:24.
Acknowledgements
Data was provided by agencies listed in Table 1. UNHCR is the source of some of the data used in this article. UNHCR does not warrant in any way the accuracy of the data or information reproduced from the data provided by them and may not be held liable for any loss caused by reliance on the accuracy or reliability thereof.
Funding
This study was funded by the United States Agency for International Development (USAID), Grant Number: ENN AID-OFDA-G-15-00190, and Irish Aid. The contents of this paper are the responsibility of the authors and do not necessarily reflect the views of USAID or the United States Government, nor those of Irish Aid or the Irish Government. The funders had no role in study design; collection, analysis, and interpretation of data; the decision to publish; or preparation of the manuscript.
Availability of data and materials
The data used in this study are available from the corresponding author on reasonable request. Data users may, however, be required to seek permissions from the original data providers.
Author information
Authors and Affiliations
Contributions
The study was conceived and designed by AB, TK, SS, SP, CD, and MM. The data were analysed by MM and SS. MM and TK wrote the first draft of the manuscript and are responsible for the final content. All authors read and approved the final manuscript.
Corresponding author
Ethics declarations
Ethics approval and consent to participate
This study performed a secondary analysis of data that had already been collected for prevalence assessment in emergency and development settings. No persons could be identified from the data. No clinical data were used. No experiments were performed on human subjects. Ethical approval for the work described in this article is not required under the Declaration of Helsinki (all revisions) and was not sought. Whenever possible, data were collected following ethical approval from locally responsible ethics committees. Some data were collected during complex emergencies when no locally responsible ethics committees were operating. In these cases ethical approval was granted solely by the institutional review bodies of the non-governmental organization (NGO) or United Nations organization (UNO) which collected the data. Permissions were sought and given by local ministries of health and, where appropriate, by local police departments and military and / or paramilitary commanders. Identifying data were collected for programmatic purposes (i.e. for recruitment of cases of acute malnutrition into feeding programs) but this data was either not entered or was removed prior to data being made available for analysis. Participation in the surveys was voluntary. Children were not (and could not be) measured without the consent of their parents or guardians. Verbal informed consent was sought from the primary caregiver of the child. Written consent is almost never sought in these types of survey: It is usually not required and levels of literacy are often low. The existence of the data is proof of consent.
Consent for publication
Not applicable.
Competing interests
The authors declare that they have no competing interests.
Publisher’s Note
Springer Nature remains neutral with regard to jurisdictional claims in published maps and institutional affiliations.
Rights and permissions
This article is published under an open access license. Please check the 'Copyright Information' section either on this page or in the PDF for details of this license and what re-use is permitted. If your intended use exceeds what is permitted by the license or if you are unable to locate the licence and re-use information, please contact the Rights and Permissions team.
About this article

Cite this article
Myatt, M., Khara, T., Schoenbuchner, S. et al. Children who are both wasted and stunted are also underweight and have a high risk of death: a descriptive epidemiology of multiple anthropometric deficits using data from 51 countries. Arch Public Health 76, 28 (2018). https://doi.org/10.1186/s13690-018-0277-1
Received:
Accepted:
Published:
DOI: https://doi.org/10.1186/s13690-018-0277-1