
Abstract
Textbooks in physical chemistry start from the treatise of the ideal gas. Gaseous compounds are important reactants and products of (bio)chemical reactions, and thus their absolute amounts are needed to establish mass balances. However, in contrast to solid, for dissolved and liquid compounds, their qualitative and especially quantitative analysis is less widely established in biological and chemical laboratories. This can be mainly ascribed to the seemingly simple chemical nature of gaseous compounds that is in contrast to the effort needed for their precise quantification. In this article, we will guide the reader through the considerations and steps needed to perform a meaningful analysis of multicomponent gas mixtures, which are reactants for or products of (bio)chemical reactions in aqueous solutions in the laboratory environment and scale. After a brief introduction, special focus is set on the methods for quantification and calculations needed to derive absolute amounts of gases in a mixture. The overall concept will be exemplified by biogas production as well as by an electroorganic reaction (Kolbe electrolysis of n-hexanoic acid), and general pitfalls will be highlighted.
Introduction
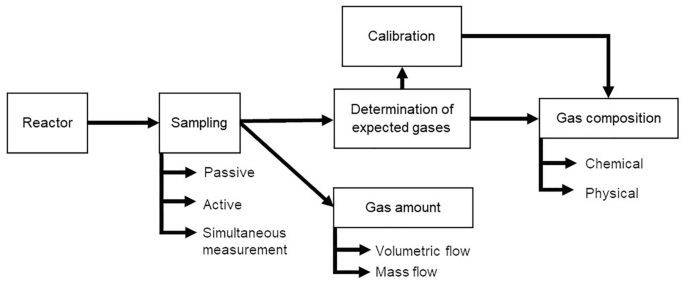
Gas analysis can be defined as the qualitative and quantitative determination of the composition of a gas phase. This gas phase can either be pure, that is, containing one type of gas molecules, or it can be a multicomponent system, meaning that it comprises several gaseous compounds in different proportions (see Fig. 1).Footnote 1 Often we know the (bio)chemistry that leads to the consumption or production of gaseous reactants. Thus, the identity of the components in a multicomponent mixture is known or we are interested only in one or a few specific gaseous compounds. If the chemical identity of a compound needs to be determined, this information can be gained by different methods including chromatography, mass spectrometry or spectroscopy [1,2,3]. This identification of gases is not discussed in this article, and we refer the reader to the literature, for instance [4, 5]. In the following we assume that all gaseous components are known.

Quantitative measurements of gases are often an analytical challenge, especially when multicomponent systems are investigated and data of absolute gas quantities are required [7]. The acquisition of absolute gas quantities is indispensable to establish mass balances of (bio)chemical conversions involving gaseous reactants or products. To obtain absolute quantities of a gas mixture requires both information about the quantitative gas composition (absolute or relative values, see Table 1) and the total amount of gas (which usually means volume, \(v\), or rarely mass, \(m\)).
When looking at the quantitative chemical analysis of condensed phases, scales are extremely important. They permit the measurement of the mass of a sample as an absolute value at the given conditions. Normally, this gravimetric measurement is not possible for the analysis of gases. This is due to their low densities and hence masses as well as the lack of a defined volume and shape of the system to be analyzed. This means that there are only limited possibilities to weigh a gas phase. Gas mixtures can often be complex, but per se reach a chemical equilibrium quickly and then represent a homogeneous phase. This opens up the possibility of using volume instead of mass for quantitative gas analysis. Like masses, volumes can be measured precisely, provided that the compressibility of gases is considered. In addition to the number of moles of a gaseous component, the volume of a gas depends strongly on temperature and pressure. In many cases, especially under ambient conditions, we can describe the relation between these state variables by the ideal gas law (Eq. 1) [8].
According to the model of an ideal gas, gas molecules are not affected by intermolecular attractions. This is somewhat true for most gaseous compounds being analyzed in biological and chemical laboratories. Like all equations shown in this article, Eq. 1 is only valid when thermodynamic equilibrium is in place, including for instance the equilibration between the gas and liquid phases. Notably, it is not identical to steady state, and, strictly speaking, thermodynamic equilibrium is often not the case when gas analysis is performed. However, assumption of thermodynamic equilibrium is needed when performing gas analysis for practicability as well as to facilitate calculations. Therefore, time invariances are often leveled off by sequential analysis (see Sects. 4.2 and 4.3). In all cases, some particularities have to be considered in any analytical workflow for gas quantification. Gases spontaneously fill any free space and are often invisible and odorless. Therefore, the safe and defined containment of the measuring volume and the prevention of gas leaks for all experiments are of utmost importance, but often a challenge. Likewise, dead volumes, meaning the extra volumes of the experimental setup that do not contribute to the functionality of the system or that are not recorded by the used gas sensor, are always a source of uncertainty and error for gas quantification. Dead volumes must be recognized and avoided whenever possible when setting up the system. If this is not feasible, dead volumes need to be included in corrective calculations as we will illustrate below. As already mentioned above, the high compressibility of gases is an important property with effects that we cannot overestimate for precise gas measurement. Compressibility means that the volume of a gas changes as a function of the pressure it is exposed to [8]. Hence, any change in pressure has an immediate impact on the volume. As a consequence, temperature and pressure must be (1) known, (2) well defined and (3) constant during the entire gas analysis. Moreover, it must be ensured that temperature and pressure during the measurement are kept in a range in which the homogeneity of the gas phase is maintained. This means that condensation of components has to be avoided, which can be assured beforehand by estimating the dew point of the gas mixture to be analyzed (see Sect. 2.3) [9].
An arsenal of methods for the analysis of gases exists. Many of these are selective, meaning they are suitable to detect only one or a few gaseous compounds. This is particularly typical for industrial applications where only a few mostly known gases are of interest. These compounds are often determined in the process volume or volume stream without any separation from the gas mixture. This implies that the component to be determined exhibits a specific property that makes it suitable for selective detection in the industrial environment. Typical fields of application are heat gas industry for domestic use or natural gas industry [10] and chemical processes that involve the consumption or evolution of gaseous reactants, e.g., [11]. Since the handling of gases can generally be associated with considerable dangers, monitoring of diverse risk potentials (pressure, explosion limits, toxicity, etc.) is also important to provide workplace safety. Whereas specialized and routine methods dominate in industry, laboratories in academia require rather versatile but still very precise methods and workflows for gas analysis. Often mass balances have to be established to obtain information about reactions with gaseous reactants and unclear or unknown stoichiometry. In this case, we must reliably quantify all gaseous components.
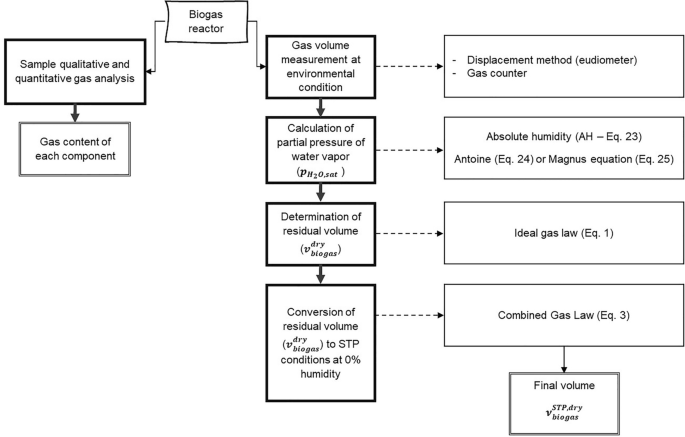
In this article, we consider the quantification of multicomponent gaseous systems that are gas mixtures in biological and chemical laboratory experiments at ambient conditions and aqueous environment. The examples are selected to illustrate a typical workflow for converting gas mixtures to reference conditions and 0% humidity (see Sect. 4.1) as well as multicomponent gas analysis in a laboratory (see Sect. 4.3). The workflow starts from sampling and concludes with the calculations needed for setting up a mass balance (Figs. 2 and 10).
Quantification of gas mixtures—basic principles
The focus of this contribution is on the quantification of gas mixtures. Therefore, we will first give a short overview of basic principles to be considered when gas volumes and the quantities of gaseous components are determined.
Pure substances
In thermodynamic equilibrium, the thermal state of any pure matter can be described unambiguously by its associated state variables volume (\(v\)), temperature (\(T\)), pressure (\(p\)) and mass (\(m\)) or amount of substance (\(n\)).
Changing the state variables independently from each other is impossible. The number of independent intensive variables needed to determine the system’s state, i.e., the number of degrees of freedom \((F)\), depends on the number of components \((C)\) and the number of phases in equilibrium \((P)\) according to Gibbs' phase rule F = C + 2 – P [8, 12]. For a pure phase and given amount of substance, two intensive state variables are sufficient for the unambiguous description of such a system (note that extensive variables are not degrees of freedom in the sense of the phase law). For instance, when considering the simple case of the ideal gas (Eq. 1), if temperature and pressure are given, the volume is automatically set and cannot be varied.
The mathematical expression for the relations between the thermal state variables for pure homogeneous systems are thermal state functions in the form \(f(p,T,v,n) = 0\). This means that we cannot change a state variable without effecting at least one of the other three variables. For a general description of state changes, the total differential of the state function can be applied. For volume changes, this results in Eq. 2:
For a given amount of substance \(n\) of a gas, the change in volume due to changes in \(p\) at constant \(T\) (which is isothermal) and due to change in \(T\), at constant \(p\) (which is isobaric) can be calculated stepwise. Therefore, the partial differentials need to be known, which can be complex for real gases.
For the ideal gas, the partial differentials can be easily derived, and hence the state function can be represented explicitly and in a particularly simple way as an equation of state, also known as the combined gas law (Eqs. 1 and 3). It allows calculating all states of an ideal gas as the empirically found laws of Gay-Lussac/Charles, Amontons, Boyle/Mariotte and Avogadro are unified therein (see also Table 2) [8].
\(R\) is the universal gas constant. It is the product of the fundamental constants of nature, Avogadro's constant and Boltzmann's constant, and thus, since the redefinition of the SI base units in 2019, also exactly defined, precisely to R = 8.31446261815324 J K−1 mol−1 = 8.31446261815324 Pa m3 K−1 mol−1 [13].
We have to note that for the ideal gas the molar volume \(V = v/n\) is independent of the gas type. Thus, one mole of gas at the same temperature and pressure has the same volume (Avogadro's law) and there is proportionality between amount of substance and volume. For the reference point of IUPAC standard conditions (STP), which are \(T = 273.15 \text{ }\mathrm{K}\) and \(p = \mathrm{100,000} \text{ }\mathrm{Pa}\), the molar volume of any ideal gas is \({V}^{\mathrm{STP}} = 22.711\text{ }\mathrm{ L }{\mathrm{mol}}^{-1}\) [14], see also Box 1.
Homogeneous mixtures
Gas phases with more than one component are homogeneously mixed phases. In addition to \(p,\text{ } T,\text{ } v,\text{ } n\) composition variables for each component \(i\) are required for their description. Absolute values or relative values can be used to characterize the chemical composition of mixtures (Table 1).
Absolute composition values are extensive, i.e., they change with the size of system and hence the amount of substance changes. The absolute values are partial values of the component (in the system), such as partial pressure or partial volume. In a narrower sense, masses and amounts of substances can also be referred to as partial. The general advantage of all partial values is their additivity. This means that the total sum for all components of a partial value describes the corresponding overall property of a system (for volumes, however, this is only valid under ideal conditions). Of special importance in gas analysis is the use of partial pressures. Again, the sum of all partial pressures is equal to the whole pressure in the system (Dalton's law, Eq. 4) [8].
In contrast to the absolute values, the relative composition values are intensive values. This means that they are not proportional to the size of the system (see also Box 2). Intensive values describe the content of a defined compound in a mixture irrespective of the system size using the concepts of fraction values or concentrations.
Fraction values are dimensionless and defined as the proportion of a certain component in relation to the entire mixture. Thus, values between 0 and 1—or 0% and 100%—are possible. A fraction of 0 means absence of the respective component, whereas 1 means that a pure substance is present. Logically, the sum of fractions of all components in a mixture must be 1. Therefore, for C components, only (C − 1) fraction values are sufficient to fully describe a composition. Fraction values are mostly used for \(m,\text{ } n\) and \(v\), but the concept is also useful for \(p\). This allows us to provide “pressure fractions” or synonymously “relative partial pressures” of a component (see above). For an ideal gas, these are equal to the mole fractions, but not for a real gas, where mixture-dependent apparent or excess properties such as apparent molar volumes must be taken into account (see also Sect. 4.1). Here, the expression of pressure fractions does not make sense and is often inappropriate or even misleading.
Concentration values are mostly given as the ratio of an extensive variable such as \(m,\text{ } n,\text{ } v\) to the total volume. This has the consequence that, because the volume of gases is strongly dependent on environmental variables, these quantities are strongly dependent on temperature and pressure as well. The general advantage, however, is that intensive variables are created, i.e., the homogeneous mixture can be described independently of the size of the system. It should be noted that the volume concentration, \({\varphi }_{i}\), only coincides with the partial volume fraction, \({\sigma }_{i}\), for an ideal gas. In all real gas phases and even more in condensed phases, these two values are not identical. This is because by definition the total volume in volume concentrations always refers to values after mixing, while the total volume in volume fractions refers to values before mixing. Again, this illustrates the difference between intensive and extensive properties [8].
Heterogeneous mixtures
Heterogeneous mixed phases often play a major role in the analysis and description of gas phase compositions, as exemplified in Sect. 4.3. This applies in particular to the coexistence of mixed phases of liquids and gases. Due to the vapor pressures of all components in the liquid phase, corresponding partial pressures of these components are to be expected in the gas phase. The vapor pressure is an intrinsic property for a substance and depends strongly on the temperature, but not on the gas volume. For an ideal liquid mixture and an ideal behavior of the gas phase, the partial pressure of each component is equal to the product of the saturated vapor pressure of the pure component and its mole fraction in the liquid phase. This relationship is Raoult’s law (Eq. 15) [8].
Raoult’s law applies if the liquid phase is nearly pure or if very similar compounds (size, shape, polarity) are mixed. In contrast, especially for mixtures including water and organic solvents, it cannot be used. Generally, for real conditions, two correction factors for molecular interactions need to be applied: (1) For real gas behavior, the partial pressure is corrected by a fugacity coefficient to obtain the effective partial pressure (fugacity \(f\) of the component replaces partial pressure). (2) The non-ideal behavior of the liquid mixture is corrected by using an activity coefficient to describe the effective composition in a liquid phase (activity \(a\) of the component replaces its molar fraction). The interested reader can find more detailed information about this in literature, e.g., Wedler (1997) [16].
If ideal gases and liquids are in equilibrium with each other, the laws of Dalton and Raoult can be combined (with \({x}_{i}\) and \({y}_{i}\) as mole fraction in the liquid phase and gas phase, respectively) and lead to:
Equation 16 also allows the determination of the dew point of a gas mixture. The dew point is the temperature and pressure at which a first liquid droplet from a homogeneous gas mixture may condense. Knowing the dew point is of great importance, as gas analyses should generally be performed well above the dew point temperature (at a given pressure) or below the dew point pressure (at a given temperature) to avoid phase separation during analysis. Dew points can be determined using a system of two linear equations deduced from Eq. 16 and the boundary condition for mole fractions [8]:
For dew pressure, the system of equations mentioned above can be solved for a given complete set of \({y}_{i}\) and \({p}_{i}^{\mathrm{sat},*}\) at a specified temperature (Eq. 18).
In contrast, the dew temperature can only be calculated iteratively. Using a given complete set of \({y}_{i}\) and \({p}_{i}^{\mathrm{sat},*}\) at several temperatures around the assumed dew temperature, \({p}_{i}^{\mathrm{sat},*,f\left(\mathrm{temp}\right)}\) has to be approximated until Eq. 19 is valid [8].
Methods for gas measurements in chemical and biological laboratories
In general, gases can be analyzed regarding their quantity (usually volume) and their quality (composition). There is a whole arsenal of methods to determine gas volumes in the laboratory experiments available; most of these rely on displacement and are discussed in Sect. 3.1.
The sampling methods for the qualitative determination of different components can be divided into active sampling with or without enrichment, passive sampling or sampling with simultaneous measurement (Fig. 3, Sect. 3.2). Which sampling technique is the most suitable depends on various factors such as the concentration and reactivity of the components, accompanying gases to be analyzed or the environmental conditions such as temperature and humidity as well as the availability of equipment. When taking samples with simultaneous measurement, a distinction can be made among the use of test tubes, sensors and spectroscopic or chromatographic methods [1]. The active sampling in laboratories is most often carried out using gasometers, gas collection tubes or similar gas collection containers such as gas bags. Another method of active sampling is the collection of the compound of interest using adsorption materials [1, 17].
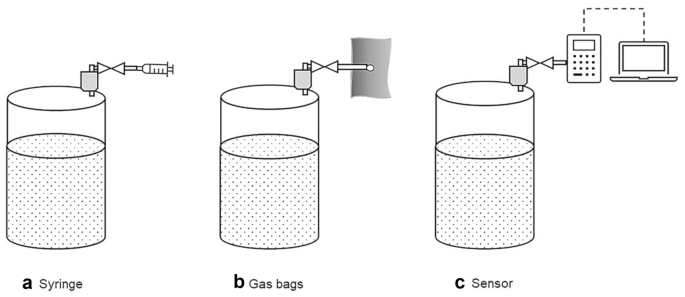
Examples for sampling methods: active sampling without enrichment using a a syringe and b gas bags and c sampling with online measurement using a sensor
How to measure the gas volume
Measurement of gas volume is commonly used. Reporting the gas volume is easy to understand and for process engineering has many practical advantages as it facilitates data exchange from laboratory to technical scale, for instance for the biogas process (see Sect. 4.1). Walker et al. evaluated the potential errors associated with the measurement of volume and calculation for the quantitative analysis of biogas. These include the measurement inaccuracy due to gas diffusion and the potential errors of volume calculation when converting the obtained values to STP conditions [18].
As the following paragraphs show, a variety of methods exist for the measurement of gas volumes. Given that the gas volume is pressure- and temperature-dependent, as discussed above, it is indispensable that both values be reported for each data point.
For measuring the volume of a gas in laboratories in academia, liquid displacement devices are commonly used, since they are inexpensive and easy to set up. However, the operation of simple liquid displacement devices is labor intensive and the accuracy is highly operator-dependent [18, 19].
The liquid displacement method is used to determine the volume of gases independent of its composition. The basic principle is shown in the example devices presented in Fig. 4. Commonly, the gas produced in a reactor is passed at the same pressure and temperature into a displacement tank that is filled with liquid, the so-called barrier solution. This leads to displacement of the barrier solution, which is quantified. The difference between the initial and final volume of the barrier solution corresponds to the volume of the produced gas. Different complexities of measurement setups for the displacement method are feasible and also include gravimetric measurements, as Fig. 4B shows.
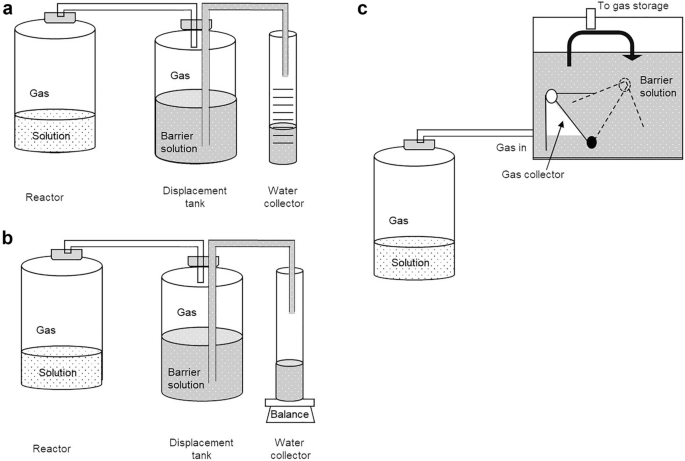
The accuracy of the measurement depends on the specific measuring device. Regardless of the complexity of the setup, the displacement method also permits the recording of the gas volume over time. Furthermore, the entire gas produced is collected in the displacement tank allowing determination of its composition (see Sect. 3.2). This allows the calculation of the absolute amount for each gaseous component. However, it is not possible to track the quantities of gaseous substances over time. Thus, whether the emission of certain components changes or remains constant over the duration of the measurement cannot be resolved. Furthermore, also intermittent gaseous reactants that are formed and subsequently consumed are not detected. An alternative to overcome this drawback is using more sophisticated and thus costly equipment. This comprises for instance Milligascounters (Fig. 4C) fitted with a tipping bucket that is also based on the displacement principle. In summary, displacement methods are robust and yield the total amount for each gaseous component at the end of the experiment.
Another important point that should be noted using the displacement method for the quantification of the gas volume is the reactivity as well as the solubility of some compounds in the barrier solution, which depends, for example, on its pH value. The solubility can be predicted with knowledge of Henry's constants in different solutions. Henry’s law states that at a constant temperature, the amount of dissolved gas in a volume of a specified liquid is directly proportional to the partial pressure of the gas in equilibrium with the liquid. Looking at Henry's law constants of some species in water at ambient temperature (CO2: 3.6 × 10⁻⁴ mol m−3 Pa−1; n-hexanoic acid: 7.5 mol m−3 Pa−1; n-butyric acid: 9.7 mol m−3 Pa−1), the effect of gas solubility can be estimated. This effect can cause major errors, since the absolute amount of dissolved gas can be considerable [21, 22]. This needs to be considered when setting up the experiment and, according to the requirements, an acidified, alkaline or supersaturated saline barrier solution should be used. With an alkaline barrier solution, it is possible, for example, to dissolve the CO2 from the gas stream as bicarbonate and thus exclude it from the volume measurement. Furthermore, a correction to the ambient temperature and the ambient pressure is necessary for all gas volumes being determined by displacement methods. It must further be noted that when using aqueous barrier solutions, water vapor (humidity of the gas) also plays a role and has to be included in the calculations (see Sect. 4.1).
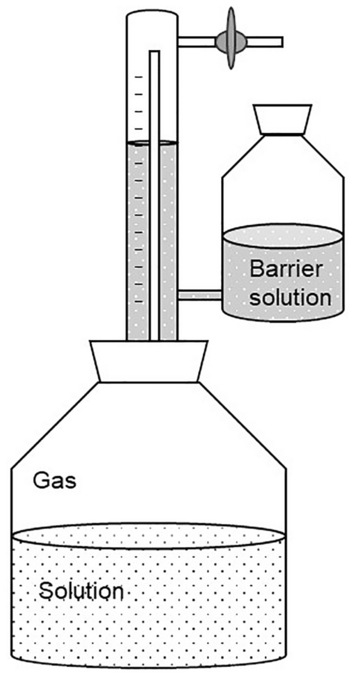
Still, the Eudiometer unit (Fig. 5) is an important example for the widely applied displacement method that is even described in international standards and thus is of regulatory relevance [23, 24]. The apparatus consists of a reactor that is connected to a sealed graduated gas collecting tube and a reservoir tank that is open to the atmosphere. Biogas produced in the reactor (see Box 4) passes from the headspace of the bioreactor to the headspace of the graduated gas collecting tube displacing the barrier solution in the reservoir tank. After pressure equalization, i.e., the same liquid level of the barrier solution, the volume of the displaced barrier solution is equivalent to the corresponding biogas volume. This method requires a specific adjustment of the barrier solution and allows achieving highly accurate results. Thus, it is a well established but labor-intensive method [21, 22].
Eudiometer unit [25]
Among the more advanced techniques, one alternative method that we want to highlight here to determine the gas volume is using thermal mass flow meters (MFM). These allow the measurement of the mass flow directly and in real time. This has the advantage that the measurement is independent of temperature and pressure [26]. Yet, in contrast to the displacement method presented above, for the measurement with MFM, information on the gas composition is required.
There are two main measuring principles of thermal MFM; one is the bypass principle and the other is constant temperature anemometry (CTA) [26]. Both principles are based on two temperature measurements located in the direction of flow inside the gas stream. By convection, the gas flow creates a difference in temperature between the two measuring points. Using the bypass principle this temperature difference is directly correlated to the mass flow of the gas. For the CTA principle, the measurement sensors are kept at a constant temperature by heating. The power needed for keeping the temperature of the sensors constant is directly correlated to the mass flow. Depending on the gas composition and hence its heat capacity, the same mass flow influences the sensor temperature to a larger or smaller extent. Therefore, thermal MFMs are calibrated for a specific gas or gas mixture. If another gas or unknown gas mixture than the one used for calibration is analyzed with the MFM, a conversion factor is needed [27]. This can be easily done for pure gases. For gas mixtures, it is more tedious because each component needs its own conversion factor and the proportion of the components may change over time (see Sects. 4.2 and 4.3).
The output signal of mass flow meters is normally a volume flow and not mass flow because it is more common to use gas volume than gas mass. The volume flow refers to standard conditions, which means the mass flow is converted into a volume flow by using the specific density of the gas or gas mixture that the MFM is calibrated for at standard temperature and pressure (as requested by the manufacturer, see Box 1). In addition to mass flow meters, there are also mass flow controllers. These devices offer the possibility to fix the flow to a desired set point. The measured inflow mass flow is compared with the set point and is iteratively adjusted so that the outflow matches the set point.
How to measure the gas composition
Various methods are available for the qualitative and quantitative determination of individual components of a gas mixture. These methods can be grouped according to the principle of determination into chemical and physical methods. Chemical methods include volumetric and manometric gas analysis after the removal of specific gas components by specific reactions (e.g., precipitation, combustion) or specific absorption. The physical methods can be divided into condensation and distillation, fractional absorption and desorption and special methods exploiting specific physical properties of the gaseous components [17]. The latter include thermal conductivity, heat toning, magnetic properties and light absorption. Furthermore, gas chromatrography (GC) coupled to different kinds of detectors can be used (see below). In general, chemical methods for gas analysis offer the possibility to carry out a qualitative and quantitative determination in a short time with little equipment and operational expenditure. At the same time, these are limited to only one or a very few compounds and can often not be automatized. The physical methods, however, are more complex but are often considered to possess higher accuracy [17].
Chemical gas analysis
For chemical gas analysis that is based on precipitation, the gas mixture is passed through different barrier solutions one after the other. In each solution, a chemical reaction specific for a single component can take place and thus individual components can be determined [17]. Prominent examples are the determination of carbon dioxide using potassium hydroxide solution or oxygen using pyrogallol solution. The reactions lead to the formation of, for example, potassium carbonate when KOH reacts with CO2, precipitates of BaCO3 if BaOH is used or a color change due to absorption of oxygen by alkaline pyrogallol. The formation of insoluble compounds or the change in color primarily provides a qualitative indication of the presence of a certain component. Since the gases are also bound (“trapped”) by the chemical reactions, they are removed from the gas mixture. For quantitative analysis, the chemical reactions have to be combined with volumetric or manometric analysis. Volumetric gas analysis means that the overall gas volume has been measured beforehand. When the overall gas volume changes because of the chemical reaction of one individual component, the volume of the individual component results from the difference in the overall gas volume before and after the reaction. A similar system is used for manometric gas analysis, except that it is not the volume difference after each chemical analysis that is determined but the pressure difference while the volume is kept constant. Since certain gases such as hydrogen cannot be determined by chemical gas analysis based on precipitation, a different approach is needed—e.g., chemical analysis based on the combustion of gases. The volumes of the burned gases can be calculated from the gas volume after combustion and the amount of oxygen required. The Orsat apparatus combines both approaches in one device. However, the Orsat apparatus, which was registered for a patent in 1874 [28], is no longer used as gas chromatography offers more efficient and precise quantification. Another method for the analysis of different gaseous components is using test tubes [1]. Their working principle is also based on a chemical reaction of a specific component in the test tube. These test tubes are commercially available and allow a simple and cheap qualitative analysis. The disadvantage of these test tubes is that no precise quantitative analysis is possible. They often only allow analysis with a large error range. For this reason, the test tubes are often only used to estimate the approximate concentration range in which a certain gaseous component is present.
Physical gas analysis
Gas analysis using physical methods offers many different options. In the context of this article, gas chromatography (GC) will be briefly introduced, since data from GC set the foundation for the example calculation shown in 4.3. GC is widely used because it can be automated, and the use of various separation columns and detectors enables the analysis of many different chemical compounds [1]. As with all chromatographic methods, the gas mixture is separated by the interaction of the gaseous analytes (that is the gas mixture) in the mobile gaseous phase with the stationary phase. The most commonly used columns today are capillary columns with a liquid or solid stationary phase [4]. The analytes are passed through the column using an inert carrier gas as mobile phase. Their separation occurs depending on the different interactions of the components in the gas mixture with the stationary phase and results in different retention times depending on the intensity of the interactions. The individual components can finally be analyzed using a detector. The thermal conductivity detector (TCD) is commonly used to analyze gases. By comparing the heat loss of two heating elements, each in a separate measuring chamber, due to the gas flow (sample or reference gas) around them, gas components can be quantified using a TCD. The amount of heat lost depends on the thermal conductivity of the gases. Hydrogen or helium is often used as reference gases because of their high thermal conductivity. Further detectors are: (1) infrared, (2) flame ionization, (3) mass selective and (4) flame photometric detectors, with the latter only being suitable for compounds that are combustible [4]. An important point to mention is that GC is a relative method for quantification meaning it requires calibration with external standards of different known concentrations (Box 3).
How to calculate the gas volume under STP conditions and the absolute amount of substance of gas components
A quantification of the absolute amount of gaseous component is only possible if the measurements of the gas volume and composition are combined. This combination enables the derivation of the absolute composition of a gas on a molar basis.
To calculate volumes of gas mixtures, first it is necessary to convert the measured volumes to the respective reference conditions. If humidity plays a role, the volume of the gas mixture has to be converted to dry conditions, i.e., 0% humidity. Here, we convert all volumes to STP conditions \({T}^{\mathrm{STP}}=273.15 \text{ }\mathrm{K}, {p}^{\mathrm{STP}}=1 \text{ }\mathrm{bar}\) and 0% humidity. Depending on the laboratory setup and the corresponding environmental conditions, the following scenarios with respect to the water vapor are possible: (1) assuming dry gases (described in Sect. 4.3), (2) water vapor saturated gases (Sect. 4.1.) or (3) gases with a specific water vapor pressure. In the first case, the gas is dried, e.g., by cooling and condensation or water adsorption. Water-saturated gases can be assumed in reactors with high retention times of the gas phase over the aqueous phase, e.g., batch experiments. A specific water vapor can occur in continuous experiments, e.g., in a continuous stirred tank reactor (CSTR), with short retention times of the gas phase. In the latter case, the correct water vapor is accessible by careful measurement, e.g., using humidity sensors.
Several empirical equations exist to calculate water vapor pressure in gases, e.g., Antoine’s equation (Eq. 24 [29]) and the Magnus equation (Eq. 25 [30]) or the less known but more accurate Wagner equation [31] or Goff-Gratch equation [32] (both will not be discussed here). It should be noted that these equations represent approximations that are valid for certain environmental conditions. Several forms of the Magnus equation exist depending on the aggregate state of water (solid or liquid) and for different temperature ranges. Coefficients in Antoine’s equation to calculate \({p}_{{\mathrm{H}}_{2}\mathrm{o},\mathrm{sat}}\) depend on the temperature and pressure units that are used (e.g., [Pa], [mmHg], [°C], [K]) as well as on the basis of the logarithm. Therefore, it is vitally important to select the appropriate equation and correct coefficients that are valid for the conditions of the experiment and measurement.
If we want to analyze the quantity of single components from a gas mixture that includes water vapor (which is the case in almost all experiments under ambient conditions where the gas mixture has not been dried), it is very important to consider the method of quantification itself. If the gas mixture is directly injected in a GC with TCD, the water vapor is part of the injection volume and therefore needs to be considered during data processing. In this case, the molar or volume fractions of all components can only reach 100% if water vapor is included therein. Sometimes measured values of individual components of specific gas mixtures are related only to the calibrated components, i.e., all calibrated compounds sum up to 100%. Since the calibration is usually carried out with dry gases, water vapor leads to an overestimation of the individual components in gas mixtures.
Basic Example: Calculating the normal gas volume of biogas at 0% humidity

Given values
-
\({v}_{\mathrm{biogas}}=1000 \text{ }\mathrm{mL} ({\varphi }_{{\mathrm{CH}}_{4}}\sim 50 \% , {\varphi }_{{\mathrm{CO}}_{2}}\sim 45 \%)\)
-
\({v}_{\mathrm{biogas}} \text{is saturated with water vapor}\left(100\mathrm{ \%} \text{ absolute humidity}\right)\)
-
\({\theta }_{\mathrm{biogas}} = 38\,^\circ\mathrm{C} \text{ or } {T}_{\mathrm{biogas}}=311.15 \text{}\,\mathrm{K}\)
-
\(p_{{{\text{biogas}}}} = {\text{99}},{\text{000 Pa }}(990{\text{ mbar}},{\text{ i}}.{\text{e}}.{\text{ atmospheric pressure}})\)
Unknown
-
Biogas volume under STP conditions (\({T}^{\mathrm{STP}}=273.15 \text{ }\mathrm{K}, {p}^{\mathrm{STP}}=1 \text{ }\mathrm{bar})\) and 0% humidity (dry gas), i.e., \({v}_{\mathrm{biogas}}^{\mathrm{STP},\mathrm{ dry}}\)
To convert the biogas volume to STP conditions and 0% humidity, one has to consider two issues. The first is the choice of an empirical equation to calculate water vapor pressure in gases, e.g., the Magnus equation or Antoine equation (for details, see Sect. 4). In our case, both equations are well suited and differ only slightly (see example below). The second issue is the order of mathematical removal of water vapor and the conversion to STP conditions in a way that avoids mistakes introduced by condensation of water vapor. For details, see Fig. 8 as well as the discussion. In our example, we will focus on two possible pathways to calculate the water vapor of biogas followed by converting the dry gas to STP conditions and afterwards shortly discuss possible sources of error.

Effect of condensation on conversion of humid gas mixtures to reference conditions and 0% humidity
First case: Calculation of the volume of water vapor \({v}_{{\mathrm{H}}_{2}\mathrm{O},}\) in \({v}_{\mathrm{biogas}}\) using the Antoine equation (Eq. 24) or Magnus equation (Eq. 25) in combination with the equation for absolute humidity (AH, Eq. 23) followed by subtraction of \({v}_{{\mathrm{H}}_{2}\mathrm{O}}\) from \({v}_{\mathrm{biogas}}\) and converting the residual volume \({v}_{\mathrm{biogas}}^{\mathrm{dry}}\) to STP conditions at 0% humidity \({v}_{\mathrm{biogas} }^{\mathrm{STP},\mathrm{ dry}}\) using the combined gas law (Eq. 3).
Second case: Using a direct combination of the combined gas law (Eq. 3) and Antoine equation (Eq. 24) to directly convert \({v}_{\mathrm{biogas}}\) into \({v}_{\mathrm{biogas} }^{\mathrm{STP},\mathrm{ dry}}\).
First case: Subtracting the volume of water vapor \({{\varvec{v}}}_{{\mathbf{H}}_{2}\mathbf{O}}\) from \({{\varvec{v}}}_{\mathbf{b}\mathbf{i}\mathbf{o}\mathbf{g}\mathbf{a}\mathbf{s}}\) followed by converting the residual gas volume to STP conditions at 0% absolute humidity \({{\varvec{v}}}_{\mathbf{b}\mathbf{i}\mathbf{o}\mathbf{g}\mathbf{a}\mathbf{s} }^{\mathbf{S}\mathbf{T}\mathbf{P}, \mathbf{d}\mathbf{r}\mathbf{y} }\)
Step 1: Calculating the concentration of water vapor in biogas using the equation for absolute humidity (Eq. 23)
Absolute humidity (AH) is defined as:
with \({R}_{{\mathrm{H}}_{2}\mathrm{O}}=461.52\mathrm{ J }{\mathrm{kg}}^{-1} {\mathrm{K}}^{-1}\) being the individual gas constant of water.
The partial pressure of water vapor in water-saturated biogas \({p}_{{\mathrm{H}}_{2}\mathrm{O},\mathrm{sat}}\) is calculated here via (1) the Antoine equation (Eq. 24) or (2) the Magnus equation (Eq. 25).
Option 1: Using the Antoine equation (Eq. 24) with A, B and C being substance as well as pressure and temperature unit specific parameters [29, 35]:
For water at the given experimental conditions kPa and °C, the parameters A, B and C are tabulated, for instance, in Bierwerth 2011 [29] or Roizard 2014 [35], and Eq. 24 is solved as follows:
Note that multiplication with 1000 in the upper equation is due to the conversion of kPa to Pa.
Option 2: Using the Magnus equation (assuming saturation vapor pressure over flat water surfaces at \(\theta \ge - 45{\text{ }}^\circ {\text{C}} \le 60{\text{ }}^\circ {\text{C}}\), Eq. 22) [36]:
For the given example, it follows:
Again, multiplication with 1000 in the upper equation is due to the conversion of kPa to Pa.
As we clearly see, calculation of \({p}_{{\mathrm{H}}_{2}\mathrm{O},\mathrm{ sat}}\) using the Antoine equation (Eq. 24) or the Magnus equation (Eq. 25) results in only slightly different values because of the empirical nature of both equations and their parameters. Both equations can be used without any limitation.
By inserting \({p}_{{\mathrm{H}}_{2}\mathrm{O},\mathrm{sat}}\) (here we use the result of the Antoine equation) into the equation for absolute humidity (Eq. 23), we get:
If we now consider \({v}_{\mathrm{biogas}}=1 \text{ }\mathrm{L}\), it results in \({m}_{{\mathrm{H}}_{2}\mathrm{O}}=0.046 \text{ }\mathrm{g}\).
Step 2: Calculation of \({v}_{\mathrm{biogas}}^{\mathrm{dry}}\) by calculation of \({v}_{{\mathrm{H}}_{2}\mathrm{O}}\) using the ideal gas law (Eq. 1) followed by subtraction from \({v}_{\mathrm{biogas}}\)
our example becomes:
Note that multiplication with 1000 in the calculation above is due to the conversion of m3 to L.
The water vapor in our specific example is \({v}_{{\mathrm{H}}_{2}\mathrm{O}}=66.7 \mathrm{mL}\) and the volume of dry biogas under atmospheric conditions \({v}_{\mathrm{biogas}}^{\mathrm{dry}}\) calculates as follows:
Note: One may wonder why we did not use the density of water to calculate \({v}_{{\mathrm{H}}_{2}\mathrm{O}}\) out of \({m}_{{\mathrm{H}}_{2}\mathrm{O}}\). This should generally not be done as \({v}_{{\mathrm{H}}_{2}\mathrm{O}}\) is part of a real mixture (biogas) and real gas mixtures have a non-ideal behavior. It has to be noted that for our specific biogas example (light gases, water, no carboxylic acids with vapor phase association), these effects are negligible. However, for other real gas mixtures, expansion or contraction effects may occur [8, 37] (see also the discussion of excess volume below as well as Sects. 2.2 and 2.3).
Step 3: Converting \({v}_{\mathrm{biogas}}^{\mathrm{dry}}\) to \({\nu }_{\mathrm{biogas}}^{\mathrm{STP},\mathrm{ dry}}\) using the combined gas law Eq. 3 that derives from the ideal gas law (Eq. 1)
For our specific example, it has to be noted that \({p}_{\mathrm{biogas}}\) equals atmospheric (isobaric) conditions, meaning \({p}_{\mathrm{biogas} }= {p}_{\mathrm{biogas}}^{ \mathrm{dry}}\). Conversion of Eq. 3 to \({\nu }_{\mathrm{biogas}}^{\mathrm{STP},\mathrm{ dry}}\) results in Eq. 29:
Thus, the combination of the equation of absolute humidity (Eq. 23) and the ideal gas law (Eq. 1) yields \({\nu }_{\mathrm{biogas}}^{\mathrm{STP},\mathrm{ dry}}= 811.13\mathrm{ mL}\).
Second case: Converting \({{\varvec{v}}}_{\mathbf{b}\mathbf{i}\mathbf{o}\mathbf{g}\mathbf{a}\mathbf{s}}\) directly to \({{\varvec{v}}}_{\mathbf{b}\mathbf{i}\mathbf{o}\mathbf{g}\mathbf{a}\mathbf{s}}^{\mathbf{S}\mathbf{T}\mathbf{P},\mathbf{d}\mathbf{r}\mathbf{y}}\) by direct combination of the combined gas law (Eq. 3) and the Antoine equation (Eq. 24)
In this example, the combined gas law (Eq. 3) and the Antoine equation (Eq. 24) are directly combined without intermediate conversion of \({p}_{{\mathrm{H}}_{2}\mathrm{O},\mathrm{ sat}}\) via \({m}_{{\mathrm{H}}_{2}\mathrm{O}}\) to \({v}_{{\mathrm{H}}_{2}\mathrm{O}}\). This results in Eq. 30 [23, 38]:
Inserting the values of our example yields:
In this case, the volume of dry biogas under STP conditions \({\nu }_{\mathrm{biogas}}^{\mathrm{STP},\mathrm{ dry}}=811.07 \mathrm{mL}\). The results of both calculations are summarized in Table 3.
The observed deviation shown in Table 3 of the first and second case is very little, only ~ 0.06 mL (or 0.07 ‰). This may seem negligible, but is a result of intermediate conversion of \({p}_{{\mathrm{H}}_{2}\mathrm{O},\mathrm{sat}}\) via \({m}_{{\mathrm{H}}_{2}\mathrm{O}}\) to \({v}_{{\mathrm{H}}_{2}\mathrm{O}}\) (rounding errors) in combination with the empirical nature of the equation for absolute humidity (Eq. 23) and the Antoine (Eq. 24) or Magnus equation (Eq. 25). From a practical point of view, the second case is easier to use as many fewer calculation steps are necessary, whereas the 1first case permits the calculation of parameters step by step, which may be necessary for further calculations.
Independent from the biogas example, several pitfalls exist when converting humid gas mixtures to the respective reference conditions. Here, we draw the attention again to the excess volume of real mixtures as already introduced in Sect. 2.2 and 2.3 as well the order of the conversion of humid gas mixtures to the respective reference conditions and 0% humidity.
Excess volume means the volume reduction or expansion when combining pure substances in a real mixture. Due to intermolecular forces, e.g., van der Waals forces, the distances between single molecules does vary resulting, for example, in changes of the partial density of the single components compared to the pure substances. Therefore, the volume of a component in a real mixture, e.g., water vapor, is not accessible via its density as a pure substance. Hence, the calculation of partial volumes of single gas components via the partial mass of the gaseous component is only possible regarding the molar amount of the respective component [8, 37]. In such cases, the ideal gas model is not appropriate. For the given biogas example, these effects are negligible.
Furthermore, when converting humid gas mixtures at ambient conditions to the respective reference conditions and 0% humidity, the order of calculation can be important. One should always first mathematically remove the water volume from humid gas mixtures before converting the gas to reference conditions; otherwise, the effect of water condensation may falsify the calculation result (see Fig. 8).
General procedure for the quantification of multicomponent gas mixtures
Since the measurement with MFMs is independent of temperature and pressure, all that we need to do is convert the measured gas volume based on the gas composition into the real gas volume. This is presented below in general and illustrated in more detail using one case study in Sect. 4.3.
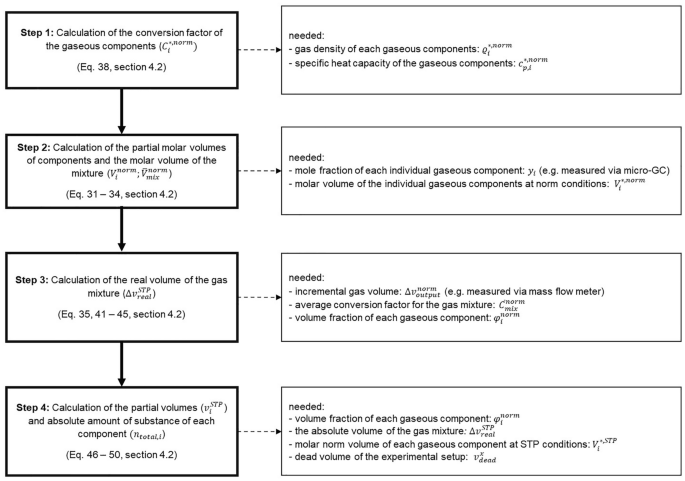
For quantification of individual components in gas mixtures using a MFM and gas chromatography, it is necessary to combine the data from both devices. The MFM gives \({v}_{\mathrm{output}}^{\mathrm{norm}}\) as measured output volume of the gas mixture at norm conditions (see Box 1). The composition of the gas can be determined using GC in bypass, allowing to obtain the mole fraction \({y}_{i}\) of each individual gaseous component \(i\). Since the MFM is calibrated for a specific gas, the nominally measured volume has to be corrected with a factor depending on the gas composition. Therefore, the first step is to convert the molar fraction of each gaseous component into a volume fraction \({\varphi }_{i}^{\mathrm{norm}}\). For this conversion, it is necessary to calculate the average molar volume \({\overline{V} }_{\mathrm{mix}}^{\mathrm{norm}}\) of the real gas mixture (at the calibration conditions of the MFM: \(T = 273.15{\text{ K\, and\, }}p = 1.0132{\text{ bar}})\) for each sampling point. Then, the molar volume \({V}_{i}^{*,\mathrm{norm}}\) of each gaseous component at norm conditions is calculated by dividing the molecular weight \({M}_{i}^{*}\) by the gas density \({\varrho }_{i}^{*,\mathrm{norm}}\) of the component \(i\)(Eq. 31). Additionally, the molar volume \({V}_{i}^{*, \mathrm{STP}}\) of each component at STP conditions is also calculated (Eq. 32).
By multiplying the molar volume \({V}_{i}^{*,\mathrm{norm}}\) of each component with its molar fraction \({y}_{i}\) measured via GC the partial molar volume \({V}_{i}^{\mathrm{norm}}\) of each component in the mixture at norm conditions is gained (Eq. 33). To derive the average molar volume \({\overline{V} }_{\mathrm{mix}}^{\mathrm{norm}}\) of our specific gas mixture at norm conditions, we need to sum up all partial molar volume values of the different gaseous components (Eq. 34). It should be noted that, as the composition of the gas stream changes with time, this and all following calculations must be performed for each sampling point individually.
The partial molar volume of a component in relation to the average molar volume of the gas mixture gives the volume fraction \({\varphi }_{i}^{\mathrm{norm}}\) of each component (Eq. 35).
As mentioned above, MFMs can be used for gas flow measurements and are calibrated for a specific gas (or gas mixture). For MFM based on bypass measurements, the relationship between the signal output and mass flow or volume flow is:
with \(K\) as a device constant, \({c}_{p}\) specific heat capacity, \(\dot{m}\) mass flow and \(\dot{v}\) volume flow. To use the MFM for other gases than the calibration gas, a conversion factor \(C\) has to be defined.
in which the index cal stands for the calibration gas (indicated by MFM) and the index meas for any gas to be measured (real gas flow). Thus, equal signal outputs of the MFM are related to different volume flows.
Example
Using a N2 calibrated MFM (mL min−1) with an indicated output signal of 100, this means for a N2 measurement a volume flow \({\dot{v}}_{\mathrm{meas}}\) of 100 mL min−1 N2 (\({c}_{p}^{*,\mathrm{norm}}=1045 \quad{\mathrm{J }}\quad{\mathrm{kg}}^{-1}{\mathrm{K}}^{-1},C=1\)) or, if you measure CO2, a real flow of 80 mL min−1 CO2 (\({c}_{p}^{*,\mathrm{norm}}=\mathrm{828.2}\; \mathrm{J }{\mathrm{kg}}^{-1}{\mathrm{K}}^{-1}, C=0.80\)).
Equation 38 shows that the conversion factor \({C}_{i}^{*,\mathrm{norm}}\) of a measured gas \(i\) in relation to the calibrated gas can be calculated as follows using the gas density and specific heat capacity at norm conditions. Sometimes also the manufacturers of MFMs provide the conversion factors for the most used gases.
For correcting the measured volume of the gas mixture, an average conversion factor \({\overline{C} }_{\mathrm{mix}}^{\mathrm{norm}}\) of the gas mixture has to be calculated.
If we assume an ideal gas mixture, the gas flows of the components are additive and \({\dot{v}}_{\mathrm{cal},\mathrm{mix}}\) (indicated gas flow at MFM) can be calculated as follows:
Finally, for gas mixtures a good approach is the following simplified Eq. 41. The volume fraction \({\varphi }_{i}^{\mathrm{norm}}\) can be used to calculate the partial reciprocal conversion factor for each component \(\frac{1}{{C}_{i}^{\mathrm{norm}}}\); these are in the end summed up to the reciprocal conversion factor of the gas mixture \(\frac{1}{{\overline{C} }_{\mathrm{mix}}^{\mathrm{norm}}}\).
At this point, we need to consider whether the gas composition remains constant or changes over the course of the experiment. Depending on the answer, the next calculation steps differ. If the gas composition does not change, we can use a constant conversion factor for the gas mixture (Eq. 42). Since the MFM is calibrated for norm conditions and all calculations so far are done for these conditions, a conversion to STP conditions is necessary to determine the amount of substance of each gaseous component (Eq. 43).Footnote 2
However, if the gas composition does change over the duration of the experiment, samples at different points of time need to be measured. The time intervals between samples need to be adjusted to the speed of the change in composition and generally should be kept as small as possible. We determine the real partial gas volume \(\Delta {v}_{\mathrm{real}}^{\mathrm{norm}}\) via the average of the conversion factors of the gas measurements at the two consecutive time points \({t}_{n}\) and \({t}_{n+1}\) and the measured partial gas volume \({\Delta v}_{\mathrm{output}}^{\mathrm{norm}}\) (Eq. 44) in between these two points. In addition, in this case also a conversion of the volume from norm to STP is necessary.
The next step is to calculate the real partial gas volumes of the individual components \({v}_{i}^{\mathrm{STP}}\) in the gas mixture. For this purpose, we multiply the average of the volume fractions of the two consecutive time points \({t}_{n}\) and \({t}_{n+1}\) with the previously calculated real partial gas volume at STP conditions between these time points (Eq. 46).
The last step is the calculation of the partial amount of substance of each component \({n}_{i}\) using the calculated partial gas volume at STP conditions and the calculated molar volume of the individual component at STP conditions (Eq. 47). The partial amounts of substance from each sampling point can then be summed up and the absolute amount of substance of each component \({n}_{\mathrm{total},i}\) of the gas mixture is obtained (Eq. 48).
Additionally, an important point to consider is the experimental setup. If there is a headspace of gas above the aqueous reaction solution that can be regarded as dead volume, we need to determine the corresponding amount of substance therein. It is calculated and added to the already calculated amount of substance of the individual components. The gas composition in the dead volume can be considered to correspond to the composition of the terminal measurement. The conversion of the determined dead volume \({v}_{\mathrm{dead}}^{x}\) into the dead volume \({v}_{\mathrm{dead}}^{\mathrm{STP}}\) at STP conditions considers the ambient temperature \({T}^{x}\) and the standard temperature \({T}^{\mathrm{STP}}\) (Eq. 49).
From the ratio of the dead volume at STP conditions and the partial gas volume between the last two measurements, including the partial amount of substance between these two measurements, the amount of substance in the dead volume \({n}_{dead,i}\) can be derived (Eq. 50).
Further to \({n}_{\mathrm{dead},i}\) substances could still be dissolved or precipitated. To account for these amounts of the component \(i\), it may be necessary to subject the liquid or solid phase to post-treatment and analysis.
Case study for the quantification of gas mixtures
Reaction scheme 1 shows the electrochemical decarboxylation of medium chain carboxylic acids (MCCA) for the example of n-hexanoic acid [39, 40]. The anions of the MCCA are oxidized by a one electron transfer at the anode of the electrolysis cell followed by a decarboxylation leading to radical formation. Subsequently, the radical can take different reaction pathways. Two of the formed radicals can combine spontaneously leading to dimers and hence the formation of an alkane—this is called the Kolbe reaction—or they can disproportionate, leading a short alkane and alkene. Alternatively, the radical can undergo a second electron transfer to the anode leading to the formation of a carbocation. This carbocation can react further to form an alkene, different alcohols or shorter chain carboxylic acid or lead to the formation of esters. All these side products are called non-Kolbe products. The overall reactions yield a complex mixture of products being soluble in an aqueous solution, but especially gaseous compounds, when starting from shorter chain acids such as n-hexanoic acid (see Reaction scheme 1). Beside CO2 from decarboxylation at the anode, hydrogen is evolved from water electrolysis at the cathode. Further gaseous components can be formed during the reaction in the anode compartment such as 1-pentene, 2-methyl-2-butene, 2-cis-pentene, 2-trans-pentene and n-pentane. All gases have to be identified and quantified to establish a mass balance.

(Adapted from Stang et al. [39])
Kolbe electrolysis of n-hexanoic acid. Components marked with a green box are measured via microGC-TCD and those marked with an orange box via GC-MS
To illustrate the quantification of individual components in a gas mixture in the following, a case study on the Kolbe electrolysis of n-hexanoic acid to produce n-decane is discussed. Electrolysis was performed similarly to Stang et al. [39]. We further performed analysis of the quantitative gas composition at different time points during the experiment by gas chromatography (microGC-TCD) in bypass. The total gas volume evolved from the reactor was measured continuously with a MFM calibrated for N2. Since the setup was purged with nitrogen before the start of the electrolysis, N2 is the most abundant gaseous component at the start of the experiment. The liquid products of such an electrolysis are of main interest as they can serve as fuel additives [41]. However, they are not of interest for the following consideration. Here, we will focus on gaseous products that are produced during electrolysis, which are listed in Table 4 together with the corresponding molar fractions measured with microGC-TCD and the gas volumes measured with a MFM at different time points. Many different gaseous products are formed in minor proportions during electrolysis that can hardly be distinguished using microGC-TCD, such as 1-pentene, 2-methyl-2-butene, 2-cis-pentene and 2-trans-pentene. Thus, they have been summed as Σ pentene for the sake of simplicity and also practical convenience.
Importantly and in contrast to case study 1 (see Sect. 4.1), in this example we did not consider the volume of water vapor in the total gas volume. Thus, we assume that the experimental setup is designed to allow drying the gas before the measurement. However, this is not always possible, since the distance between the reactor and microGC-TCD needs to be increased, which leads to a time delay in the measurement. Consequently, if the gas composition changes rapidly (which is not the case for the case study here), the real state inside the reactor is only reflected with delay.
As shown in Table 4, the produced gas consists of H2, N2, CO2, Σ pentene and n-pentane. The distribution of the individual components changes over the course of the electrochemical conversion. In the beginning, there is nearly only N2, and in the last measurement after 240 min the main components are H2 and CO2.
Step 1: Calculation of the conversion factors
First, the parameters \({V}_{i}^{*,\mathrm{norm}}\), \({V}_{i}^{*,\mathrm{STP}}\) and \({C}_{i}^{*,\mathrm{norm}}\) (see Eqs. 31, 32 and 38) of the individual gaseous components are calculated (Table 5). For \({V}_{i}^{*,\mathrm{norm}}\), \({V}_{i}^{*,\mathrm{STP}}\) and \({C}_{i}^{*,\mathrm{norm}}\) of Σ pentene, the average was calculated from the individual molar volumes and conversion factors of the combined components.
To illustrate the importance of the conversion factor, n-pentane is used as example. The conversion factor of 0.249 means that the real flow in mL min−1 for n-pentane is only 24.9% of the nominal flow readout at a device calibrated for N2. Thus, if the MFM calibrated for N2 provides a readout of 100 mL min−1 for a pure n-pentane stream, it means that only a flow of 24.9 mL min−1 is in place. The consequence of this is that the produced gas volume does not correspond to the nominal measured value when no correction for the different gases (actually their different thermal conductivity) takes place. This stresses clearly that it is important to correct the measured gas volume to quantify the individual gaseous components correctly.
Step 2: Calculating the partial molar volumes of components and the molar volume of the mixture
To calculate the partial molar volume \({V}_{i}^{\mathrm{norm}}\) (Eq. 33) of each component for each time point, we used the mole fractions \({y}_{i}\) measured with microGC-TCD (Table 4) and the molar volume \({V}_{i}^{*,\mathrm{norm}}\) of the individual products at norm conditions calculated in Table 5. Thus, we ultimately obtain the average molar volume of the gas mixture for each time point according to Eq. 34; these are shown in Table 6. This is shown using the example of H2 after 20 min of electrolysis.
With the partial molar volume \({V}_{i}^{\mathrm{norm}}\) of each component and the average molar volume \({\overline{V} }_{\mathrm{mix}}^{\mathrm{norm}}\) of the gas mixture both at norm conditions listed in Table 6, it is possible to calculate the volume fraction \({\varphi }_{i}^{\mathrm{norm}}\) of the individual gaseous products (Eq. 35) for each time point. Again shown for the example of H2 after 20 min of electrolysis:
This means that 33 vol% of the gas mixture consists of H2 after 20 min of electrolysis. After calculating \({\varphi }_{i}^{\mathrm{norm}}\) for all components at all sampling points (Table 7), it is possible to convert the measured gas volume with the conversion factor into the actually produced gas volume (Eqs. 36–45).
Step 3: Calculating the real volume of the gas mixture
To convert the volume fractions into an absolute volume of each gaseous component at the different time points, we need to know the real gas volume produced during the experiment. Therefore, we calculate the average conversion factor of the gas mixture \({\overline{C} }_{\mathrm{mix}}^{\mathrm{norm}}\). Considering the volume fractions and conversion factor of each gaseous component (in relation to N2, which was used for calibration), the partial reciprocal conversion factor \(\frac{1}{{C}_{i}^{\mathrm{norm}}}\) of each gaseous component can be obtained and summed up to the reciprocal conversion factor of the gas mixture (Table 8).
This is shown with the example of H2 after 20 min of electrolysis. First, we obtain the partial reciprocal conversion factor using Eq. 41.
For converting the measured gas volume with the conversion factor of the gas mixture into the real produced gas volume, it is important to consider that the distribution of components may also change between two successive measurements. Therefore, in reality we may have a continuously changing conversion factor of the gas mixture that needs to be calculated by Eq. 41. To include this dynamics, we consider the arithmetic mean of the conversion factors of two consecutive measurements to be representative of the corresponding interval. For the example of the measurement after 20 min, the real partial gas volume \({\Delta v}_{\mathrm{real}}^{\mathrm{norm}}\) is calculated by using the average \({\overline{C} }_{\mathrm{mix}}^{\mathrm{norm}}\) of the measurements after 10 and 20 min and multiplied with the measured partial gas volume \({\Delta v}_{\mathrm{output}}^{\mathrm{norm}}\) as shown using Eq. 44. Since the MFM is calibrated for a temperature of 273.15 K and a pressure of 1.0132 bar \({\Delta v}_{\mathrm{real}}^{\mathrm{norm}}\) has to be converted to \({\Delta v}_{\mathrm{real}}^{\mathrm{STP}}\) according to the STP conditions of 273.15 K and 1 bar.
To illustrate the importance of this correction, Fig. 9 shows that the real gas volume deviates from the measured gas volume already after < 1 h of electrolysis, although there is still a large proportion of N2 in the gas mixture. The lower the proportion of N2 (the gas the MFM was calibrated for), the greater the deviation becomes. For the last measurement after 240 min, the difference between the measured and the real gas volume is 294.02 mL, which corresponds to a relative error of around 22.8%!

Readout of uncorrected volume of the gas mixture measured using a MFM calibrated for N2 (black squares) and real gas volume at norm conditions calculated after applying the needed corrections (red dots) over the duration of the experiment
Step 4: Calculating the partial volumes and absolute amount of substance of each component
Having the real produced gas volume of the gas mixture at STP conditions, we can now calculate the real partial gas volume of each component. Subsequently, we gain the partial amounts of substance of each gaseous compound. These can be summed up to the absolute amount of substance of each component (Eqs. 46–48). Here, it is important to average the volume fractions of two successive measurements as described above, since within these two sampling points the volume fraction of each gaseous component in the total gas volume may change. For clarification, the calculation is shown using the example of H2 after 20 min of electrolysis. We first use Eq. 46 to calculate the amount of H2 after 20 min of electrolysis within the measured partial gas volume. Comparing both results for STP and norm, we see that the difference for the partial gas volume of H2 is 0.10 mL, which corresponds to an error of 1.3% already for this single compound at one time point.
Now, we have absolute values for each gaseous component and do not rely on relative information anymore (Table 9). Summing up the real partial gas volumes of each component gives the total volume for the individual gaseous component that was produced during the experiment.
However, in (bio-)chemical and microbial experiments, the focus is usually on the quantification of the amount of components that are consumed or produced in the liquid phase. Thus, the entire process can only be balanced or evaluated if the values of the liquid and gas phase are combined. Therefore, it is necessary to convert the gas volume into the molar amount of substance. This is shown for the example of the conversion of the partial gas volume of H2 produced between 10 and 20 min of electrolysis into the corresponding amount of substance using Eq. 47:
The absolute amount of substance of each component is obtained by summing the partial values (Table 10).
Another important point during quantification of gaseous components is the calculation of the amount of substance in the dead volume of the experimental setup. Depending on the extent of the dead volume, this can have a major impact on the quantification. In the example presented, the dead volume of the system was \({v}_{\mathrm{dead}}^{x}=126 \text{ }\mathrm{mL}\). If this is converted to STP conditions, it equals \({v}_{\mathrm{dead}}^{\mathrm{STP}}=117 \mathrm{mL}\). Knowing the dead volume of the setup, we can calculate the amount of substance of each gas component in this dead volume at the end of the experiment (Eqs. 49 and 50).
Summing this up, with the amount of substance measured during the experiment, we obtained the final quantitative value for all individual gaseous components (Table 11).
Conclusion
In this article, we have shown that the correct and precise quantification of gases in biological and chemical laboratories can be a real challenge. This holds true for both measurement and data treatment. Several pitfalls exist that lead to incorrect results and in most cases to an overestimation of the amount of gaseous compounds. This is of special notice as especially gaseous products from biological and chemical conversions are intensively researched in light of a biobased economy.
In addition to the design and operation of the experimental setup that should avoid or at least minimize dead volumes, the instrumentation and methods have to be carefully chosen for the respective analytical task. Here, for pure gases and gas mixtures of well-known or even constant composition, (simple) chemical or physical methods can be an excellent choice, for instance, for quantification of biogas the use of eudiometers. The same device and method are rather unsuitable for the quantification of gases from other processes with an unknown composition. When it comes to less known mixtures of gases or those with fluctuating composition, more sophisticated instrumentation is required, for instance, the combined qualitative analysis using gas chromatography with quantitative measurements by thermal mass flow meters (see case study 2, Sect. 4.3).
In all circumstances, the quantification has to be performed with extreme care, and the data obtained, e.g., measured volumes, need further treatment. Here, only re-calculating of the volume to a state of reference is unequivocal, and only reporting values converted to reference conditions allows comparison across studies. However, by developing and rigorously following a fixed workflow and evaluation process, this challenge can be tackled. Figure 10 shows a workflow that can be used as blueprint and thereby summarizes the step-by-step procedures presented in this article.
Workflow for calculations from raw data to final result
Availability of data and material
Not applicable.
Code availability
Not applicable.
Notes
Within this article, we define a system in accordance with physical chemistry as a body of matter confined in space by walls that separate it from its surroundings, which is the environment.
Abbreviations
- \({C}_{i}^{*}\) :
-
Conversion factor of a pure substance i in a mixture
- \({C}_{i}\) :
-
Partial conversion factor of component i in a mixture
- \({\overline{C} }_{\mathrm{mix}}\) :
-
Average conversion factor of gas mixture
- \({c}_{i}\) :
-
Mole concentration of component i
- \({c}_{p,i}^{*}\) :
-
Specific heat capacity of a pure substance i
- \(M\) :
-
Molecular weight \(M=\frac{m}{n}\)
- \({M}_{i}^{*}\) :
-
Molecular weight of a pure substance i in a mixture
- \(\overline{M }\) :
-
Average molecular weight of a mixture
- \(m\) :
-
Mass
- \(\dot{m}\) :
-
Mass flow
- \({m}_{i}\) :
-
Partial mass of component i \(\sum {m}_{i}=m\)
- \(n\) :
-
Amount of substance
- \({n}_{i}\) :
-
Partial amount of substance of component i \(\sum {n}_{i}=n\)
- \({n}_{\mathrm{dead}, i}\) :
-
Amount of substance of component i in the dead volume
- \({n}_{\mathrm{total}, i}\) :
-
Total amount of substance of component i
- \(p\) :
-
Pressure
- \({p}_{i}\) :
-
Partial pressure of component i \(\sum {p}_{i}=p\)
- \({p}_{i}^{\mathrm{sat},*}\) :
-
Saturated vapor pressure of the pure component i
- \(T\) :
-
Temperature (Kelvin)
- \(V\) :
-
Molar volume \(V=\frac{v}{n}\)
- \({V}_{i}^{*}\) :
-
Molar volume of a pure substance i in a mixture
- \({V}_{i}\) :
-
Partial molar volume of component i in a mixture
- \({\overline{V} }_{\mathrm{mix}}\) :
-
Average molar volume of a mixture
- \(v\) :
-
Volume
- \(\dot{v}\) :
-
Volume flow
- \({v}_{i}\) :
-
Partial volume of component i \(\sum {v}_{i}=v\)
- \({v}_{\mathrm{dead}}\) :
-
Dead volume
- \(\theta\) :
-
Temperature (°Celsius)
- \({\omega }_{i}\) :
-
Mass fraction of component i \(\sum {\omega }_{i}=1\)
- \({x}_{i}\) :
-
Mole fraction of component i in condensed phases \(\sum {x}_{i}=1\)
- \({y}_{i}\) :
-
Mole fraction of component i in gas phases \(\sum {y}_{i}=1\)
- \({\varrho }_{i}^{*}\) :
-
Mass concentration (density) of a pure substance i in a mixture
- \({\varrho }_{i}\) :
-
Partial mass concentration (density) of component i in a mixture
- \(\overline{\varrho }\) :
-
Average density of a mixture
- \({\sigma }_{i}\) :
-
Volume concentration of component i
- \({\varphi }_{i}\) :
-
Volume fraction of component i \(\sum {\varphi }_{i}=1\)
- * :
-
Pure substance
- \(i\) :
-
Substance
- mix:
-
Gas mixture
- \(\mathrm{norm}\) :
-
Outdated standard temperature and pressure conditions (273.15 K; 1.0132 bar)
- output:
-
Via mass flow meter measured volume of gas mixture
- real:
-
Real volume of the gas mixture
- x :
-
Ambient conditions
- \(\mathrm{STP}\) :
-
IUPAC standard temperature and pressure conditions (273.15 K; 1.0 bar)
References
Cammann K (2001) Instrumentelle Analytische Chemie. Spektrum Akademischer Verlag
Schwedt G, Schmidt TC, Schmitz OJ (2016) Analytische Chemie: Grundlagen, Methoden und Praxis, 3rd edn. WILEY-VCH Verlag
Flickinger MC, Pollard D, Christensen J (2010) Vent gas analysis. In: Flickinger MC (ed) Encyclopedia of Industrial Biotechnology. John Wiley & Sons
Dettmer-Wilde K, Engewald W, Adahchour M, et al (2014) Practical gas chromatography: a comprehensive reference. Springer-Verlag
Rood D (2007) The troubleshooting and maintenance guide for gas chromatographers. Wiley-VCH Verlag
Dörr H, Koturbash T, Kutcherov V (2019) Review of impacts of gas qualities with regard to quality determination and energy metering of natural gas. Meas Sci Technol 30:22001
Jones D, et al. (2013) Final Publishable JRP Report for ENG01 Gas Characterisation of Energy Gases. Project Number: ENG01. Euramet
Atkins P, Depaula J, Keeler J (2017) Physical Chemistry, 11th edn. Oxford University Press
NGC+ Liquid Hydrocarbon Drop Out Task Goup (2005) White paper on liquid hydrocarbon drop out in natural gas infrastructure. https://www.beg.utexas.edu/files/cee/legacy/NGC_HDP_Paper.pdf
Speight JG (2018) Handbook of natural gas analysis. John Wiley & Sons
McNeil B, Harvey LM (2008) Practical fermentation technology. John Wiley & Sons
Hillert M (2007) Phase equilibria, phase diagrams and phase transformations. Cambridge University Press
NIST SI Redefinition (2019) The NIST Reference on Constants, Units, and Uncertainty. In: NIST. https://physics.nist.gov/cgi-bin/cuu/Value?r
McNaught AD, Wilkinson A (2019) IUPAC Compendium of Chemical Terminology. The Gold Book. Blackwell Sci Publ Oxford
Cohen JE, Small C (1998) Hypsographic demography: the distribution of human population by altitude. Proc Natl Acad Sci USA. https://doi.org/10.1073/pnas.95.24.14009
Wedler G (1997) Lehrbuch der physikalischen Chemie, 4, völlig. Wiley-VCH, Weinheim
Müller E (1953) A. Probenahme, Geräte und Verfahren. In: Bähr, Arndt, Bathe et al (eds) Analytische methoden. Georg Thieme Verlag, Stuttgart. https://doi.org/10.1055/b-003-117799
Walker M, Zhang Y, Heaven S, Banks C (2009) Potential errors in the quantitative evaluation of biogas production in anaerobic digestion processes. Bioresour Technol 100:6339–6346. https://doi.org/10.1016/j.biortech.2009.07.018
Strömberg S, Nistor M, Liu J (2014) Towards eliminating systematic errors caused by the experimental conditions in Biochemical Methane Potential (BMP) tests. Waste Manag 34:1939–1948. https://doi.org/10.1016/j.wasman.2014.07.018
Weinrich S, Schäfer F, Bochmann G, Liebetrau J (2018) Value of batch tests for biogas potential analysis-method comparison and challenges of substrate and efficiency evaluation of biogas plants. Murphy JD (Ed) IEA Bioenergy Task 37:10
Khan I, Brimblecombe P, Clegg SL (1995) Solubilities of pyruvic acid and the lower (C1–C6) carboxylic acids. Experimental determination of equilibrium vapour pressures above pure aqueous and salt solutions. J Atmos Chem 22:285–302. https://doi.org/10.1007/BF00696639
Harvey A, Smith F (2007) Avoid Common Pitfalls when using Henry’s Law. Chem Eng Prog 103:33–39. https://tsapps.nist.gov/publication/get_pdf.cfm?pub_id=50449
VDI 4630:2014-04 E (2014) Fermentation of organic materials - Characterization of the substrate, sampling, collection of material data, fermentation tests, Beuth Verlag
DIN 38414-8:1985-06 (1985) German standard methods for the examination of water, waste water and sludge; sludge and sediments (group S); determination of the amenability to anaerobic digestion (S 8)
Guwy AJ (2004) Equipment used for testing anaerobic biodegradability and activity. Rev Environ Sci BioTechnol 3:131–139. https://doi.org/10.1007/s11157-004-1290-0
Wedler G Good to know - Thermal Mass Flow Sensor: Bypass versus CTA. https://www.bronkhorst.com/int/blog-1/good-to-know-thermal-mass-flow-sensor-bypass-versus-cta/. Accessed 31 May 2021
Do you know why Mass Flow reference conditions matter? https://www.bronkhorst.com/int/blog-1/do-you-know-why-mass-flow-reference-conditions-matter/. Accessed 31 May 2021
Rodhe O (1931) Orsat—Gasanalysen. tm Tech Mess 1–12:207. https://doi.org/10.1524/teme.1931.112.jg.207
Bierwerth W (2011) Tabellenbuch Chemietechnik: Daten, Formeln, Normen, vergleichende Betrachtungen [Table book chemistry technology: Data, formulars, standards], 8th edn. Haan-Gruiten Verlag
Sonntag D (1990) Important new values of the physical constants of 1986, vapour pressure formulations based on the ITS-90, and psychrometer formulae. Z Meteorol 40:340–344
Wagner W (1973) New vapour pressure measurements for argon and nitrogen and a new method for establishing rational vapour pressure equations. Cryogenics (Guildf) 13:470–482. https://doi.org/10.1016/0011-2275(73)90003-9
Goff JA (1957) Saturation pressure of water on the new Kelvin temperature scale. Trans. Am. Soc. Heat. Vent. Eng. 347–354. presented at the semi-annual meeting of the American society of heating and ventilatingengineers, Canada.
Madigan MT, Martinko JM, Stahl DA, Clark DP (2012) Brock Biology of Microorganisms, 13th ed. Pearson
Kaltschmitt M, Scholwin F, Friehe J, et al. (2012) Guide to Biogas: From production to use. Fachagentur Nachwachsende Rohstoffe e. V. (FNR).
Roizard D (2014) Antoine equation. In: Drioli E, Giorno L (eds) Encyclopedia of membranes. Springer Berlin Heidelberg, Berlin Heidelberg
Alduchov OA, Eskridge RE (1996) Improved magnus form approximation of saturation vapor pressure. J Appl Meteorol Climatol 35:601–609. https://doi.org/10.1175/1520-0450(1996)035%3c0601:IMFAOS%3e2.0.CO;2
Elliott RJ, Lira CT (1999) Introductory chemical engineering thermodynamics. Prentice Hall PTR, Upper Saddle River, NJ
Liebetrau J, Pfeiffer D (2020) Collection of Methods for Biogas. Methods to determine parameters for analysis purposes and parameters that describe processes in the biogas sector, 2nd ed DBFZ
Stang C, Harnisch F (2016) The dilemma of supporting electrolytes for electroorganic synthesis: a case study on Kolbe electrolysis. Chemsuschem 9:50–60. https://doi.org/10.1002/cssc.201501407
Schäfer HJ (1990) Recent contributions of kolbe electrolysis to organic synthesis. In: Steckhan E (ed) Topics in current Chemistry, vol 152. Electrochemistry IV. Springer, Berlin, Heidelberg, pp 91–151
Urban C, Xu J, Sträuber H et al (2017) Production of drop-in fuels from biomass at high selectivity by combined microbial and electrochemical conversion. Energy Environ Sci 10:2231–2244. https://doi.org/10.1039/C7EE01303E
Acknowledgements
We acknowledge the numerous colleagues in our research groups in the last years who contributed to the setup and on-going optimization of gas measurements and data evaluation, especially Richard Hegner, Carolin Urban (neé Stang), Richard Hönig and Félix Delory.
Funding
Open Access funding enabled and organized by Projekt DEAL. This work was supported by the Helmholtz Association in the frame of the Integration Platform “Tapping nature’s potential for sustainable production and a healthy environment” at the UFZ.
Author information
Authors and Affiliations
Corresponding author
Ethics declarations
Conflict of interest
The authors have no conflicts of interest to declare that are relevant to the content of this article.
Additional information
Publisher's Note
Springer Nature remains neutral with regard to jurisdictional claims in published maps and institutional affiliations.
Rights and permissions
Open Access This article is licensed under a Creative Commons Attribution 4.0 International License, which permits use, sharing, adaptation, distribution and reproduction in any medium or format, as long as you give appropriate credit to the original author(s) and the source, provide a link to the Creative Commons licence, and indicate if changes were made. The images or other third party material in this article are included in the article's Creative Commons licence, unless indicated otherwise in a credit line to the material. If material is not included in the article's Creative Commons licence and your intended use is not permitted by statutory regulation or exceeds the permitted use, you will need to obtain permission directly from the copyright holder. To view a copy of this licence, visit http://creativecommons.org/licenses/by/4.0/.
About this article

Cite this article
Neubert, K., Kretzschmar, J., dos Santos, T.R. et al. Making sense of gas measurements: quantification of multicomponent gas mixtures in biological and chemical laboratory experiments. ChemTexts 7, 27 (2021). https://doi.org/10.1007/s40828-021-00151-0
Received:
Accepted:
Published:
DOI: https://doi.org/10.1007/s40828-021-00151-0