
Abstract
Mapping the intellectual structure and dynamics of complex, multidisciplinary domains has long been a challenging task for bibliometrics. Research subjects with outstanding social relevance are typically of this sort, being multifaceted and requiring a synthesis of various field-specific perspectives. Among such subjects, our work addresses policy-related research on obesity, and aims to uncover how this multilevel issue is represented in policy studies through its dense thematic interrelations, and at the interfaces of various research areas participating in the discourse. In doing so, we propose an analytic framework combining so-called hybrid methods of science mapping with the (traditional) use of alluvial diagrams, resulting in what we refer to as “multicluster topics” and “interdisciplinarity maps”. Therefore, the contribution of this paper can be considered both at the subject and at the methodological level.
Introduction
Mapping complex scientific domains in terms of cognitive or institutional structure, development and dynamics has been both a long-standing tradition and a flourishing area within the realm of bibliometrics. These studies usually contribute to the existing knowledge base both at the subject level, such as uncovering emergent, novel research directions or systematizing complex research domains, as well as on the methodological level, via proposing and experimenting with novel science mapping methods. Uncovering the patterns of multi- and interdisciplinarity of research is one of the dedicated tasks of these attempts, especially in relation to problems that require a multi-perspective approach by nature, which is typical of complex societal issues. The main aim of the work presented in this paper is to extend this line of inquiry. Our primary goal, at the subject level, is to provide an in-depth mapping of policy-related research on obesity, being a acute societal issue with multiple interrelated scientific aspects (clinical, psychological, environmental, demographic etc.), hence heavily addressed by various disciplines. In particular, as to the subject level, our study aims to meet the following two research questions:
(RQ1) How the multifaceted thematic or topical structure of obesity issues is being represented in the research on related policies (at any level of the issue where policies can be formulated)? How this thematic representation, and its structure has been developing over time? What are the major trends of this discourse?
(RQ2) Given its apparent multidisciplinarity, what research fields and areas interact in the “policy domain”, and through which topics and conceptual frameworks? What are the key concepts or themes connecting research areas, and how their role is developing over time?
Beyond the subject level, our study also aims to provide a contribution at the methodological level, considered equally important as the subject level inquiry. One of the major challenges of science mapping approaches is the selection of indicators (references, citations, authorship, textual descriptors) and techniques (reference analyses, co-citation analysis, direct citation networks, co-authorship networks, text mining etc.) that are suitable to model the desired aspects of cognitive organization. Several studies focus on comparing these methods for “precision” (Boyack and Klavans 2010), others propose their combination in “hybrid methods” (Janssens et al. 2009; Liu et al. 2009). While our previous work aims at elaborating individual methods (such as improving bibliographic coupling techniques, cf. Soós 2014), here we joined the latter line for theoretical considerations outlined in the next section, and made an attempt to develop a version of hybrid approaches that best fitted our subject-level questions. The related objective can be formulated in a methodological research problem:
(RQ3) How can we combine existing mapping techniques (in a so-called hybrid method) that (1) grasp the topical structure and its interrelations from different perspectives (according to different techniques) and (2) connect these perspectives, while (3) allow for a meaningful interpretation with transparent dimensions, and (4) for intuitive visualization providing an overview on the different aspects and their connections?
To address this methodological issue, we combined reference-analytic and text mining approaches in a framework that utilizes a simple multivariate and visualization technique, namely, alluvial diagrams. An additional experiment was to arrive at a single visualization involving a dynamic and a structural view on how the domain is developing, without separating these into different plots and diagrams.
Related work on obesity
Obesity as a research topic has attracted great attention in the scientific literature both because its complex nature and growing societal relevance worldwide. This observation also applies to secondary research designs akin to our own approach inasmuch their main objective is some synthesis or review of the domain. Various systematic reviews or metaanalyses (characteristic of the medical and health sciences fields) have been conducted on numerous aspects of obesity, even in the policy arena (such as interventions or prevention programmes). However, as our main interest was the bibliometric approach involving large-scale mapping of the discourse (as opposed to the systematic review design), we were screening the related literature for such contributions. In general, several bibliometric studies addressing the composition of obesity research (with the broadest scope of the term) and its development have been reported in field-specific venues. Khan et al. (2016) analyzed the growth of obesity literature and the collaboration patterns at the country level using the standard databases (PubMed, Google Scholar, Scopus, WoS). The growth and distributions of the research output over geographic areas, journals, research areas and languages indexed in PubMed was the subject of Vioque et al. (2010). Similar studies dealt with specific geographic regions, such as the Arab countries (Sweileh et al. 2014). These aspects were complemented with a more detailed analysis on co-author networks, journal citation networks and simple thematic maps, based on co-occurrences of frequent terms in Yao et al. (2018), also a study on a specific clinical aspect (the role of intestinal microbiota in obesity). The topical organization of (NHLBI-) funded projects and the productivity and impact of individual topics was the key issue for Nicastro et al. (2016). However, probably the most extensive approach, being also the most relevant to our present work, has been provided in a series of recent papers best exemplified by Cassi et al. (2017). The main objective of this work was a large-scale bibliometric mapping of the intellectual structure of obesity research in general, and contrasting it with the societal demands, also formalized into a topic map (based on European parliament questions) so that the concordances between the two maps could be analyzed. In other words, the relation between research questions and policy-related questions were investigated, creating close proximity to our research goals. Our work extends this line of inquiry in a different direction, focusing specifically on policy-related obesity research as a potential interface between science and public policy (as in decision making). This complementary role can also be claimed at the methodological level: the referred study used a well-known topic modelling technique (Latent Dirichlet Allocation, LDA), to cope with the complex and densely interrelated topical structure of obesity research. Here, we propose a different framework to handle thematic complexities, to accumulate further evidence on the fine-grained structure of the policy-centred subdomain.
Data and methods
To build a bibliographic database representing policy perspectives on obesity, we used the Web of Science database (WoS, Core Collection). The search strategy we employed was deliberately simple: the query targeted items containing both “obesity” and “policy” as subject terms, i.e. these terms occurring either in the title, abstract or among the keywords of document metadata (TS = ‟obesity” AND TS = ‟policy”). The reason for this simplicity in delineating the domain was to reach a core of the literature that has an explicit connection to our research goals. In particular, we wanted to cover that part of the related studies that specifically refer to obesity as a concept/phenomenon, and name some related policies. That is why other search term combinations (truncated words, variants etc.), such as obese, obes* and the like were not applied. However, we conducted a test for this search strategy, and ran an alternative strategy, using polic* instead of policy in the query. We then contrasted the retrieved set of additional documents with the results of our analysis on the original sample. This post hoc type trial is being detailed in the “Appendix” of this paper, and shows that the majority of additional documents fits into the thematic trends revealed upon the original sample, which also supports that the original sample represents some data saturation for our present purposes. To further sharpen the focus on policy-related works, some narrowing on the resulted set of Subject Categories has been applied, retaining any SCs (and its content) that presumably covered policy perspectives.
The main methodological motivation behind our study was to elaborate and explore a science mapping device that (1) allows for uncovering the complexities of our research domain, such as the relations between the thematic/topical and semantic organization of obesity policy research and its development over time, as considered from different perspectives, but (2) provides results that are transparent enough for interpretation. In other words, some ideal trade-off between the multidimensional representation and the meaningful one has been sought for. A tool called “alluvial diagram” has proven to be highly suitable to achieve this goal, and qualified as the central element used across our mapping exercises. Alluvial diagrams have already been used in bibliometric mappings. Their typical purpose is a visualization of how the topical organization of a given area of research is evolving over time, hence depicting the development of some cluster structure along the timeline, where the career and formation of individual clusters can be observed [splitting, merging, changes in size etc., cf. Bohlin et al. (2014) or Najmi et al. (2017)]. Our approach, however, utilizes alluvial diagrams in the original fashion. In a more traditional sense, alluvial diagrams can be conceived as a type of multivariate analysis, by means of which the joint distribution of cases along multiple (typically categorical) variables can be described and visualized. In other words, the unique associations of categories through multiple variables can be grasped, together with their relative frequencies in the sample. Therefore, it is a natural way of analyzing a set of publications along various dimensions using alluvial diagrams, showing the interrelations between the selected aspects of analysis. Moreover, if we select the time dimension as one of these variables (the year/period of publication for documents in the set), we can outline the time dynamics of the associations between the other selected variables, the latter covering, for instance, the different aspects of topical organization. In such a way, we can obtain a complex picture of how a research domain is evolving. Hence, the core of our mapping procedure was to construct alluvials that reveal the linkages between the timeline and the various interrelated characteristics of obesity policy research obtained from our analyses. These analyses are summarized in the next sections.
Alluvial diagrams as multicluster topic development
Leveraging on the virtue of alluvials to represent multiple characteristics and their interrelations “at a glance”, we applied two different bibliometric document clustering methods to elicit the thematic structure of the research domain. The main idea was to model topical organization from different perspectives, and linking them together (and with the time dimension). As a way of “triangulation”, we selected methods that rely on differing indicators of document content, and are simple enough in themselves to keep the formation of dimensions transparent for interpretation.
Clusterings used in the mapping procedure
We used classical bibliographic coupling (BC-clustering), as a link-based method, and a clustering over semantic similarities (Kw-clustering), as a text-based method. By virtue of this dual approach, our exercise could be viewed as utilizing a “hybrid method” for document clustering [where link-based and text-based methods are being combined for higher precision, cf. Boyack and Klavans (2010)], although with a significant alteration (see below). The two clustering procedures are detailed below.
Link-based method: Taking the classical bibliometric perspective on topical relatedness—that is, using citation relations as its indicator—we applied a form of bibliographic coupling (BC) on our corpus to obtain clusters of papers representing a research topic. According to the basic principle of bibliographic coupling, the degree of thematic similarity between documents is proportional to the amount of their shared references. Our version consisted of the following steps: (1) after processing the references of the ~ 4000 papers, a two-mode network representing the citing relation between documents and their references has been created. (2) Based on the common connections in the network, that is, the shared references between source documents, this two-mode graph was projected into a (weighted one-mode) document similarity network, where the weights of edges conveyed the degree of similarity between nodes (documents). In the projection process, the weights were calculated via the following similarity measure (Newman 2001):
where wij is the similarity between documents i and j in terms of their cited references, r is the number of references (cited nodes) common to i and j, and Nr is the number of documents that share reference r, i.e. connected to it in the network. The measure counts common references through weighting them as to how specific a particular citation link between two papers is, via discounting the contribution of cited sources that are broadly cited through the whole corpus. In such a way, the measure favours links between papers that are more similar to each other in their common background, than to the rest of corpus. In this respect, this normalization procedure is analogous to the well-known “tf—idf” (term frequency—inverse document frequency) weighting scheme in text mining. (3) As the final step, the actual clustering of documents has been achieved by running a community detection algorithm on this similarity network constructed via bibliographic coupling, in order to delineate coherent groups of papers. The algorithm used was the “fast-greedy communities”, implemented in the igraph R package (Csardi and Nepusz, 2006) that aims to find a cluster structure where the intra-cluster similarities are always higher than inter-cluster ones. Technically speaking, the algorithm is designed to find the cluster solution that maximizes network modularity in a computationally effective way, as proposed by Clauset et al. (2004).
Text-based method as a different perspective on the thematic structure of our domain, we applied a measure of textual similarity as well. To that end, we employed the keywords of documents attributed by authors (author keywords, the field labelled with “DE” in the WoS databases). Despite the well-known indexer effect as a major criticism of the use of author keywords, we were expecting an acceptable level of representation of the most relevant concepts in this domain, that is suitable for complementing the link-based results. The clustering procedure consisted of the following steps. (1) Author keywords have been retrieved from documents, and subjected to a standard normalization procedure (minimal version of natural language processing) via word stemming. (2) Documents have been represented as vectors of these stemmed keywords, based on which their pairwise similarity was calculated. The measure applied in this case was Salton’s cosine similarity, as a broadly used normalized indicator for comparing word vectors for their similarity in document clustering. (3) From the similarity matrix, a (textual) similarity (or proximity) network of documents was created, and the actual clustering exercise was identical to the one used for the link-based method: the fast-greedy algorithm has been run over the proximity network to gain coherent groups of papers (in terms of keyword usage).
Interpretation and labelling of clusters
A crucial point in our approach to link different thematic perspectives was the interpretation of the topical or semantic clusters obtained from the various classifications. As with the clusterings, we addressed this task from different angles: (1) we characterized the clusters with the most frequent title words occurring in the title of papers belonging to the cluster, and (2) obtained the most representative papers of clusters, using the so-called “core documents” methodology (see below).
As to the first method (1), for each group (BC-clusters and Kw-clusters) title words have been stemmed, and those pertaining to the (inverted) first quartile of the frequency distribution of words within the cluster were kept as eligible for labelling. Using title words provided the advantage to have a semantic descriptor for the groups independent of the descriptors underlying group formation (references, keywords), and commonly used for both clusterings.
For triangulation, (2) a second round of labelling was achieved by using the “core documents” methodology as proposed by Glänzel and Thijs (2012). According to their definition, core documents are those elements of the cluster that “have at least n > 0 links of at least a given strength r ∈ (0, 1) according to the predefined similarity measure”. That is, these are “similar enough” to most papers in the cluster, given the thresholds (n, r) being set properly. We determined these parameters clusterwise, so that a paper had to be similar to at least 40–60% of the cluster in order to belong to the core, with a similarity value above the third quartile of the distribution of similarities (upon which the clustering was achieved). The experimentation resulted in a reasonable number of core documents somewhat proportional to the cluster size (see “Results and discussion” section). To further sharpen the meaning of clusters, we coded the core documents for their characteristic terms (with the help of two field experts among the authors of this paper), and applied this term set in the labelling of clusters.
Based on the results of these two methods, labelling was done manually by outlining the most common theme unifying the cluster. The interpretation of the labels was validated by two field experts among the authors of the present work. In practice, the two aspects effectively complemented each other in identifying common topical dimensions.
Among the methodological advantages of this framework, we can consider the following. As is the case with hybrid methods, our approach sets out a multidimensional mapping of the domain, relying on multiple descriptors of publications. However, unlike the methods introduced so far, that combine the different types of link-based and textual similarities via a composite measure (Janssens et al. 2009), we connect different similarity structures by linking, instead of combining them together. Consequently, it does not yield a unique or “consensus” classification of publications into topics, but a multidimensional classification where the individual dimensions are linked and kept transparent. It might be more difficult to interpret, but, in exchange, requires no subjective decision on, or experimentation with trade-offs in setting the weight of different similarities in the composite measure. Also, loss of information due to dimension reduction is much less an issue. Still, with the interrelations of perspectives coded by the joint distribution of papers over multiple category systems a well-defined classification can be drawn.
Another feature we consider valuable in this framework is its rich potential to express thematic relations. First of all, in aligning two types of classifications one can be used to validate the other (high concordance between classifications or semantic similarity). Also, a more granular classification can further stratify the results of a more robust one, introducing hierarchic relations into the thematic structure. What’s more, the explicit categories yielded by the text-based method may be used as a semantic or conceptual characterization of the link-based categories, given their linkages. Perhaps more importantly, however, this kind of projection of the semantic dimension onto the link-based dimension allows for the discovery of several kinds of overlaps between topics. Although the individual clusterings does not handle topical overlaps, as popular topic detection techniques such as LDA, their interrelations do. A connection between two link-based cluster and a semantic cluster indicates their conceptual or thematic intersection, or, conversely, a conceptual system connecting differing research traditions (link-based clusters). On our account, the potential to reveal such complexities is an important strength of the alluvials-based approach.
Alluvial diagrams as interdisciplinarity maps
For addressing (RQ2), we exploited the potential of alluvial diagrams in a further application. In order to analyze the interplay between research fields contributing to the discourse, and, more precisely, to reveal the interconnections between topics, concepts and fields over time, we created another type of three-way alluvial diagrams, that visualize the distribution of unique associations between WoS Subject Categories, a variable we call “key concepts”, and Publication Years throughout the bibliographic sample. We considered key concepts those author keywords that fulfilled two criteria: (1) high frequency of occurrence, and, more importantly (2) connecting different fields, i.e. occurring at the intersection of at least two Subject Categories. For measuring the extent of mediating between categories, we used the Shannon entropy or diversity measure, often employed in IDR research:
where CatF is the number of Subject Categories, and pi is the relative frequency of the keyword in the i-th Category. The higher the value of this measure is, the more even is the distribution of the given keyword (in its occurrences) over the more categories, so the higher its connecting potential can be conceived. The final set of key concepts was delineated via setting some thresholds for these two indicators (frequency, diversity).
Results and discussion
Basic statistics of the bibliographic record
Our query targeting the thematic intersection of obesity and policy retrieved n = 4340 documents. Some of the basic statistics for this record are reported in Table 1, indicating the average annual number of publications and journals for consecutive, equal-length periods, along with the standard deviation of these frequency distributions. Striking is the fact that both the mean number of publications and publication venues (journals) goes through an exponential-like growth, with a sudden increase in the last decade, as these periods witness an order of magnitude higher amounts than the previous ones. This dynamics is also mirrored in plotting the annual percentage share from the total amounts against publication years (Fig. 1), where the rather steep slope from the 2000s on indicate this high growth rate both in publication output and journal composition.

The growth of publication output and number of journals in the corpus (p.pub: share of number of papers, p.so: share of annual number of journals from the total number of papers and journals, respectively)
Inspecting the “high end” of the journal distribution, i.e., the most frequent journals occurring in the (inverted) first quartile per year, 9 titles appear on the list (Table 2), with a main focus on public health and related areas (nutrition, environment, health promotion), preventive medicine and pediatrics. In a time perspective (Fig. 2), it is striking that in the decade between the early 2000s and 2010, Public Health Nutrition (PUHN) and the American Journal of Preventive Medicine (AJOPM) have been the leading venues, along with an increasing role of Pediatrics (PEDI), while from 2010 the BMJ Journal of Public Health (BMPH) became the most prominent publication venue, recently complemented with Plos One (PLOO) and the International Journal of Environmental Research and Public Health (IJOERAPH). So as to the volume of the output, despite the high and growing number of journals, research seems to be concentrated in a few leading venues characteristic of consecutive periods. Also, some indication of the growing and broadening scientific interest is also visible, so far as more specialized journals (in nutrition or pediatrics) are being gradually complemented by generalist ones (such as Plos One).

The annual distribution of the most frequent journal titles in the corpus
The statistics on field composition (Table 3), narrowing the scope to the most frequent WoS Subject Categories in the usual first quartile, also conveys a high concentration in a dominant category (Public, Environmental and Occupational Health). A first impression on the theoretical frameworks can be gained through the dynamic view of this composition (Fig. 3). Aside from this dominant category (for better readability, we omitted this from the figure), some fields can be identified leading and almost “monotonically” increasing its role in the last decade: Health Care Sciences and Services (HCS&S), Business and Economics (Bs&E) and Nutrition and Dietetics (Nt&D) are the most prominent ones, while Pediatrics (Pdtr) or General and Internal Medicine (G&IM), while significant on the whole, has been fluctuating as to its rank in the annual profiles. A similar fluctuation is present for Agriculture (Agrc) and Food Science (FS&T) or Psychology (Psychl) with low annual shares, while Educational Research (E&ER) is trending in recent years.

The development of the field composition within the discourse, and the weight of individual fields
The multidimensional characterization of thematic development
The results from the two clustering methods are presented in Tables 4 and 5, for the BC- and the Kw-based classification of our documents, respectively. In the tables below, cluster IDs and labels are being reported, while in the “Appendix” it is complemented with (1) the most characteristic title words from the core documents of the cluster, i.e. “core terms”, and (2) the most frequent title words from the whole cluster (Tables 9 and 10 for the BC- and Kw-based clustering, respectively). In the case of core terms, the frequency of individual words and phrases are also shown, since it is not only the number of occurrences that qualifies a core term characteristic. For small clusters, all papers have been taken into account for interpretation (collected in the “Appendix”, in “Data and methods” section.), so that no core documents and terms are being reported. For brevity and better visibility, cluster IDs are also used in the alluvials to name clusters.
The size distribution of clusters is given by the margins of Table 6 (a confusion matrix of the two classifications, see below), where cluster #0 contains the “unclassified” part of the corpus due to the lack of either references or author keywords in the database. It can be seen that both techniques resulted in a reasonably balanced structure in that most clusters consist of several hundreds of documents, while some small groups emerged from both procedures. Bibliographic coupling provided a much higher “coverage” over publications, i.e., a much fewer amount of unclassified cases, which in itself demonstrates the complementary roles of these techniques. Labelling the clusters demanded the joint interpretation of textual profiles (frequent title words) and core terms, given the significant overlap in title word sets, that, to some extent, prognosticated the high thematic interrelatedness among clusters (see below). Also, title words in several cases much less characteristic of the main theme, than core terms and documents (cf. BC cluster #5). However, the most frequent title word(s) in most cases seemed congruent with the common topic characterized by core document titles (for the full list of core documents and small cluster items, cf. Tables 11, 12, 13 and 14 in the “Appendix”).
Our primary question, (RQ1), is addressed by evaluating the joint distribution of publications along both clusterings plus the time dimension, using alluvials. The alluvial diagrams created for this purpose are being shown in Fig. 4. For a better readability, three versions of alluvials has been made: (A) the first one is the simplest, “two-way” diagram, that only shows the relationships between the two clusterings. Given only two dimensions, the joint distribution of publications can also be represented by a so-called confusion matrix, a cross-tabulation of the two clustering variables, where cell values contain the number of papers in the intersection of the corresponding clusters—for the first alluvial, this matrix is reported in Table 6, where the color code (shades of blue) highlights the strength of the relationship. (B) The second one is already of the “three-way” form proposed in this paper, incorporating the time dimension, that is, it shows the linkages between publication years and the two clusterings. (C) The third type of alluvials only differs from the second one in the granularity of the time variable, as publication years are being aggregated into approx. 5-year periods. The reason for this is to have a more robust picture on how topics are distributed along the timeline. Robustness was also the reason behind setting a constraint on which stripes (publication sets with a given publication year and cluster memberships) were left visible on the diagrams: a minimum of 10 papers per year was specified as a threshold. Beyond connections, block sizes also convey a useful information, as these are proportional to the frequency of category values (cluster sizes or weight of publication years). As to the terminology, a topic will be referred to as a connected set of BC- and Kw-clusters, i.e. a “multicluster”, within which individual stripes are considered as subtopics. In order to improve the clarity of visualizations, we omitted the cluster #0 from both clusterings, that is, the cluster containing the unclassified cases in the respective grouping.

Alluvial diagrams representing the relationship between the clusterings and the time dimension
Quantitatively speaking, both the two-and three-way diagrams exhibit a relatively high concordance between BC and Kw clusters: the largest proportion of BC-clusters or research traditions (i.e. the widest, or the majority of stripes) is being classified under a single corresponding Kw-cluster or semantic class. The concordance of the two classifications is also reflected by the coloring of the confusion matrix (Table 6), conveying the overlap between BC- and Kw-clusters in document coverage. The majority of documents in most major (sizable) clusters is being concentrated in a single cell, indicating a basically (though not technically) one-to-one relationship between the respective clusters. In order to make this pattern more explicit, we constructed a two-mode similarity network of the two clusterings (Fig. 5), with two sets of nodes representing BC- and Kw-clusters, respectively, and edges showing an overlap between two such nodes. The width of an edge is proportional to the extent of the overlap (from the BC-perspective), and red links indicate that at least 40% of the papers in the BC-cluster is covered by the corresponding Kw-cluster. The visualization also reinforces the match between the clusterings, since red lines tend to exhibit a one-to-one assignment (BC_3 and Kw_3; BC_6 and Kw_1 etc.), as BC-clusters tend to strongly connect to one Kw-cluster. Kw-clusters, or “subtopics”, on the other hand, seem to be more common, but, as to strong connections, still having an affinity to only one or two BC-groupings.

Two-mode similarity network of BC and Kw clusters (see the text for details)
In order to provide an overall quantitative evidence for the concordance, we have calculated the Rand index between the two groupings. The Rand index (abbreviated here as R) is a statistical measure of the similarity between two clusterings of the same dataset (the technical definition is given in the “Appendix”), and its value ranges between [0, 1]. The closer its value to the possible maximum, R = 1, the better the agreement between the two groupings. For our classifications, we obtained a value of R = 0.7 as the degree of similarity between the BC- and Kw-clustering, which, being close enough to unity, is generally considered to be a sign of good alignment.
Beyond the correspondence between the classifications, the next important observation (via the three-way diagrams) is that almost all topics are concentrated in the last 10-year period, and that almost all topics show an increase (in size) in the last 5 years, so that an upward trend emerges for the whole topical structure. This is very much in line with the rising curves obtained for publication numbers for this period, showing that this increase is multidirectional, covering a diverse and balanced thematic composition of this output.
Qualitatively, or content-wise, in order to elicit the thematic development of our domain, we follow the strategy of interpreting each multicluster topic relying on the interrelations of BC and Kw clusters (i.e. interpreting the two-way alluvial diagram using the cluster labels), and then linking them to the time dimension (i.e. via the three-way alluvial diagrams). The most salient BC cluster, #3 on risk factors of childhood obesity is mostly linked to the Kw cluster #3 on risk factors of overweight, children, and, to a smaller extent, to Kw #2 on public health policies and obesity prevention. The topic is constantly present since 2007, but increases its weight in the last five decades. The second biggest BC cluster, #6 focusing on physical activity and health promotion has a similarly strong affiliation with a specific Kw cluster, #1 on physical activity, built environment and active living, but this topic is somewhat more stratified, as BC#6 is, to a letter extent, also connected to Kw#2 (prevention) and Kw#3 (overweight). This topic is also abundant in the last decade, but reaches a higher volume in the recent period (with all subtopics). This high level of concordance can also be observed between BC#4 on economics of food policies (food policy, farm policy, taxation, public economic policy on consumption) and Kw#4 on food environment in school nutrition, where smaller proportions of the BC cluster are again linked to two further Kw blocks (Kw#2 on prevention and Kw#3 on overweight). Its subtopics mostly pertain to the last 5-year period, while the first appearance of the major subtopic (food environment) is in the previous interval. Screening the diagrams further, BC#7 with food marketing and communication policies, consumer behavior tends to be divided between several Kw clusters,—resulting in a semantically multifaceted topic—including Kw#2 (prevention) and Kw#4 (food environment) as the more prevalent subtopics, as well as Kw#3 (overweight) and Kw#5 (Childhood obesity prevention, active living and community-based instruments), in smaller proportions. The rather complex topic is clearly a product of the last period, within which it is equally distributed between the consecutive years. Cluster BC#8 on School nutritional policies and instruments, competitive and healthy nutrition closely resembles BC#7 in its semantic composition, with an even more equal distribution among the same Kw clusters (Kw#2, Kw#4, Kw#5, Kw#3), and with its subtopics also concentrated in the most recent period, as a relatively new topic. The last two prominent BC clusters (similar in terms of size) constitute a topic with one or two Kw clusters: BC#5, food environment, is practically aligned with Kw#4 (food environment in school nutrition)—aside from some subtopics being classified under Kw#3 (overweight) and Kw#2 (prevention), whereas BC#2 on interventions and particular, community-based programmes (especially for childhood obesity) has weak connections to Kw#2 and Kw#5, that is, the cluster on childhood obesity prevention, active living and community-based instruments, respectively. Again, both topics, BC#5 and BC#2 expands in the last 5-year interval (being concentrated mostly in most recent 3-year period).
We might summarize the findings concerning the dominant topical structure of our domain and its development as follows (Table 7, dominant subtopics are written in bold)
Upon this overview of the resulted structure, several observations can be made. Firstly, the two clusterings (topics and subtopics) show a fairly coherent thematic picture, with subtopics fitting into, and elaborating on the meaning of general topics. Secondly, although the whole spectrum of factors and determinants of obesity, both at the individual (e.g. dietary patterns) and various community and economic levels (sociodemographic factors, schools, education, consumption etc.), can be seen as continuously trending, the dominant theme associated to most factors is that of food environment, and school-related issues. This two general theme seems to be the main focus of recent approaches to obesity form policy perspectives. These themes relating various BC-clusters also provides evidence that the topics are densely overlapping. This interrelatedness is further confirmed by the other (semantically defined) subtopics being common to many research directions (BC-clusters). Finally, some small BC- and Kw-clusters are underrepresented in the alluvials, showing scarce connections (under the thresholds set for stripes be visible), such as the quite coherent BC-theme on trade and globalization as a factor of obesity as a global disease (#9), or the very small but distinctive BC-cluster on internet behavior (#11). This fact underlies the role of the original clusterings to complement the “dominant” structure outlined by cluster interrelations.
Key concepts connecting research fields: interdisciplinarity and its development
In order to address (RQ2), another type of three-way alluvial diagrams has been applied. Similarly to the multicluster view, these diagrams connect the time dimension (in the aggregated form) with two further variables, key concepts and research fields (WoS Subject Categories) through their associations in the publication output under study. Since we are primarily interested in the patterns of interdisciplinarity, the role of key concepts in connecting research areas, we designed the alluvials to highlight these interconnections. As many concepts with high connecting potential are very much distributed among research fields, but would be suppressed in the alluvials by concepts with higher frequencies in the related categories, two types of diagrams have been created: the first one reports the main trends with concept occurrences above 10/category are made visible only (Fig. 6), and the other conveying latent trends where occurrences below this threshold are visible only (Fig. 7, “Appendix”). Concepts are sorted into different diagrams for better readability, only. Among the author keywords of the corpus about forty (n = 39) key concepts were identified, according to the procedure described in the “Data and methods” section, with a diversity threshold H > 1.5 and a frequency threshold F > 100 (based on the distribution of both values). These key concepts are listed in Table 8 (in their stemmed version), along with the indicator values applied for their selection. Concepts in the table are being ordered by diversity/entropy (that is, their distribution over research fields), the leading concepts bearing the highest potential in connecting fields. For contrasting the connecting role and the weight of key concepts, their frequency of occurrence is plotted against the entropy measure in the table.


Alluvial diagrams representing the interrelations between key concepts, research fields and the time dimension (interdisciplinarity maps): main trends (threshold for visible stripes > 10 occurrence per year)
In what follows, we will interpret the alluvial diagrams starting with the concept group contributing most to the multidisciplinarity of our domain (highest diversity values), which is practically the first column of Table 8. Filtering out the general themes (health, public health, nutrition, health policy etc.) we are left, in approx. the order of frequencies, with “obesity indicators” (body mass index, overweight), children as distinguished target group (childhood obesity, children, parent, and we can assign to this thematic axis adolescent as well), food policies (food policy, food, diet), and some prevalent factors and risks or regions of interest (socioeconomic status, diabetes, China, respectively). Concepts in the second column can be roughly assigned to these categories (see the detailed overview below), except physical activity, which is the most frequent key concept in the list, deserving a separate description.
Consulting the alluvials (Fig. 6), obesity indicators seem to serve as a common language among fields, connecting mainly Nutrition and Dietetics (through overweight but not the BMI, interestingly) and Pediatrics with Business and Economics and the Biomedical Social Sciences, but with stronger presence in the previous than in the most recent periods.
Childhood obesity and the related terms also link Business and Economics or Educational Sciences with Pediatrics, Nutrition and Health Care Sciences and Services with a constant prevalence in the last decade. The connecting role of parent is more extensive and latent, encompassing most areas with low frequencies per field, as shown in Fig. 7, but increasing its presence in the most recent period. On the other hand, school, while being a bridge between educational, clinical, nutritional and pediatric fields, mostly appears in between 2008 and 2013, which signals some shift of emphasis from institutional to family-related factors of childhood obesity.
Food policy as a term is rooted both in Business and economics and Agriculture, but seems more timely in connection with Nutrition and Dietetics, as the former stripes connect to only earlier periods. Fast food also appears as a less timely concept from mainly Business and Economics. Food environment, however, as a bridge between Education studies and Nutrition is a more recent framing of this perspective on obesity (linking to the latest period), while diet connects most fields (clinical, social and economic sciences) and concentrated in the last time interval. Sugar-sweetened beverages, as a specificity of this category generating much attention, is again a constant and highly multidisciplinary topic.
Physical activity is a prevalent concept in terms of size, and links the educational, clinical and health-related categories with pediatric issues. Its presence is continuous over time up to the very recent years. On the other hand, physical education is only attached to Educational Research (at least in the main trend diagram) with a similar distribution over the timeline.
Prevalent factors and risks of obesity exhibit a more subtle role in connecting areas, as the previous “massive” conceptual structures, in that many of them only expressed in the diagrams with latent connections (Fig. 7). Socioeconomic status as a key concept is equally present in all fields, and in the last decade, though with much lower frequency as per subject area. Diabetes behaves the same way, somewhat increasing its weight only within Nutrition in the last period. Distinctive in this respect is the concept of health disparities, at the intersection of Educational Research, Health Care Sciences, Nutrition and Pediatrics, as it connects these areas clearly in the most recent period. In contrast, nutrition transition and environment link most areas but in a less timely fashion. Finally, as a single concept signalling a joint attention on a geographic aspect of obesity policy, China has its related fields divided along the timeline, with an earlier contribution from Business and Economics, Agriculture and Biomedical Social Sciences, and with a most recent interest from clinical, health and nutritional sciences (G&IM, HCS&S, Nt&D).
Conclusions
In the present study we addressed the changing conceptualization of the complex and multilevel issue of obesity in policy-related research, uncovering its topical organization from different perspectives, and at the interfaces of the various research areas participating in the discourse. To this end, we proposed a science mapping framework utilizing hybrid (text-based and link-based) techniques, and deploying alluvial diagrams in mapping the interrelations between the different thematic perspectives, key concepts, research areas and their development over time. The two mapping approaches, the detection of “multicluster” topics and key concepts connecting research areas yielded quite convergent results: the topical structure and conceptual focus in the last 10 years appears to remain highly balanced with almost all topics and concepts getting more and more attention. The rich semantic overlaps between topics and the key concepts connecting clinical, economic, social, agricultural etc. sciences provide evidence for the high interconnectedness and common focus within the domain. There is a clear agreement between the results of both mappings that it is the themes of food environment and childhood obesity that connect the most thematic blocks and field-specific approaches (though the multicluster view picture school-related issues as constantly on the surface, for key concepts there seems to be a shift of emphasis towards family-related factors, such as the role of parents). The topics emerged in our mapping are also comparable to those identified in Cassi et al. (2017) as “social issues”/”social environment”, which is fairly acceptable for studies with a policy focus. On the other hand, there seems to be an increasing contribution from individual health-related fields, with closer proximity to the clinical sciences, viz. nutrition and dietetics to the policy discourse.
The usefulness of this dual mapping for understanding obesity-related policy research is mainly manifested in the insights gained into the latent thematic stratification of the domain. Obesity as a research topic has attracted great attention in the scientific literature both because its complex nature and growing societal relevance worldwide. It is a research subject with outstanding social relevance, being multifaceted, has various interacting social strata, and requires a synthesis of various field-specific perspectives. As such, it is especially difficult and challenging to tackle for policy-makers. To best address this challenge, the mapping reported here provides an overview of how the thematic and disciplinary structure of obesity issues is being represented in the research on related policies. It has been made explicit that, as the most general structure of the discourse, the central issue of childhood obesity is mainly contextualized, through its risk factors, at the local level of school nutrition, education, related interventions and local food environments, as well as at the national and global levels of food policies, food markets, health disparities, global deseases and food-related communication. The other pillar of this context is the issue of physical activity and health promotion, which is strongly linked, beyond health promotion means, to the interrelated topics of the built environment and lifestyles.
In terms of the proposed methodology, the alluvial-based framework, combined with a hybrid mapping, has proven to be efficient in relating different thematic classifications, as providing a mutual validation and stratification between them, expressing thematic overlaps, and their unfolding over time.
References
Bohlin, L., Edler, D., Lancichinetti, A., & Rosvall, M. (2014). Community detection and visualization of networks with the map equation framework. In Y. Ding, R. Rousseau, & D. Wolfram (Eds.), Measuring scholarly impact (pp. 3–34). Cham: Springer.
Boyack, K. W., & Klavans, R. (2010). Co-citation analysis, bibliographic coupling, and direct citation: Which citation approach represents the research front most accurately? Journal of the American Society for Information Science and Technology,61(12), 2389–2404.
Cassi, L., Lahatte, A., Rafols, I., Sautier, P., & De Turckheim, E. (2017). Improving fitness: Mapping research priorities against societal needs on obesity. Journal of Informetrics,11(4), 1095–1113.
Clauset, A., Newman, M. E., & Moore, C. (2004). Finding community structure in very large networks. Physical Review E,70(6), 066111.
Csardi, G., & Nepusz, T. (2006). The igraph software package for complex network research. InterJournal, Complex Systems,1695(5), 1–9.
Glänzel, W., & Thijs, B. (2012). Hybrid solutions—The best of all possible worlds?. Bibliometrie-Praxis und Forschung, 1.
Janssens, F., Zhang, L., De Moor, B., & Glänzel, W. (2009). Hybrid clustering for validation and improvement of subject-classification schemes. Information Processing and Management,45(6), 683–702.
Khan, A., Choudhury, N., Uddin, S., Hossain, L., & Baur, L. A. (2016). Longitudinal trends in global obesity research and collaboration: A review using bibliometric metadata. Obesity Reviews,17(4), 377–385.
Liu, X., Yu, S., Moreau, Y., De Moor, B., Glänzel, W., & Janssens, F. (2009). Hybrid clustering of text mining and bibliometrics applied to journal sets. In Proceedings of the 2009 SIAM international conference on data mining (pp. 49–60). Society for Industrial and Applied Mathematics.
Najmi, A., Rashidi, T. H., Abbasi, A., & Waller, S. T. (2017). Reviewing the transport domain: An evolutionary bibliometrics and network analysis. Scientometrics,110(2), 843–865.
Newman, M. E. J. (2001). The structure of scientific collaboration networks. Proceedings of the National Academy of Sciences of the United States of America,98, 404–409.
Nicastro, H. L., Belter, C. W., Lauer, M. S., Coady, S. A., Fine, L. J., & Loria, C. M. (2016). The productivity of NHLBI-funded obesity research, 1983–2013. Obesity,24(6), 1356–1365.
Soós, S. (2014). Age-sensitive bibliographic coupling reflecting the history of science: The case of the Species Problem. Scientometrics,98(1), 23–51.
Sweileh, W. M., Sa’ed, H. Z., Al-Jabi, S. W., & Sawalha, A. F. (2014). Quantity and quality of obesity-related research in Arab countries: Assessment and comparative analysis. Health research policy and systems,12(1), 33.
Vioque, J., Ramos, J. M., Navarrete-Muñoz, E. M., & García-de-la-Hera, M. (2010). A bibliometric study of scientific literature on obesity research in PubMed (1988–2007). Obesity Reviews,11(8), 603–611.
Yao, H., Wan, J. Y., Wang, C. Z., Li, L., Wang, J., Li, Y., et al. (2018). Bibliometric analysis of research on the role of intestinal microbiota in obesity. PeerJ,6, e5091.
Acknowledgements
Open access funding provided by Library and Information Centre of the Hungarian Academy of Sciences (MTA KIK). This research has been supported by Food Science doctoral school of Szent Istán University and Research fond No. EFOP-3.6.3-VEKOP-16-2017-00005.
Author information
Authors and Affiliations
Corresponding author
Appendix
Appendix
- 1.
Labels and keyword profiles of clusters resulted from the two clusterings (BC, Kw) (see Tables 9 and 10).
Table 9 Labels and keyword profiles of clusters resulted from the bibliographic coupling (BC) Table 10 Labels and keyword profiles of clusters resulted from the semantic similarity network - 2.
Core document titles for clusters and the document content of small clusters (see Tables 11, 12, 13 and 14).
Table 11 Core document titles retrieved for the BC clusters Table 12 Small BC clusters Table 13 Core document titles retrieved for the Kw clusters Table 14 Small Kw clusters - 3.
Alluvial diagrams for latent trends (see Fig. 7).
Fig. 7 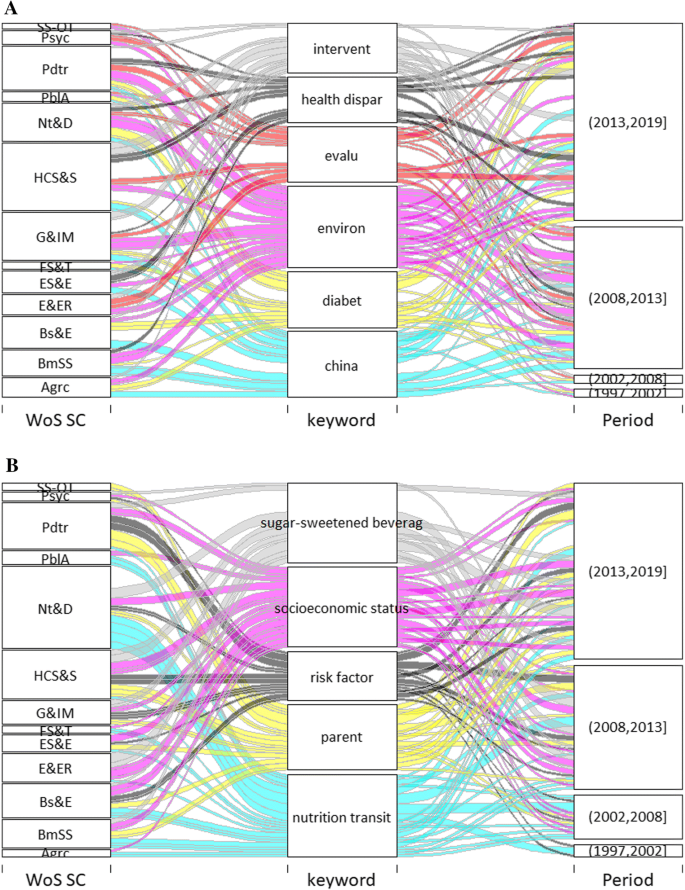
Alluvial diagrams representing the interrelations between key concepts, research fields and the time dimension (interdisciplinarity maps): latent trends (threshold for visible stripes < 10 occurrence per year)
- 4.
Description and results of the test for the search strategy.

The alternative search strategy referred to in “Data and methods” section consisted of the following WoS query:
(TS = obesity AND TS = polic* NOT TS = policy) AND DOCUMENT TYPES: (Article)
Indexes = SCI-EXPANDED, SSCI, A&HCI Timespan = 1975–2018
The search retrieved n = 247 documents, that can be considered additional to the ~ 4000 titles obtained within the original sample. Of this set, n = 124 were deemed relevant to our research question, containing a topic-related term, namely, variants of “policymaker” (all other documents contained unrelated variants of the stem, such as “police”, “policemen” etc.).
This 124 items were manually screened by two field experts among the authors of this paper, who could assign these additional items to corresponding clusters resulted from our analysis, namely:
Physical activity, health promotion (BC)—physical activity, built environment and active living (Kw);
Food environment (BC)—Food environment in school nutrition; public health policies and obesity prevention (Kw);
Risk factors of childhood obesity (BC)—risk factors of overweight, children; public health policies and obesity prevention (Kw).
Upon this post hoc exercise, the original data sample can be considered as having reached a reasonable information saturation to serve our research purposes.
- 5.
Definition of the Rand Index.
Given two clusterings (partition) C1 and C2 of the same set of S, the Rand Index is the ratio of the number of pairs in S that are being classified similarly both in C1 and C2, to the number of all possible pairs in S:
where S = pairs classified into the same cluster in C1 and C2 respectively; D = pairs classified into different clusters in C1 and C2 respectively.
Rights and permissions
Open Access This article is distributed under the terms of the Creative Commons Attribution 4.0 International License (http://creativecommons.org/licenses/by/4.0/), which permits unrestricted use, distribution, and reproduction in any medium, provided you give appropriate credit to the original author(s) and the source, provide a link to the Creative Commons license, and indicate if changes were made.
About this article

Cite this article
Kiss, A., Fritz, P., Lakner, Z. et al. Linking the dimensions of policy-related research on obesity: a hybrid mapping with multicluster topics and interdisciplinarity maps. Scientometrics 122, 159–213 (2020). https://doi.org/10.1007/s11192-019-03293-8
Received:
Published:
Issue Date:
DOI: https://doi.org/10.1007/s11192-019-03293-8