
Abstract
This study aims to understand the impacts of Pokémon GO, a popular location-based augmented reality (AR) mobile gaming app, on route and mode choices. Pokémon GO leverages AR to introduce virtual objects at fixed and dynamic locations that translate through the app interface to incentives in the real world that potentially influence users’ route and mode choices. Its gaming nature and social components can possibly enhance long-term user engagement through applying the characteristics of game elements and providing opportunities for competition, collaboration, companionship, and social reinforcement. An online survey is conducted to collect the self-reported behavior of a group of Pokémon GO users to explore its impacts on the following aspects of travel behavior: (1) the frequency of changing the route to interact with virtual objects; (2) the likelihood of carpooling more instead of driving alone for more in-app collaboration; and (3) the likelihood of shifting mode from drive alone to public transit, walking, and cycling if provided with additional incentives. The ordered survey responses including frequency and likelihood are analyzed using random parameters ordered probit models to account for the unobserved heterogeneity across users and identify subpopulations of travelers who are more susceptible to the influence of Pokémon GO. The modeling results identify four types of variables (attitude and perceptions related to Pokémon GO, app engagement, play style, and sociodemographic characteristics) that affect users’ travel behavior. The results illustrate that such apps with integrated AR, gamification, and social components can be used by policymakers to influence various aspects of travel behavior. The study findings and insights can provide valuable feedback to system operators for designing such apps to dynamically manage traffic in real-time and promote long-term sustainable mode shifts.
Introduction and motivation
Growing automobile dependency and usage has led to increased traffic congestion, air pollution, productivity loss and physical inactivity in many metropolitan areas (Kenworthy and Laube 1999; Williamson 2016; Guo et al. 2018). Extensive efforts have been made to develop strategies that can influence short- and long-term travel decisions to address goals from the perspectives of the system operator (such as a traffic control center, or a public or private transportation system management agency) and/or individual travelers. Short- to medium-term strategies aim to influence within-day and day-to-day travel decisions (such as route, departure time and non-work trip destinations) of individual travelers to improve the system performance. Long-term strategies focus on influencing mobility and lifestyle decisions. These mobility and lifestyle decisions can include making long-term sustainable mode shifts from driving alone to alternative sustainable travel modes such as riding public transit and using non-motorized modes (walking and cycling) to meet system-level goals (e.g., gradually reducing travel-related emissions) and/or individual-level goals (e.g., adopting green lifestyle and improving personal health). In such contexts, structural measures, market-based solutions and behavioral intervention strategies are widely used to influence travel decisions (Bamberg et al. 2011).
Structural measures involve making physical infrastructure changes, such as adding new lanes or roads. Market-based solutions include various types of price-based (e.g. tolling) and quantity-based (e.g. tradable credits) instruments. While such strategies can achieve short-term success in addressing system-level goals from the perspective of the system operator (such as managing travel demand and/or congestion), they alone may not be effective in the long-term (Li et al. 2019). Further, structural measures can entail high investment costs, negative environmental impacts, and political resistance (Stopher 2004). Similarly, market-based solutions can raise issues of public acceptance and equity (Li et al. 2019). Also, the robustness and effectiveness of these strategies depend on the prediction accuracy of travel behaviors and traffic conditions. However, associated prediction models (such as route choice behavior and travel demand estimation) often use indirect inferencing based on demographic data, survey data, and aggregated traffic data from sensors. Further, the model estimation problem is typically underdetermined due to the lack of adequate data.
Mobile apps for behavioral intervention strategies
Behavioral intervention strategies provide information-based feedback to travelers so that they voluntarily change their short- and long-term travel decisions (Ben-Elia and Shiftan 2010; Guo and Peeta 2017; Sunio and Schmöcker 2017). Recent advances in mobile technologies and the proliferation of smartphones have led to several research and commercial efforts to design mobile apps to influence users’ short- and long-term travel decisions. Table 1 summarizes some related studies based on the types of feedback, design purpose, benefits provided, gamification components, and social components.
The types of information-based feedback provided can be classified into three main categories: economic (e.g., travel time and monetary costs), health (e.g., amount of physical activity), and environmental (e.g., carbon emissions) feedback on their departure time choice, route and mode choices, and other travel-related decisions. It can provide pre-trip and en route information as well as en route and post-trip feedback. The app’s design purpose is based on the stated primary purposes of the app developers which include promoting physical activity, promoting route change, promoting mode change, and improving system-level performance (e.g., reducing total system energy consumption). The benefits provided by the app can be classified into direct tangible benefits, indirect tangible benefits, and intangible benefits. Direct tangible benefits include three commonly used incentivizing methods: financial incentives/rewards (e.g., cash), discounts on third-party services or products, and/or point-based loyalty programs that can be redeemed for rewards or services (Shaheen et al. 2016). Indirect tangible benefits include the information and feedback provided by the app that can lead to more informed travel decisions resulting in money and time savings (e.g., a faster route). In other words, information-based feedback is a form of indirect tangible benefits. Intangible benefits represent benefits that cannot be quantified or monetized such as a sense of involvement, satisfaction, and achievement that can be provided through gamification and social components. Gamification components represent the usage of gameplay mechanisms such as virtual badges and avatar, points and a leaderboard system (e.g., collecting points for using bus and ranking users based on the points collected), and mobility quests and challenges (e.g., cycling to work instead of the bus) (Van Grove 2011; Zichermann and Cunningham 2011; Marczewski 2013; Tate et al. 2015). Social components include social comparison (e.g., comparing badges collected or points collected), social competition (e.g., competing with other users for most points collected), social sharing (e.g., sharing personal achievements on social networks), and social collaboration (e.g., collaborating with other users through carpooling to gain mutual benefits). These social components often promote online and face-to-face interactions among users, which can potentially lead to the formation of social communities of users.
These apps leverage the large market penetration rate of smartphones (over 80% of the U.S. population uses smartphones in 2019 according to Pew Research Center (2019)) as a ready-to-use platform to deliver information-based feedback to users. Tracking mechanisms in these apps use mobile phone sensors such as accelerometer and Global Positioning System (GPS) to collect information on individual users’ time profiles of location, physical activities, and route and mode choice decisions. By providing such information-based feedback, these apps help users to make informed route and mode choice decisions, improve awareness of travel-related impacts, and foster sustainable travel behavior for making long-term mode shifts from driving alone to alternative modes. In addition, some of the apps (e.g., SUPERHUB and Ubigreen) introduce gamification and social components that can potentially improve their attractiveness and foster long-term sustainable mode shifts (Zichermann and Cunningham 2011; Marczewski 2013).
UbiGreen, PEIR, i-Tour, PEACOX, and QT are some of the early efforts in creating mobile apps for promoting sustainable mode shifts. UbiGreen is one of the first mobile apps that is designed to promote long-term sustainable mode shifts (Li and Landay 2008; Froehlich et al. 2009). It tracks individual users’ mode choice based on cellphone sensors and participants’ self-reported mode choice for each trip. It also provides economic, health, and environmental feedback in the form of icons (i.e., gamification) to indicate whether the mode of transportation that a user previously used is money-saving, relaxing, good for exercise, or offered the opportunity to read. It also offers intangible benefits to its users in the form of changing wallpaper displays if the user is using a sustainable travel mode. Froehilich et al. (2009) conducted a 3-week study in Seattle and Pittsburgh and found that 10 out of its 13 participants did not feel UbiGreen changes their behavior and concluded that most of the participants had relatively “green” lifestyles (e.g., using the bus to travel for some trips) already. Three participants self-reported that they experienced travel behavioral changes such as carpooling, biking, and walking more for some activities because of using UbiGreen. The study concluded that a more comprehensive feedback system such as a weekly travel summary and additional gamification elements such as points and a leaderboard system should be added to UbiGreen. Mun et al. (2009) developed the Personal Environment Impact Report (PEIR) to promote sustainable mode shifts by providing its users with environmental feedback in the form of gamified emission score (travel-related emissions) and exposure score (exposure to sensitive sites, smog, and fast-food establishment). PEIR also includes social sharing and social comparison that enable its users to compare these scores with other app users in a ranking system. However, the authors are unable to find studies on its effectiveness in changing people’s travel behavior.
A personal mobility assistant app (i-Tour) proposed by Magliocchetti et al. (2011) enables users to visualize their travel mode options (indirect tangible benefits) and obtain economic and environmental feedback in terms of travel time and distance to the destination, total emission, and travel cost. Magliocchetti et al. (2011) suggested that gamification components could be added in the app for creating a playful experience in the future to promote transit usage. They also mentioned the importance of adding social components in the gamified app to increase competition and collaboration among its users to increase their awareness of sustainability and promote sustainable and healthier travel habits. Schrammel et al. (2013) proposed a conceptual framework for an app named Persuasive Advisor for CO2-reducing Cross-modal Trip Planning (PEACOX) to promote sustainable mode shift by providing mode choice options (indirect tangible benefits) and environmental feedback (CO2, NOx, SO2, and PM10) to its users. The authors are unable to find field test results of PEACOX. Jariyasunant et al. (2013) proposed a Quantified Traveler app (QT) that is designed to promote long-term sustainable mode shifts and influence trip choice (i.e., whether to travel or not) by providing economic, health, and environmental feedback to its users (indirect tangible benefits). It also has social comparison that allows users to compare their performance with the regional and national averages such as weekly distance traveled. Jariyasunant et al. (2015) conducted a 3-week experiment of QT with 78 valid participants (most of whom were undergraduate students of UC Berkeley and got paid hourly for doing the experiment). The experiment results show that participants who drove on two or more days per week (N = 15) reported significant drops in the weekly distance traveled by car (from 317 km on average to 197 km on average), while the weekly distance traveled by walking/cycling increased (from 12.2 km a week on average to 17.3 km on average). The weekly distance traveled by bus changed very little (from 3.4 km on average to 2.5 km on average). These results show the promise of using QT to promote sustainable mode shifts. However, these behavioral changes may not be sustained long-term as users’ travel needs may not be met considering that the total weekly distance traveled by them dropped substantially on average (from 332.6 to 216.8 km). Furthermore, the results observed may not be applicable to the general population considering that the participants of Jariyasunant et al. (2015) are undergraduate students who present a small portion of the general population with unique sociodemographic and behavioral characteristics.
Meloni et al. (2014) proposed an Individual Persuasive Eco-Travel Technology (IPET) platform for promoting sustainable travel mode usage (bus, walking, and cycling) that provides economic, health, and environmental feedback (indirect tangible benefits). It has gamification components in the form of points and a leaderboard system and offers virtual badges to its users based on the challenges they completed. It also provides persuasive messages that combine text and images in different forms to discourage driving alone and encourage using sustainable travel modes. IPET also has social components that allow users to share their points and badges online and compare them with other users. Meloni and Teulada (2015) reported the initial results of a pilot test experiment using IPET of 15 people and suggested that participants had a very positive view of the app. Piras et al. (2018) presented a two-phase pilot test of IPET: the first phase focused on improving the app design and the second phase focused on evaluating the effectiveness of the app for promoting sustainable travel behavior. 28 graduate students (mostly male) from Cagliari, Italy, were selected for the second phase pilot test and 6 of them who traveled mainly by car were selected to evaluate if IPET can promote sustainable travel mode usage. In addition to the functions provided in IPET, Piras et al. (2018) also provided a gift card to incentivize participants to score the highest points. Two out of six participants changed their travel behavior and used the suggested sustainable travel modes, one of them only tried it once but did not continue, and the rest three did not change their behavior at all. Overall, their results showed that automobile travel and emissions were reduced by 47.7% and 35.4%, respectively, and the calories burned increased by over 200% after using IPET.
Bordin et al. (2014) and Kazhamiakin et al. (2015) presented a series of apps such as ViaggiaTrento & Viaggia Rovereto Play & Go (Trento and Rovereto are two neighboring cities in Italy) that were designed to promote sustainable travel behavior. These apps provide users with multimodal travel information and offer economic, health, and environmental feedback (indirect tangible benefits). They have gamification components that provide points if users traveled with sustainable travel modes and award virtual badges to their users if they completed some pre-defined quests (e.g., traveling by bicycle for the first time). They have social components that allow users to share and compare the points they collected. Kazhamiakin et al. (2015) conducted a three-phase experiment using 40 Viaggia Rovereto Play & Go users to study its impacts on promoting sustainable travel mode usage. In Phase I (1 week), participants’ travel behavior baseline was established. In Phase II (2 weeks), participants were provided with various types of information-based feedbacks. In the final phase III (2 weeks), the gamification and social components were introduced and users with the top three highest points at the end of the experiment were provided with rewards (a 1-month free pass to a bike-sharing program). The experiment results show that the information and feedback (Phase II) and social and gamification components (Phase III) contributed to the effectiveness of reducing the percentage of kilometers traveled by car (from 49, to 34%, to 21%) and promoting walking (from 5%, to 8%, to 12%), and cycling and cycling sharing (from 3%, to 9%, to 13%).
Di Dio et al. (2015) proposed an app, named “TrafficO2”, to promote using sustainable travel modes by providing economic, health, and environmental feedback to its users (indirect tangible benefits). Its gamification components allow users to earn points by using sustainable travel modes and offer achievable quests and challenges to its users. Users can also get direct tangible benefits from the app by redeeming their points for benefits provided by local business sponsors. Di Dio et al. (2015) presented the results of two field tests conducted in 2014 using student participants from the University of Palermo in Italy (77 and 245 people, respectively). Both field tests suggested that participants’ travel-related CO2 emission was reduced after using the app (about 30% reduction). This effort was later expanded to include over 2000 students at the University of Palermo and managed to reduce the carbon emissions associated with active users by more than 40%. Based on the successful experience of TrafficO2, Mobility Urban Values (MUV) app was created based on the concept of TrafficO2 in 2017 to promote more sustainable and healthy travel modes in six different European cities (Di Dio et al. 2019). Apart from the functions that were adopted from TrafficO2, MUV also incorporate more gamification components such as virtual badges and avatar, training (e.g., providing tasks and materials to improve user understanding of the app), and collaboration among users (e.g., some users reduce their CO2 emissions together). The project ended on May 30th, 2020, and studies related to this project are expected to be available soon. Dastjerdi et al. (2019a, b) proposed a multimodal travel planner app (RMTP) to promote sustainable travel behavior by providing economic, health, and environmental feedback (indirect tangible benefits). It has gamification components that provide actionable challenges to its users for using more sustainable travel modes. Users can collect bonus points if they use more sustainable travel modes and these points can be redeemed through the app’s loyalty program to get free services or public transport tickets (direct tangible benefits). It also has social components that allow users to share information (e.g., calories burnt) on social media. Dastjerdi et al. (2019a, b) suggested that RMTP is still under development and more gamification and social components can be added in the future.
Tripzoom, SUPERHUB, and Tripod are one of several early apps that introduced system-level management in the app. Tripzoom collects mobility data and travel patterns from individual users and provides economic, health, and environmental feedback to them. It also motives its users to change their mode choice behavior by offering dynamic direct tangible incentives based on each choice’s contribution to improving the system performance. Such mechanisms benefit the system performance as well as match individual users’ interests and preferences (Broll et al. 2012). It has gamification components such as points and leaderboard systems and virtual budges based on users’ travel behavior. In addition, Tripzoom also allows users to connect to various social networking services for social sharing, social comparison, and social competition. They proposed to evaluate its potential within living labs in multiple European countries. SUPERHUB represents a large-scale effort in Europe to provide multi-model travel planning for users to promote more sustainable travel behavior (Carreras et al. 2012; Wells et al. 2013). It can provide economic, health, and environmental information to its users for different mode choice options and provide information-based feedback after travel (indirect tangible benefits). It also includes gamification components in the form of Points Accumulation Gamification Model that allows users to collect points for doing behaviors (e.g., using sustainable travel modes) that the system deems to be positive, “level-up” based on the points collected, receive badges, and complete quests and challenges that are designed based on users’ current progress and system-level needs. SUPERHUB also has social components that allow users to share their achievements and compare them to other users. As part of the SUPERHUB project, Jylhä et al. (2013) proposed an app named MatkaHupi for promoting sustainable travel behavior by providing travel-related CO2 emission information (environmental feedback) and provide actionable challenges to its users for reducing CO2 emission by switching from driving alone to sustainable travel modes. Their pilot study results suggest that participants tend to accept and complete these challenges and perceived the actionable challenges positively. They also concluded that actionable challenges should be more personalized based on the participants’ feedback. Tripod is a conceptual smartphone-based system that is designed to minimize system-level energy consumption (Azevedo et al. 2018). It provides users with economic feedback to different route, mode, and departure time options and the amount of direct tangible benefits. Direct tangible benefits are provided in the form of redeemable tokens and their amount is based on how much each option contributions to the system-wide energy saving. The authors are not able to find field test reports for these apps, but all of these studies mentioned future field tests.
Apart from these aforementioned apps that promote sustainable mode shift, some apps are designed to promote users to make more informed route choice and departure time choice decisions (i.e., designed for driving only), improve physical activity levels, and more informed residential location choice decisions (Hu et al. 2015; Guo et al. 2017; Nakashima et al. 2017; Roider et al. 2019; Guo and Peeta 2020). Hu et al. (2015) designed a system called Metropia, which can predict future traffic conditions and offers economic feedback (e.g., travel time) related to multiple departure times and route choices (indirect tangible benefits). Each of these choices was rewarded with different direct tangible benefits based on their impacts on improving system-level performance. Hu et al. (2015) conducted a 10-week pilot field test among 308 participants in Los Angeles, California, and their results showed that participants changed both departure time and route choice for 35% of the trips with a travel time saving ranging between 10 and 40%. Guo et al. (2017) and Guo and Peeta (2020) proposed an Interactive Accessibility Map (IAM) to assist relocators to identify potential residential locations that can best fit their travel needs. Their results showed that participants in the experimental group who had access to IAM found residences that can better address their travel needs with better accessibility to different trip purposes using different modes of transportation compared to those in the control group who did not have access to IAM. Overall, the experimental group participants’ weekly driving time is about 10% less, and walk and transit mode share is 10% and 5% more compared to those in the control group. Nakashima et al. (2017) designed a mobility management app (MM) for promoting physical activities by providing health and environmental feedback to its users. It has gamification components that reward users with points and badges and offers them achievable quests and challenges to complete. MM also has social components that offer each user a familiar opponent they can compete with and check their opponents’ points in real-time. Nakashima et al. (2017) found that people who used the MM with gamification and social components were more engaged in the app, exercised more, became more aware of the negative environmental impacts associated with traveling by car, and became more willing to change their travel behavior compared to those who were using the MM with these components disabled. Roider et al. (2019) proposed a porotype app (denoted as “Roider et al. (2019)” in Table 1) to promote active travel modes among children and adolescents. It encourages users to reach specific locations on a map to collect points and they can receive more points if they are using sustainable travel modes. These points can be redeemed for tangible benefits (e.g., shopping vouchers). A field test of the proposed app was conducted among 57 students aged 12–18 in the province of Lower Austria. They found most of the students became more aware of the travel-related impacts and walking and cycling more often as using these modes can help them collect more points based on the self-reported data. At the same time, they also found that many students chose to drive to these locations to collect points (the legal age to drive in Austria is 17) and travel more frequently so that they can collect more points.
Apart from the aforementioned studies that focused on proposing and developing apps for promoting behavioral changes, Vasserman et al. (2015), Khoo and Asitha (2016), Jin et al. (2018), and Tang et al. (2019) studied the impacts of several popular travel information maps (Google Maps, Apple Maps, and Waze) and ridesharing apps (Lyft, Uber and DIDI Chuxing). Vasserman et al. (2015) and Khoo and Asitha (2016) concluded that these travel information maps can assist their users to make more informed travel decisions. Jin et al. (2018) and Tang et al. (2019) suggested that these ridesharing services can potentially help to reduce private vehicle ownership and vehicle miles traveled. Most of these commercial apps have well-designed information-based feedback, gamification, and social components, and have great impacts on users’ travel behavior. However, their impacts on fostering sustainable mode shifts can be limited as they are designed for commercial usage instead of designing for behavioral intervention strategies.
The insights from the aforementioned studies illustrate that these apps can influence within-day and day-to-day route choice decisions and/or reduce automobile usage (e.g., travel distance and time) during the initial implementation period, such as 1 month. However, they also show that these apps have limited ability to influence long-term travel decisions, such as inducing mode shifts from driving alone to alternative modes, for four key reasons. Firstly, these apps provide personalized travel-related information in terms of route and mode suggestions when users input the origin and destination, and information-based feedback based on their subsequent travel decisions. However, most of these apps are designed from an individual user perspective. They do not allow the system operator to leverage past travel decisions of users to provide them real-time personalized incentives to dynamically influence their short- and long-term travel decisions to achieve system-level goals that can potentially benefit both users and non-users. Secondly, most of these apps have information sharing, social comparison, and social competition within the community (e.g., competing points scored within the community), but lack social components that provide opportunities for social interactions, cooperation, and support among users, which can induce users to make long-term sustainable mode shifts (Abou-Zeid and Ben-Akiva 2011; Hamari and Koivisto 2013). In the literature (Lehto and Oinas-Kukkonen 2010; Ploderer et al. 2014), some health-related apps have already integrated such social components, and shown promising results (e.g., improving app effectiveness in promoting physical activity level increase). Thirdly, it is important to note that most of the aforementioned studies only provided results of pilot field experiments with limited sample sizes and relatively short experiment length. In addition, most of the field experiments are not controlled experiments (with both control and experimental groups) and most studies have not followed with its users in terms of their app usage and travel behavior after study completion. It may be true that some of the experiments of these apps may be still ongoing considering that most of these apps are relatively new and some experiments may be limited because of budget constraints. For example, a large study has recently completed its three-year field test (from 2017 to 2020) of MUV in six cities across Europe and the results of this study can be expected in the future. Large-scale, longitudinal, and controlled studies of these apps can potentially provide a better understanding of the impacts of these apps on promoting long-term behavioral changes. Lastly, it is also important to note that many app developers understand the importance of providing direct tangible benefits to its users for promoting behavioral change and some of them have incorporated this concept in their apps (e.g., MUV and RMTP). Some studies (e.g., Kazhamiakin et al. 2015) proposed apps that did not offer direct tangible benefits but they did provide monetary rewards in their pilot field experiments to boost participation and promote travel behavior changes (e.g., the user who scored the highest points at the end of the experiment was rewarded a 1-month free pass to a bike-sharing program). However, none of the aforementioned studies have conducted controlled experiments that can quantify the benefits of providing direct tangible benefits to app users by comparing the effectiveness of the apps with and without direct tangible benefits in promoting behavioral change.
Pokémon GO
Pokémon GO, a location-based augmented reality (AR) gaming app developed by Niantic, Inc, became the most popular mobile gaming app in the U.S. history in terms of its massive daily active users (28.5 million daily unique visitors at its peak in early July 2016 in the U.S.) after its release on July 6, 2016, in the U.S. (Allan 2016; Frommer 2017). As of September 2019, Pokémon GO is ranked as the second most popular mobile gaming apps in the U.S. with 10.66 million monthly users in the U.S. with Google Play Games ranked number one (Statista 2020). One of the important metrics that is used to evaluate the app performance is the 3-day app retention rate which measures the percentage of users who still use the app 3 days after the initial download (Liu et al. 2014; Mehra et al. 2020). According to Mobile App Daily (2019), the 3-day retention rate for Pokémon GO is around 60% compared to the app industry average 15% in 2018. Although the app was created for gaming, it can potentially have profound impacts on the travel behavior of millions of users around the globe, partly due to its four features, namely information-based feedback, location-based AR, gamification, and social components.
Pokémon GO is a free-to-play game that also supports in-app purchases for in-app items. All the features of Pokémon GO discussed in this subsection are based on the features available by the end of 2016. Figure 1a illustrates Pokémon GO’s user interface with the game map that is designed based on the OpenStreetMap data (Juhász et al. 2020) (see Fig. 1b). Pokémon GO uses the smartphone’s GPS to display the user’s in-game avatar on the game map at their real-time location. The users can interact with incentivizing fixed- and dynamic-location virtual objects that are overlaid on the game map using AR. Interactions with virtual objects require users to be within their 40 m interaction radius and can provide users with various types of benefits. For safety reasons, Pokémon GO uses a speed-based safety mechanism that disables most interactions if users are moving faster than approximately 20 km per hour based on the authors’ personal experiences.

Pokémon GO user map interface (a) and corresponding OpenStreetMap display (b)
Pokémon GO has virtual creatures (intangible benefits), Pokémon that users can obtain and use to interact with other such creatures in the app (Fig. 1a). There are three ways of obtaining a Pokémon: (1) catch it during a wild encounter, (2) hatch it from a Pokémon Egg, and (3) evolve a Pokémon caught through a wild encounters or hatched from a Pokémon Egg, if possible. For wild encounters, the app dynamically generates Pokémon on the game map that users can see and interact with if they are within its interaction radius. The density of these Pokémon generally depends on the real-world significance of that location, with higher density in more popular real-world locations (e.g., historical monuments). The app also features a nearby Pokémon locator that displays approximate locations of Pokémon within a certain distance (around one kilometer) from the user. Users have a chance to catch a Pokémon during the wild encounter by tossing an in-app virtual item PokéBall at the Pokémon (Fig. 2a). They can also use another in-app item Berry to improve their catch probability. PokéBalls and Berries (direct tangible benefits) can be collected through PokéStops and Pokémon Gyms (Fig. 2b), both of which are fixed-location virtual objects displayed on the game map using AR (information-based feedback). Some PokéStops and Pokémon Gyms are not reachable by car or transit but are easily accessible by walking or cycling (promoting physical activities). PokéStops and Pokémon Gyms can also provide users with Pokémon Eggs that hatch Pokémon when users walk a pre-defined distance while using an in-app item Incubator with the app turned on. A maximum of nine Pokémon Eggs can be incubated simultaneously. Once a Pokémon is caught during a wild encounter or hatched after incubation, it will provide the user with Stardust and Candies that can be used to evolve certain Pokémon. Once a Pokémon is obtained using the aforementioned methods, it will come under the ownership of the user. Each unique Pokémon type obtained by the user is logged into the user’s Pokédex, a comprehensive in-app Pokémon logbook. One major goal of the game is to log all the unique Pokémon entries in the Pokédex (Oleksinski 2016).

Pokémon GO wild encounter (a), item collection (b), and virtual badges (c)
Pokémon GO also has social components that can potentially promote social collaboration and social competition. There are three teams in Pokémon GO and users can choose to join one of them. They cannot switch to another team. Users can collaborate with other users from the same team and compete with users from rival teams for the control of the Pokémon Gyms using Pokémon (i.e., Pokémon Gym Battles). Users can capture a Pokémon Gym after winning a Pokémon Gym Battle and assign one Pokémon to control it. Each user can only assign one Pokémon per Pokémon Gym and up to ten users from the same team can control a Pokémon Gym at the same time. Controlling the Pokémon Gym can provide users with in-app currency over time (direct tangible benefits). Participating in a Pokémon Gym Battle takes a relatively longer time (a few minutes) compared to interacting with a PokéStop (a few seconds). Users can speed up the process of Pokémon Gym Battles by collaborating with users of the same team. Users often use social networking platforms (e.g., Discord) to coordinate Pokémon Gym Battles. Users do not need to share any personal information with others to participate in Pokémon Gym Battles as in-game interactions and social platform coordination can be done anonymously using their usernames. Nevertheless, users can still progress in the game without participating in Pokémon Gym Battles. Pokémon GO records all of the aforementioned app-related activities (e.g., types of unique Pokémon caught) and awards its users with virtual badges (Fig. 2c) when they reach certain milestones (intangible benefits).
Pokémon GO can potentially influence users’ travel behavior. It leverages AR to display incentivizing fixed-location (PokéStops and Pokémon Gyms) and dynamic-location (Pokémon) virtual objects for in-app items (direct tangible benefits) to encourage users to travel to these locations (economic feedback). This can potentially promote users to change their route (e.g., choosing the route with more virtual objects), increase their travel demands (e.g., travel more frequently and to different locations to gain in-app items), encourage users to collaborate on their travel plans (e.g., carpool for Pokémon Gym Battles), and increase walking and cycling distance (e.g., hatch Pokémon Eggs and access PokéStops and Gyms that are not easily accessible by car or transit). In addition, social competition component leverages people’s natural desires for mastery, achievement, status, and competition in games (Hamari et al. 2014) to provide users with intangible benefits such as a sense of involvement, satisfaction, and achievement. Social components (collaboration and competition) along with the integration of gamification provide intangible benefits to users that can increase the app’s attractiveness and sustain long-term user engagement by reducing the dropout rate (O'Brien and Toms 2008; Gerlich et al. 2015).
Despite the potential impacts of Pokémon GO on influencing travel behavior, most existing studies focus on understanding its safety and health impacts. Distracted driving, cycling, and walking, trespassing, entering areas where users do not feel safe, and sacrificing sleep have been identified as Pokémon GO’s key safety and health hazards, particularly among male or younger generation users (Ayers et al. 2016; Barbieri et al. 2017; Dorward et al. 2017). In terms of Pokémon GO-related health impacts, most studies concluded that Pokémon GO can promote physical health among its users by encouraging walking and discouraging sedentary behavior (Althoff et al. 2016; Barkley et al. 2017; Xian et al. 2017; Wagner-Greene et al. 2017; Wong 2017; Guo et al. 2020a), have the potential to improve mental health particularly among people with dogs or social anxiety (Tateno et al. 2016; Kato et al. 2017; Kogan et al. 2017), and improve the cognitive performance and emotional intelligence in adolescent youth (Ruiz-Ariza et al. 2018). A few studies also investigated the factors that impact how long and how frequently Pokémon GO users use the app (Kaczmarek et al. 2017; Rasche et al. 2017; Rauschnabel et al. 2017).
It is important to note that Pokémon GO is a commercial gaming for-profit app compared to most of the existing travel-oriented apps described in “Mobile apps for behavioral intervention strategies” section. While the app mechanisms encourage users to walk more, it is not designed to promote a mode shift from driving to more sustainable modes. Some of its mechanisms can be bypassed with in-app purchases (e.g., users can buy in-app items instead of collecting them from PokéStops and Pokémon Gyms). In addition, it does not provide route and mode options and directions to its users to reach various virtual objects at different locations. Some of the app mechanisms also increase travel demand (e.g., travel to different locations to catch Pokémon). Furthermore, it is important to emphasize the potential safety risk related to using Pokémon GO while driving, cycling, and walking compared to using other travel-oriented apps. Most of the travel-oriented apps do not require their users to continuously and actively interact with the app while traveling. Similar to engaging in phone-related activities (e.g., making phone calls and texting), using Pokémon GO to locate and interact with virtual objects can increase users’ safety risk exposure due to app-related distracted driving, cycling, and walking (Ayers et al. 2016; Serino et al. 2016; Sawano et al. 2017; Chen et al. 2018; Faccio and McConnell 2020; Guo et al. 2020a). There are also limitations to these speed-based safety mechanisms used by Pokémon GO. Many Pokémon GO users may choose to intentionally drive slower so that they can bypass the safety mechanisms and use the app while driving.
Objectives
This study aims to understand the impacts of Pokémon GO on travel behavior by answering the following research questions. First, how frequently users make route changes for work/school and non-work/school trips based on fixed-location virtual objects (i.e., PokéStops and Pokémon Gyms) to accrue in-app items for direct tangible benefits and collectible achievements (e.g., virtual badges for visiting a certain number of PokéStops), and how frequently users make route changes for dynamic-location virtual objects with in-app benefits (i.e., Pokémon)? Addressing these questions can help to explain why users change their route based on fixed-location and dynamic-location virtual objects, and explore the potential of introducing virtual objects with incentives through AR-technologies to change users’ route choice decisions in real-time. Second, how likely is it for the users to carpool more instead of driving alone for increased social interactions and collaboration (i.e., additional in-app collaboration)? This can illustrate the potential of using the social components for interactions and collaboration in Pokémon GO or designing similar apps to promote mode shift from drive alone to carpool. Third, how likely are users to shift from drive alone to sustainable travel modes if provided with additional in-app benefits? Answering this question can shed some light on the potential for system operators and policymakers to leverage Pokémon GO or designing similar apps with integrated AR, gamification, and social component to provide additional incentives for promoting mode shift from drive alone to more sustainable travel modes.
The remainder of the paper is organized as follows. In “Survey design, implementation, and descriptive sociodemographic statistics” section describes the survey design, implementation, participants’ characteristics, and the impacts of Pokémon GO on users’ route and mode choice decisions. In “Methodology section presents econometric models to understand the impacts of users’ sociodemographic and behavioral characteristics, familiarity with and involvement in the app, and app usage behavior on travel behavior of interest. Model estimation results are presented in “Model estimation results” section. In “Concluding comments” section provides some conclusions, summarizes key policy implications, and identifies future research directions along with some suggestions for future apps for influencing travel behavior.
Survey design, implementation, and descriptive sociodemographic statistics
This study draws on an anonymous online questionnaire-based survey the authors conducted in the U.S. between September 7, 2016 and December 12, 2016. This study was approved by Purdue University’s Institutional Review Board. The survey flow is shown in Fig. 3.
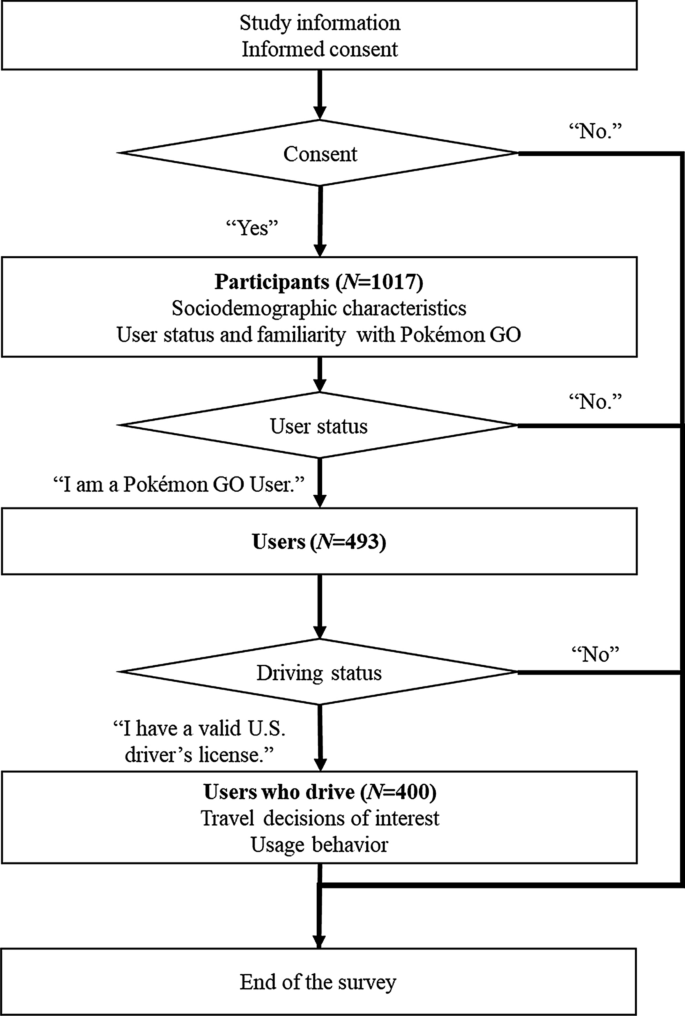
Survey flow
At the beginning of the survey, an informed consent was presented to the potential participants. In the consent form, we explained the study purpose and expected the participants to self-report how they use Pokémon GO. To capture how people use Pokémon GO in the real-world, to the best of the authors’ ability all questions were worded in a neutral way without suggesting how users should or should not use Pokémon GO. The risk of participating in the survey is considered as no risk that is greater than everyday activities in this study. The risk of breach of confidentiality is minimal as the study is anonymous.
Once the participants gave consent, they were asked questions related to their sociodemographic and behavioral characteristics. If they are both users and have a valid U.S. driver’s license, additional questions were asked related to their Pokémon GO usage behavior. After the completion of the survey, all participants received a Thank You Email in which the authors highlighted potential risks associated with using Pokémon GO while driving, cycling, and walking, and were asked participants to provide suggestions and share their personal Pokémon GO related stories.
Participants were recruited based on the criteria that they are at least 18 years old and live in the U.S. at the time of completing the survey. Flyers with an online questionnaire link were placed in several businesses and educational institutions in Indiana, Kentucky, Tennessee and California, and posted on social networking services (e.g., Facebook) and online forums (e.g., Reddit). In addition, participants were also recruited by contacting employers and educational institutions in the U.S. to distribute recruitment emails. Cash incentives were offered to increase response rate. Two winners among participants who completed the survey were selected using random draws and each received 50 dollars. Participation in the survey is voluntary, and participants can end the survey at any time. The recruitment and data collection protocol were approved by Institutional Review Board at Purdue University. The data collection and preliminary analysis were completed at the beginning of 2017; all participants received a preliminary study report containing some of the descriptive statistics and some discussions related to the results. Additional discussions related to Pokémon GO and user safety were also included in the report (e.g., users in California should not use the app while driving since it is illegal).
1036 participants completed the survey, and 19 of them were excluded because of mismatching self-reported residence location and IP-based geolocation collected by the survey. Among the remaining 1017 participants, 493 participants were still using Pokémon GO (i.e., Pokémon GO users) and 524 participants were not, based on their self-reported information. Participants were from 41 different states in the U.S., with the top three in terms of number of participants being from Indiana (N = 114), California (N = 65), and Texas (N = 32). Table 2 presents the participants’ sociodemographic characteristics. Chi-square two-sample tests were used to evaluate if there are statistically significant differences between the user and non-user groups. If p < 0.05, it suggests that the distribution of the outcome is different between two groups. Two key observations can be made from Table 2. On one hand, most participants are either single, Millennials (between 20 and 35 of age at the time of the survey), highly educated (college degree or above), or work as full-time employee, and nearly half of them are Pokémon GO users. This is likely because of the voluntary nature of the survey and online survey distribution methods, and our participants represent subpopulations who have better access to the Internet, have higher interest in apps, are more likely to play Pokémon GO, and/or are more likely to know someone who plays Pokémon GO, making them more likely to access and complete the survey. On the other hand, user and non-user groups are very different in most sociodemographic characteristics based on Chi-square test, except for age, marital status, hours of exercise per week, and residential location’s levels of urbanization. It is important to note that survey participants are not representative of the general population. Thus, the descriptive sociodemographic characteristics of the study participants may not reflect the population differences between Pokémon GO users and non-users.
Pokémon GO users were asked two questions: “Have you changed your most common mode of transportation to work or school because of playing Pokémon GO?” and “Have you changed your most common mode of transportation to places other than work or school because of playing Pokémon GO?”. Table 3 summarizes the travel mode shift of users who had changed their most common mode of transportation for work and non-work trips. 50 of 493 (10.1%) have changed their most commonly used mode for work trips and 92 of them (18.7%) have changed their most commonly used mode for non-work trips because of Pokémon GO. The most common mode change in terms of the number of users is from driving alone to walking for both work and non-work trips. It is important to note that the term “carpooling” in Table 3 includes traveling with family members and friends (as a driver or as a passenger) and ridesharing. These users were also asked multi-select questions related to the reasons behind their mode shift. “To hatch eggs faster” (80.0% for work trips and 81.6% for nonwork trips, respectively) and “to catch more Pokémon” (76% and 81.6%, respectively) are the top two reasons behind their mode shift.
It is important to note that only a small portion of the users changed their most common mode of transportation for work and non-work trips from driving alone to other modes of transportation. 20 out of 417 participants (4.8%) and 53 out of 405 participants (13.1%) changed their most common mode of transportation from driving alone to other alternatives for work and non-work trips, respectively. This is well below the mode shift observed in studies such as Jariyasunant et al. (2015) in the U.S. in which miles traveled by car dropped around 40% and Kazhamiakin et al. (2015) in Italy in which car mode share reduced from 49 to 21% was observed around the time of this study.
Among the 493 Pokémon GO users, 400 of them has a valid US driver’s license and use driving alone mode as their most common mode of transportation to work or school. These users (N = 400) were asked additional questions related to the travel decisions of interest to understand the impacts of Pokémon GO on its users’ driving route choice and promoting mode shift. Table 4 presents aggregated statistics of six travel decisions of interest that are reported on a 5-point Likert scale.
It is important to note that mode shift questions in Table 4 (i.e., BUS and NON-MOTORIZED) are stated preference questions related to their likelihood of riding a bus more and using non-motorized modes (walking and biking) more if Pokémon GO offers additional benefits (e.g., hatching eggs faster and encounter more Pokémon) for using these modes compared to driving alone, and their likelihood of carpooling more if Pokémon GO offers more in-app collaboration. These results do not imply that people would change their most common mode of transportation for work and non-work trips and may only reflect people’s willingness to use some modes more for some trips. The actual mode shift percentage depends on various factors, such as the amount and the types of additional benefits associated with alternative modes of transportation, the availability of the alternative modes, and the feasibility of making mode shifts. Additional studies are needed to quantify the impacts of additional benefits provided by Pokémon GO on promoting travel mode shifts.
Methodology
To understand the impacts of various contributing factors (including sociodemographic and behavioral characteristics, familiarity and involvement with Pokémon GO, and app usage behavior) on six travel decisions of interest, and to capture heterogeneity among users, six random parameters ordered probit models (Mannering et al. 2016) are used to analyze self-reported travel decisions of users who have a valid U.S. driver’s license and use driving alone as their most common mode of transportation for work trips (drivers) (N = 400) (Table 3). It is important to note that both ordered probit and ordered logit models can be used to analyze an ordinal dependent variable. The key difference between these models is that ordered probit models assume the random error term in in Eq. 1 to be normally distributed across observations while ordered logit models assume it to be logistically distributed. Washington et al. (2010) suggested that the ordered probit is usually chosen over the ordered logit because of the underlying assumption of normality of the error term in many studies. Long and Freese (2014) and Williams (2016) argued that the proportional odds assumption (i.e., the effects of any explanatory variables are consistent or proportional across the different thresholds) in ordered logit models is frequently violated based on empirical evidence, while ordered probit models do not need to meet this assumption. Several studies also suggested that both models produced very similar results (Quddus et al. 2002; Abdel-Aty 2003; Jalayer et al. 2018). In this study, ordered probit models are used.
The generalized ordered probit models can be formulated as follows (Washington et al. 2010):
where \(y_{n}^{*}\) is a latent variable determining the discrete ordered outcomes for each observation, n (n = 1,…, N, where N = 400 is the total number of observations included in the model), \(X_{n}\) is the vector of independent variables considered affecting the dependent variable, \(\beta\) is the vector of estimable coefficients, and \(\varepsilon_{n}\) is a random error term assumed to follow a standard normal distribution.
The value of the dependent variable for observation is defined as,
where \(\mu\) are estimable parameters or thresholds that define \(y_{n}\) as integer ordering converted from ordered responses, and I is the highest integer ordered response. For example, in this study, the responses to “how frequently do you change route for work trips to interact with PokéStops and Gyms (i.e., fixed-location virtual objects)” were converted to integers (e.g., never = 1, rarely = 2, sometimes = 3, and almost always or most of the time = 4).
\(\mu\) and \(\beta\) were estimated jointly by determining the probability of I specific ordered responses for each observation n. Hence, the ordered probit model results can be presented in the form of ordered selection probabilities as follows,
where \({\Phi }\left( \cdot \right)\) is the cumulative normal distribution function.
Previous studies in the transportation domain (e.g., Christoforou et al. 2010; Zhang et al. 2014; Guo and Peeta 2015; Guo et al. 2016a, b) have utilized random parameters models to capture the unobserved heterogeneity present in the data. Fixing the parameters to be constant when they vary across observations can lead to inconsistent, inefficient, and biased parameter estimates (Washington et al. 2010). By adding an error term that correlates with the unobserved factors in \(\varepsilon\), individual heterogeneity can be translated into parameter heterogeneity as follows (Greene 2000):
where \(\varphi_{n}\) is a randomly distributed term. 300 Halton draws are used in simulated maximum likelihood estimation for random parameters ordered probit models (Washington et al. 2010).
In addition to the random parameters ordered probit models, two other types of econometric modeling approaches were considered, including those that can capture potential correlations among dependent variables and the others that are designed for a single dependent variable. Modeling approaches belonging to the former type include bivariate ordered probit (Yamamoto and Shankar 2004), multivariate ordered probit (Hasegawa 2010), random parameters bivariate ordered probit (Anastasopoulos et al. 2012; Russo et al. 2017) models, and modeling approaches belonging to the latter type include random parameters ordered probit with random thresholds (Fountas and Anastasopoulos 2017), and correlated random parameters ordered probit (Fountas et al. 2018) models. Some recently developed methods such as mixed generalized ordered models (Bhowmik et al. 2019), latent class ordered probit (Fountas et al. 2018), and zero-inflated ordered probit models (Fountas and Anastasopoulos 2018) were not considered but are worth exploring in future studies.
To assess the statistical performance of two competing modeling approaches or models, likelihood ratio tests were conducted (Washington et al. 2010):
where \(LL\left( {\beta_{lc1} } \right)\) and \(LL\left( {\beta_{lc2} } \right)\) are the log-likelihood functions at convergence of two models. The statistical test follows a chi-squared distribution, and is defined by degrees of freedom equal to the difference in the number of estimable parameters between the competing models.
Three types of goodness-of-fit measures are also computed, including the McFadden pseudo-R2, the Akaike Information Criterion (AIC), and the corrected Akaike Information Criterion (AICc). Models with higher values of McFadden pseudo-R2, and lower values of AIC and AICc are considered to have better statistical fit (McFadden 1981; McFadden and Train 2000). Several distributions for random parameters were explored, including normal, uniform, triangular, Weibull, and lognormal. The normal distribution was found to provide the best statistical fit, which is consistent with several previous studies (Anastasopoulos 2016; Guo et al. 2018). Random parameters ordered probit models are used and presented in “Concluding comments” section based on likelihood ratio tests and good-of-fit measures. Other modeling methods are not used as they are unable to converge or have relatively low goodness-of-fit compared to the final random parameters ordered probit models.
Model estimation results
Table 5 presents descriptive statistics of independent variables that were found to have statistically significant correlations with the dependent variables (\(z\) ≥ 1.96 or statistically significant at 0.95 level of confidence) in the final models. Apart from the variables included in Table 5, other potential independent variables were also considered which are presented in “Appendix”. The selection (or exclusion) of independent variables was mainly based on three tests, including Kendall’s Tau test, variance inflation factor (VIF) analysis, and the variable coefficient’s z-statistics in the model estimation. Kendall’s Tau test is used to measure the strength and direction of the association between two variables measured on at least an ordinal scale (Akoglu 2018). If the absolute value of the correlation coefficient (\(\tau_{b}\)) between two variables using Kendall’s Tau test is larger than 0.3, it suggests that these two variables have a moderate or strong correlation between these variables which violate the order probit model assumption that independent variables should be independent. Table 6 presents Kendall’s Tau test of the independent variables used in the study. VIF is used to measure and quantify how much the variance of independent variables are inflated due to multicollinearity in the model. If a variable’s VIF is larger than 2.5, it suggests that there is a strong possibility of multicollinearity in the models because of the variable (Daoud 2017). If an independent variable’s absolute value of z-statistics in the model estimation is smaller than 1.96 (or p > 0.05), it suggests that this variable does not have a statistically significant correlation with the dependent variable. In this study, all independent variables included satisfy the requirements of all three tests (i.e., \(\tau_{b} \le 0.3\), VIF ≤ 2.5, and p < 0.05). Tables 7, 8, 9, 10, 11 and 12 present the final six models using random parameters ordered probit models based on statistical performance comparison and goodness-of-fit measures. Both the z-statistics and marginal effects are also presented.
The model estimation results in Tables 7, 8, 9, 10, 11 and 12 illustrates that certain subpopulations of Pokémon GO users are more likely to change their route choice decisions based on fixed- and dynamic-location virtual objects, willing to use the bus and non-motorized modes more if provided with additional benefits, and willing to use carpool more if provided with additional social components. These subpopulations can be identified through four types of variables, including attitude and perceptions related to Pokémon GO, app engagement, play style, and sociodemographic characteristics. Four types of attitude and perceptions related to Pokémon GO were considered, including perceived app familiarity, perceived app safety (i.e., perceived safety of using Pokémon GO while driving and walking and opinion of restricting Pokémon GO usage while driving), perceived impacts on driving distance, and perceived health benefits (i.e., whether Pokémon GO makes them walk more and healthier). Two app engagement factors include the money spent on the app and their willingness to use the app for the long term. Three play style factors are co-op users (i.e., the user “almost always” or “most of time” carpools to collaborate in Pokémon), driving-oriented users (i.e., the user drives around because of Pokémon GO “at least twice a week”), and walking-oriented users (i.e., the user “almost always” or “most of the time” uses Pokémon GO while walking). Five sociodemographic characteristics are gender, annual driving distance, driving distance to work, age, and marital status.
Attitude and perceptions
The model results show that users who perceived they were “extremely familiar” with the app are more likely to report higher frequency of route changes for work and non-work trips. Their extreme familiarity with the app in terms of app mechanics and locations of virtual objects allows them to frequently change routes based on fixed-location virtual objects for both work and non-work trips (e.g., amount of in-app benefits on each route), along with other route characteristics (e.g., travel time). In addition, such users are more likely to be willing to ride a bus if it provides additional in-app benefits. This illustrates that users with higher familiarity with the app may be more susceptible to its influence in making travel behavior changes. Niantic, the developer of Pokémon GO, and online and offline communities of Pokémon GO provide numerous supplementary materials for the app such as usage tutorials and official and nonofficial moderated online forums for app information sharing and discussions that allow Pokémon GO users to improve their familiarity with the app. Such materials and online forums are often lacking in some of the apps developed for influencing travel decisions in the literature (Table 1) which may limit the effectiveness of such apps.
Three variables related to perceived app safety were found to affect Pokémon GO’s impacts on users’ route and mode choice decisions. Users who consider that using Pokémon GO while driving is “definitely” or “probably” dangerous are less likely to frequently change route for work trips. The model results show that most users who consider that Pokémon GO while driving should “definitely” or “probably” not be forbidden are less likely to frequently change route for non-work trips, more likely to frequently change route based on dynamic-location virtual objects, more likely to carpool more instead of drive alone, and less likely to make mode shift from drive alone to non-motorized modes if provided with more incentives. These results show that most users who may want to have the option of using Pokémon GO while driving (as they do not want “driving and using the app” to be forbidden) are more likely to change driving-related Pokémon GO usage behavior. Since this variable is modeled as a random parameter, it also suggests that some of such users behave the opposite. This shows that some users may just want to have the option of using Pokémon GO while driving, but are less likely to change their behavior because of Pokémon GO. Users who consider that using Pokémon GO while walking is “definitely” or “probably” not dangerous are less likely to use carpool more instead of drive alone, and most of them are less likely to be willing to shift to riding a bus if it provides additional in-app benefits compared to driving alone. It is possible that such users may spend most of their time on Pokémon GO while walking, and they may not be willing to make driving behavior changes or mode choice decision changes.
Users who perceive that playing Pokémon GO “definitely” or “probably” increases weekly driving distance, are more likely to report a higher frequency of change in their routes for collecting dynamic-location incentives. They are also likely to carpool to mitigate increased driving. In addition, model estimation results illustrate heterogeneity in behavior among such users, in terms of their willingness to ride a bus or non-motorized modes if provided with additional in-app benefits. Most of such users are willing to shift to bus or non-motorized modes if provided with additional in-app benefits. It suggests that the current mechanisms used in Pokémon GO do not curb the potential induced driving demand caused by users who are hunting for incentives.
Users who consider that Pokémon GO has potential health benefits (using Pokémon GO “definitely” or “probably” makes them walk more or healthier) are likely to carpool more instead of drive alone, and are willing to shift from drive alone to bus or non-motorized modes if additional in-app benefits can be accrued. These results illustrate that although Pokémon GO does not directly provide health feedback, it may foster the belief of increased physical health among its users, making them more susceptible to the influence of the app in changing their route and mode choice decisions.
Engagement
Two variables related to current and potential future app engagement variables were found to affect Pokémon GO’s impacts on users’ route and mode choice decisions. Most users who spent “at least $10” in the app are more likely to frequently change their route choice because of fixed-location virtual objects and carpool more instead of drive alone, and are more willing to use non-motorized modes if provided additional in-app benefits to enhance their app usage experience. Also, they collect more in-app benefits as they may feel more invested or engaged with the app. As shown in YouGov (2016), over 70% of Pokémon GO users do not spend any money in the app, and only around 10% of them spend over $20. In Pokémon GO, users can access all the basic app functions but are required to pay real money for advanced functionality or virtual items. Such apps are classified as “freemium” app services (Liu et al. 2015). As shown in the literature, paying and nonpaying app users often behave differently in other apps, and paying app users often exhibit a stronger loyalty to the app (Hsu and Lin 2015; Hsiao and Chen 2016). These results illustrate the potential differences between paying and nonpaying Pokémon GO users. However, since this variable is modeled as a random parameter, it also suggests that some of these users may spend money to accelerate or bypass app mechanisms for improving their app experience rather than adjusting their travel decisions based on app mechanisms. This result is often observable in gaming apps where some users choose to improve their skill or spend time on the apps to make progress, while others choose to accomplish that by spending money (Hsiao and Chen 2016). This illustrates the limitations of gamification; that is, some gamification features may motivate certain users to spend money and can be profitable to developers, but their influence on travel decisions of such users may be limited.
Most users who reported higher willingness to engage with Pokémon GO for a relatively longer term (“extremely likely” to use for the next 3 months) are more likely to be influenced by the app to change their route and mode choice decisions (except for mode shift from drive alone to bus for more incentives). It suggests that retaining users by maintaining or increasing their engagement with Pokémon GO plays an important role in affecting the impacts of the app on travel decisions. This is achieved by improving game design through regular app updates to improve user experience (e.g., new Pokémon and PokéStop), and promoting social interactions among users to improve long-term user engagement (e.g., Pokémon exchange and new Gym battle mechanisms). In addition, as this variable has random parameters in most models, it also shows heterogeneities exist among these users as some of them may not be willing to change their behavior to enjoy the game.
Play style
In terms of users’ play style, three types of possible play styles that affect Pokémon GO’s impacts on users’ route and mode choice decisions have been identified, including co-op users, driving-oriented users, and walking-oriented users. Most co-op users (i.e., “almost always” or “most of time” carpools to collaborate in Pokémon GO) are more likely to frequently change their route choice decisions based on fixed-location virtual objects during both work and non-work trips. These users are likely those who: (1) enjoy the social interactions through the app, (2) seek other users’ help to play the game so that they can gather in-app benefits without compromising driving safety, (3) have a social group of Pokémon GO, or (4) seek to complete the achievements that cannot be accomplished as a solo user. It is possible that these users make route decisions as a collective group which can lead to frequent changes in route decisions.
Driving- oriented users represent those who drive around because of Pokémon GO “at least twice a week”. They are more likely to frequently change their route choice decisions based on fixed- and dynamic location virtual objects. Most walking-oriented users (i.e., “almost always” or “most of the time” play Pokémon GO while walking) are more willing to shift to bus and using non-motorized modes if additional in-app benefits can be accrued. These results suggest that user play style dictates how Pokémon GO and additional in-app benefits would affect their travel decisions.
Sociodemographic and behavioral characteristics
Most of the male users are more likely to be willing to shift to bus but less likely to be willing to shift to non-motorized modes if provided with additional in-app benefits compared to driving alone. On one hand, these results illustrate that, on average, males embrace new technologies more easily, hold more positive attitudes towards and are more attached to them, which make them more susceptible to the influence of these technologies (e.g. Lee et al. 2014). On the other hand, these results show the heterogeneities among male users in terms of their mode shift response toward in-app benefits. Additional studies are needed to address the reasons behind such heterogeneities.
Most users who drive 9000 miles or more a year [the national average miles traveled per year is 13,476 based on FHWA (2016)] are more likely to carpool more instead of drive alone. It is possible that these users already need to drive a lot every day and they want to share such burden with others to use the app. Most users whose driving distance to work is relatively short (i.e., 20 min or less) are more likely to report higher frequency of changing routes to work, possibly because the perceived travel time increase for changing routes for a shorter trip is relatively small. Model results also show that providing additional incentives can reinforce the benefits of riding a bus and using non-motorized modes for current bus riders and cyclists and motivates them to further reduce automobile usage.
Younger adults (under 26 years of age) are more likely to report a higher frequency of route changes for non-work trips or when responding to dynamic app features (i.e., Pokémon). Younger adults, who are millennials or post-millennials, are more interested in and comfortable with mobile apps compared to older generations (Hopkins and Stephenson 2014; Owens et al. 2015; Klein and Smart 2017; Hopkins 2016). In addition, as millennials and post-millennials start aging, they will likely continue to use apps to make travel decisions, thereby impacting the travel behavior of future older generations.
Users who are single are more likely to be willing to carpool more instead of driving alone for increasing social interactions (such as spending time and socializing with friends) if the app can provide additional in-app collaborations. They are more likely to use non-motorized modes if these modes provide additional in-app benefits compared to driving alone. This could be because users who are single are more independent and flexible in terms of making mode choice decisions. These users are also more likely to be willing to make mode shifts from drive alone to non-motorized modes if additional in-app benefits can be accrued.
Model results summary
Table 13 summarizes the potential app design takeaways based on the model estimation results. Policymakers and app developers can potentially use these insights to design apps that integrate augmented reality (AR), gamification, and social interactions to influence travel decisions. In terms of route choice decisions, this study shows that providing in-app benefits through fixed- and dynamic-location virtual objects can influence users’ work and non-work route choice decisions. Thereby, a system operator can leverage AR in developing low-cost, app-based solutions to manage traffic in real-time, especially during peak hours, by dynamically adjusting the location, content, or timing of virtual objects with possible direct tangible benefits in the traffic network. From a practical standpoint, these capabilities would be particularly attractive to transportation planning and operational agencies. Rather than relying solely on high-cost, labor-intensive physical infrastructure (for example, toll facilities or dedicated lanes), the emerging convergence of smartphone-based apps, AR-based technologies, and social platforms can provide opportunities for innovative, incentive-based solutions that are flexible, convenient, and low-cost, and that further factor users’ behaviors revealed through the app. Also, at the system level, proposing solutions that are more consistent with user behavior enhances their effectiveness in achieving network-wide goals such as enhanced traffic network performance, and reduced emissions and/or energy usage.
The use of Pokémon GO can also create emergent challenges such as redundant trips made by users to engage in the app-related activities (induced demand) and unsafe driving maneuvers (e.g., intentionally slowing down to interact with virtual objects). If policymakers and system operators want to consider collaborating with app developers to influence people’s travel behavior, it will be critical to address these issues through proper human–machine interface designs and in-app mechanisms, as well as the optimal spatiotemporal distribution of incentives for making such apps safe and effective while maintaining their attractiveness. It is also important to address these safety implications as more and more location-based AR apps similar to Pokémon GO are developed.
Study limitations
This study has its limitations. First, in terms of the survey data collection process, the voluntary nature of and the topic of the online survey can potentially limit the types of participants as they are more likely to be either Pokémon GO users or people who show interest in Pokémon GO or apps in general. Also, a sizable portion of the responses (11.2% or 114 out of 1017 participants) came from Indiana which may not be representative of the general population in the U.S. Second, in terms of the data collected, there are possible drawbacks to use self-reported behavioral information and stated preference survey data in the online survey. These include, but not limited to, the following (Hessing et al. 1988; Langenbucher and Merrill 2001; Althubaiti 2016; de Almeida Correia et al. 2019; Zheng et al. 2020): (a) social desirability bias (respondents may choose an answer that they perceive to be viewed more favorably by others); (b) recall bias (a systematic error caused by variations in the accuracy and/or completeness of the recollections retrieved); (c) limited sampling due to respondent availability (e.g., when a survey is conducted online, only respondents with internet access will be able to provide their responses); (d) hypothetical bias (respondents may choose an answer in their hope to influence possible policy outcomes). In addition, without detailed sociodemographic or behavioral information from Niantic (which is unlikely to be released by them) or in the absence of any other studies related to understanding the impacts of Pokémon GO on travel behavior to the best of the authors’ knowledge (compare the observed impacts), the authors cannot validate the representativeness of the sample compared to Pokémon GO users in general. Third, only data from self-identified Pokémon GO users was used to analyze the impacts of Pokémon GO on route and mode choice decisions. It is not clear if similar observations/attitudes can be found among people who do not use or are not interested in using apps like Pokémon GO but are asked to use it. Fourth, this study is exploratory in nature due to its novelty, and hence, does not control the family-wise error rate, or alternative multiplicity corrections, for inflated type 1 error in model estimation. The authors acknowledge that future investigations are needed to further validate the statistical significance of the variables identified in this study (Armstrong 2014). Fifth, some of the recently developed models offer the potential to accommodate diverse nuances of unobserved heterogeneity (Anastasopoulos 2016; Guo et al. 2020b). Future studies can be developed to evaluate the potential of using such approaches for model estimation. Seventh, additional studies are needed to understand Pokémon GO’s potential to influence people’s destinations and the safety implications of Pokémon GO. Lastly, Pokémon GO has gone through several major evolutions after the survey that may influence the impacts of Pokémon GO on route and mode choice decisions. For example, in 2018, Pokémon GO reworked its friendship system to promote users to do collaborative tasks for additional in-app benefits (Pokémon 2020). This may encourage people to coordinate their travel more (e.g., going to the same location at the same time or carpool together to complete the collaborative tasks on the road). During the COVID-19 pandemic, Pokémon GO introduced several new features (i.e., stay-at-home benefits) in March 2020 to encourage people to stay at home. Additional studies are needed to evaluate the impacts of these updates on users’ route and mode choice decisions.
Concluding comments
Study findings and insights related to Pokémon GO’S impacts on users’ route and mode choice decisions
This study provides evidence that Pokémon GO could impact users’ route and mode choice decisions by leveraging AR, gamification, and social component for interactions. In terms of route choice decisions, this study shows that providing in-app benefits (direct tangible benefits) through fixed- and dynamic-location virtual objects using AR can influence users’ work and non-work route choice decisions. In Pokémon GO, fixed-location virtual objects are predetermined by the app, and dynamic-location virtual objects are randomly spawned around users. If these virtual objects’ locations can be controlled, it is possible that Pokémon GO can be used to change its users’ route choice decisions in real-time. The study results show the potential for policymakers and system operators to collaborate with app developers to control the locations of virtual objects with direct tangible benefits to influence the route choice decisions of the app users.
Model estimation results related to mode choice decisions suggest that certain subpopulations of Pokémon GO users have carpooled frequently and are willing to carpool more instead of driving alone for more in-app collaboration, and are more willing to shift from driving alone to bus and non-motorized modes if provided with additional in-app benefits. Several Pokémon GO users have already shifted from driving alone to walk for work and non-work trips and increased their daily steps walked (Table 2). These results also illustrate the importance of the gamification and social component in Pokémon GO. Gamification can encourage individual users to set up personal goals (e.g., catching all types of Pokémon), monitor their progress, and acknowledge and reward their achievements upon completing these goals. In addition, gamification challenges individual users to achieve different goals set up by the app developer (e.g., daily quest or weekly challenges), encourage users to complete these goals, and feel a sense of ownership in achieving them. These intangible benefits can improve the effectiveness of the app in influencing its users’ travel decisions. From a policy standpoint, these findings indicate that policymakers can collaborate with app developers to encourage carpooling and promote long-term sustainable mode shifts to using transit and non-motorized modes by providing tangible and intangible benefits through AR, gamification, and social components for interactions. It is important to emphasize the potential of providing tangible benefits (particularly direct tangible benefits) in promoting app attractiveness and sustained long-term sustainable behavioral changes. For example, transit service providers can promote transit usage by linking Pokémon GO with bus smart card to provide in-app benefits for every bus ride. Furthermore, incorporating social interactions that encourage carpooling can potentially mitigate safety concerns by distributing the driving burden and fostering collaborations in the app.
The social components in Pokémon GO provide individual users with opportunities for social interactions that include opportunities for competition (e.g., competing with other users to capture Pokémon Gyms), collaboration (e.g., carpooling with other users instead of driving alone to use Pokémon GO), companionship (e.g., building friendship with others users to use and discuss Pokémon GO together), and social reinforcement (e.g., obtaining support on social media by sharing achievements). Social components, along with the integration of gamification, can provide intangible benefits to users for increasing attractiveness and maintaining user engagement over the long-term to reduce their dropout rate (O'Brien and Toms 2008; Gerlich et al. 2015). Furthermore, social interactions foster the formation of communities that provide social support to app users, help to spread such attitudes, and establish corresponding social norms. These results show that it is important to integrate social components in future apps that are developed to facilitate long-term mode shift from drive alone to sustainable transportation mode.
In summary, while the popularity of mobile apps such as Pokémon GO is based partly on their entertainment quotient, they also have the potential to provide the basic platform for leveraging the increasing ubiquity of mobile devices, the level of comfort that Millennials and generations thereafter have with technology and interactions thereof, the advances in AR and virtual reality technologies, and the emerging trend of virtual socialization and gamification to develop a new generation of incentivizing strategies to influence travel decisions that address multiple goals at the individual user and system levels. Then, from the traffic system performance perspective, there arise the interesting questions of how to target different subpopulations of travelers through customized strategies, and what would characterize the contours of such strategies.
Moving forward beyond Pokémon GO
Based on the findings and insights learnt from understanding the impacts of Pokémon GO on route and mode choice decisions, a conceptual framework (Fig. 4) is proposed to integrate AR, gamification, and social components through mobile apps (hereafter referred to as “integrated apps”) for influencing individual users’ route and mode choice decisions, and address goals from the perspectives of both the system operator and individual users.

Conceptual framework for integrated apps
In the proposed framework, the histories of individual users’ travel decisions are collected through integrated apps with users’ identities masked. These travel decision histories, the current system performance, network evolution, and the system-level goals are used by the system operator to leverage AR to develop low-cost app-based solutions to manage traffic in real-time, especially during peak hours, by adjusting the location, content, and/or timing of virtual objects with direct and indirect tangible benefits in the traffic network. In-app advertisements from local businesses or online services/sellers can be used for financing direct tangible benefits for the users, which can include discount coupons or gift cards. Other app mechanisms such as unlocking additional achievements or discounts by using ridesharing service from a partner organization can also be explored as the potential sources for providing direct tangible benefits. A key policy implication is that by providing such technology-leveraged incentives instead of just penalties (e.g., tolls), a system operator can dynamically manage traffic conditions by influencing users’ route choice decisions while fostering sustainable choices in the long term and alleviating public acceptance and equity concerns associated with market-based solutions. Furthermore, the use of AR is synergistic with the emerging connected and automated vehicular technologies that can seamlessly obtain information from integrated apps and perform actions automatically based on user preferences, thereby reducing their distraction arising from interactions with the app. However, the use of such integrated apps can also generate emergent challenges such as redundant trips made by users to engage in app-related activities (induced demand) and unsafe driving maneuvers (e.g., intentionally slowing down to interact with virtual objects). Thus, it will be critical to address these issues through human–machine interface designs and in-app mechanisms, and optimal spatiotemporal distribution of incentives for making such apps safe and effective while maintaining their attractiveness.
The information on virtual objects will be provided to individual users through an integrated app’s interface. The main component of the interface is a virtual traffic network, which is a virtual representation of the real-world physical traffic network and acts as an interface between the system operator and users. Through the app’s interface, the system operator will provide personalized travel-related (e.g., travel time) and virtual objects (e.g., location, content, and/or timing) information associated with route and mode options when users input the origin and destination. This information will enable individual users to make short-term travel decisions. Based on their travel decisions, the app will use the integrated gamification capability to provide information-based feedback to influence individual users’ short- and long-term travel decisions. In addition, the app will provide achievement feedback through gamification that encourages individual users to set up personal economic, health, and environmental goals, monitor their progress, and acknowledge and reward their achievements upon completion of goals. For example, the app can create periodic achievement tasks for users to collect energy saving points by using transit instead of driving. The integrated gamification can provide individual users intangible benefits, such as a sense of involvement, satisfaction, and achievement by leveraging people’s natural desires for mastery, achievement, status, and competition (Hamari et al. 2014). In addition, gamification can enable the system operator to provide achievable economic, health, and environmental goals to individual users that can contribute to achieving system-level goals, and encourage users to complete these goals and feel (involved with and) a sense of ownership for achieving these goals. These intangible benefits can improve the effectiveness of the app in influencing users’ travel decisions. However, it may be beneficial to ensure that gamification related experiences are constantly evolving to avoid the potential repetitive nature of tasks/challenges that can diminish user interest, especially if the putative benefits to users cannot be monetized. This was observed in some of the previous apps in which mobility challenges/tasks such as “walk 3 km, cycle 3 km and tram 3 km” in MatkaHupi or “go for a walk during your lunch break” in Tripzoom can sometimes be viewed as repetitive.
Furthermore, integrated apps can potentially provide individual users with opportunities for social interaction through their social components, gamification, and the possibility of forming a community of users. These can possibly increase the apps’ attractiveness and maintaining user engagement over the long-term to reduce their dropout rate. It is important to note that most of the social interactions can be done anonymously without physical interactions and/or knowing each other in real-life in the proposed framework. Users can only choose to “know” each other by their usernames or user identification numbers and choose what types of information they want to make public. In addition, all the social interactions are voluntary, and the apps simply provide users with opportunities for such interactions. Users can use all of the app functions and receive most of the tangible and intangible benefits without engaging in social interactions. The tangible and intangible benefits provided through the integrated apps will provide learning experiences for users to adjust their behavior and form long-term travel decisions towards sustainable modes that lead to achieving system-level goals.
It is also important to highlight the safety issues of Pokémon GO and similar safety issues that may arise in integrated apps. Apart from app-related distracted driving, two other possible safety concerns are also identified in this study, including app-induced driving (i.e., increases exposure to accidents) and app-related unsafe driving maneuvers. Such integrated apps may encourage users to drive more frequently, longer, and to different locations for gaining in-app incentives through their interaction with virtual objects. This can potentially aggravate traffic congestion as well as make these users more susceptible to road accidents as the risk of having accidents increases when the total distance drove increases (Boucher and Turcotte 2020). Sometimes these users may even drive to unfamiliar areas for such interactions which can also potentially increase the risk of having accidents (Dingus et al. 2016). In addition, the safety mechanisms for the app should not be just limited to a speed-based safety mechanism. For example, some participants suggested that they frequently used Pokémon GO while driving in states that such behavior was illegal at the time of the survey (e.g., California). It is possible that these users may not be aware of such laws or regulations. It is also possible that they are aware of these laws or regulations but intentionally hide mobile app usage (e.g., playing Pokémon GO) while driving which can potentially increase the risk of having accidents similar to that of cell phone usage while driving (Kwon et al. 2014). Hence, additional studies are needed to address the aforementioned safety-related issues to foster using integrated apps to influence people’s route and mode choices.
This study can be extended in several directions. First, additional studies are needed to understand the impacts of Pokémon GO and similar apps (located-based gaming apps with AR and social components) on safety aspects of driving, walking, and cycling, and physical and mental health. Second, similar studies can be conducted in other countries to explore the potential regional differences in terms of impacts of Pokémon GO and similar apps on travel behavior. Third, to address the limitations of self-reported data, future studies can include tracking mechanisms to collect Pokémon GO and similar apps users’ travel decisions which can help to provide a better understanding in terms of the impacts of Pokémon GO and similar apps on travel behavior. Fourth, a prototype integrated app can be developed and field studies can be conducted to evaluate its effectiveness in influencing short- and long-term travel decisions using the conceptual framework proposed in this study. Fifth, the impacts of integrated apps and the apps’ market penetration on network performance in a real-world context can be studied using an integrated app prototype.
References
Abdel-Aty, M.: Analysis of driver injury severity levels at multiple locations using ordered probit models. J. Saf. Res. 34(5), 597–603 (2003)
Abou-Zeid, M., Ben-Akiva, M.: The effect of social comparisons on commute well-being. Transp. Res. Part A Policy Pract. 45(4), 345–361 (2011)
Akoglu, H.: User’s guide to correlation coefficients. Turk. J. Emerg. Med. 18(3), 91–93 (2018)
Allan, R.: Pokémon GO Usage Statistics Say It’s the Most Popular Mobile Game in U.S. History (2016). https://medium.com/@sm_app_intel/pok%C3%A9mon-go-usage-statistics-say-its-the-most-popular-mobile-game-in-u-s-history-ea09ea2bf6df#:~:text=first%20to%20respond.-,Pok%C3%A9mon%20GO%20usage%20statistics%20say%20it's%20the,mobile%20game%20in%20U.S.%20history&text=As%20of%20yesterday%2C%20Pok%C3%A9mon%20GO,mobile%20game%20in%20US%20history. Accessed 10 Oct 2020
Althoff, T., White, R.W., Horvitz, E.: Influence of Pokémon go on physical activity: study and implications. J. Med. Internet Res. 18(12), e315 (2016)
Althubaiti, A.: Information bias in health research: definition, pitfalls, and adjustment methods. J. Multidiscip. Healthc. 9, 211 (2016)
Anastasopoulos, P.C.: Random parameters multivariate tobit and zero-inflated count data models: addressing unobserved and zero-state heterogeneity in accident injury-severity rate and frequency analysis. Anal. Methods Accid. Res. 11, 17–32 (2016)
Anastasopoulos, P.C., Karlaftis, M.G., Haddock, J.E., Mannering, F.L.: Household automobile and motorcycle ownership analyzed with random parameters bivariate ordered probit model. Transp. Res. Rec. 2279(1), 12–20 (2012)
Armstrong, R.A.: When to use the Bonferroni correction. Ophthalmic Physiol. Opt. 34(5), 502–508 (2014)
Ayers, J.W., Leas, E.C., Dredze, M., Allem, J.P., Grabowski, J.G., Hill, L.: Pokémon GO—a new distraction for drivers and pedestrians. JAMA Intern. Med. 176(12), 1865–1866 (2016)
Azevedo, C.L., Seshadri, R., Gao, S., Atasoy, B., Akkinepally, A.P., Christofa, E., Zhao, F., Trancik, J., Ben-Akiva, M.: Tripod: sustainable travel incentives with prediction, optimization, and personalization. In: The 97th Annual Meeting of Transportation Research Board (2018)
Bamberg, S., Fujii, S., Friman, M., Gärling, T.: Behaviour theory and soft transport policy measures. Transp. Policy 18(1), 228–235 (2011)
Barbieri, S., Vettore, G., Pietrantonio, V., Snenghi, R., Tredese, A., Bergamini, M., Previato, S., Stefanati, A., Gaudio, R., Feltracco, P.: Pedestrian inattention blindness while playing Pokémon Go as an emerging health-risk behavior: a case report. J. Med. Internet Res. 19(4), e86 (2017)
Barkley, J.E., Lepp, A., Glickman, E.L.: “Pokémon Go!” may promote walking, discourage sedentary behavior in college students. Games Health J. 6(3), 165–170 (2017)
Ben-Elia, E., Shiftan, Y.: Which road do I take? A learning-based model of route-choice behavior with real-time information. Transp. Res. Part A Policy Pract. 44(4), 249–264 (2010)
Bhowmik, T., Yasmin, S., Eluru, N.: A multilevel generalized ordered probit fractional split model for analyzing vehicle speed. Anal. Methods Accid. Res. 21, 13–31 (2019)
Bordin, S., Menéndez, M., De Angeli, A.: ViaggiaTrento: an application for collaborative sustainable mobility. ICST Trans. Ambient Syst. 1(4), e5 (2014)
Boucher, J.P., Turcotte, R.: A longitudinal analysis of the impact of distance driven on the probability of car accidents. Risks 8(3), 91 (2020)
Broll, G., Cao, H., Ebben, P., Holleis, P., Jacobs, K., Koolwaaij, J., Luther, M., Souville, B.: Tripzoom: an app to improve your mobility behavior. In: Proceedings of the 11th International Conference on Mobile and Ubiquitous Multimedia, p. 57. ACM (2012)
Carreras, I., Gabrielli, S., Miorandi, D., Tamilin, A., Cartolano, F., Jakob, M., Marzorati, S.: SUPERHUB: a user-centric perspective on sustainable urban mobility. In: Proceedings of the 6th ACM Workshop on Next Generation Mobile Computing for Dynamic Personalized Travel Planning, pp. 9–10. ACM (2012)
Chen, P.L., Saleh, W., Pai, C.W.: Pokemon gaming causes pedestrians to run a red light: an observational study of crossing behaviours at a signalised intersection in Taipei City. Transp. Res. Part F Traffic Psychol. Behav. 55, 380–388 (2018)
Christoforou, Z., Cohen, S., Karlaftis, M.G.: Vehicle occupant injury severity on highways: an empirical investigation. Accid. Anal. Prev. 42(6), 1606–1620 (2010)
Daoud, J.I.: Multicollinearity and regression analysis. In: Journal of Physics: Conference Series, Vol. 949, No. 1, p. 012009. IOP Publishing (2017)
Dastjerdi, A.M., Kaplan, S., e Silva, J.D.A., Nielsen, O.A., Pereira, F.C.: Participating in environmental loyalty program with a real-time multimodal travel app: user needs, environmental and privacy motivators. Transp. Res. Part D Transp. Environ. 67, 223–243 (2019a)
Dastjerdi, A.M., Kaplan, S., e Silva, J.D.A., Nielsen, O.A., Pereira, F.C.: Use intention of mobility-management travel apps: the role of users goals, technophile attitude and community trust. Transp. Res. Part A Policy Pract. 126, 114–135 (2019b)
de Almeida Correia, G.H., Looff, E., van Cranenburgh, S., Snelder, M., van Arem, B.: On the impact of vehicle automation on the value of travel time while performing work and leisure activities in a car: theoretical insights and results from a stated preference survey. Transp. Res. Part A Policy Pract. 119, 359–382 (2019)
Di Dio, S., Rizzo, G., Vinci, I.: How to track behaviours’ changes toward more sustainable mobility habits: the serious game of TrafficO2. In: Proceedings of the International Conference on Design, Social Media and Technology to Foster Civic Self-Organisation Conference, Hasselt (BE) (2015)
Di Dio, S., Lissandrello, E., Schillaci, D., Caroleo, B., Vesco, A., D’Hespeel, I.: MUV: A game to encourage sustainable mobility habits. In: International Conference on Games and Learning Alliance, pp. 60–70. Springer, Cham (2019)
Dingus, T.A., Guo, F., Lee, S., Antin, J.F., Perez, M., Buchanan-King, M., Hankey, J.: Driver crash risk factors and prevalence evaluation using naturalistic driving data. Proc. Natl. Acad. Sci. 113(10), 2636–2641 (2016)
Dorward, L.J., Mittermeier, J.C., Sandbrook, C., Spooner, F.: Pokémon Go: benefits, costs, and lessons for the conservation movement. Conserv. Lett. 10(1), 160–165 (2017)
Faccio, M., McConnell, J.J.: Death by Pokémon GO: the economic and human cost of using apps while driving. J. Risk Insur. 87, 815–849 (2017)
Federal Highway Administration (FHWA): Average Annual Miles per Driver by Age Group (2016). https://www.fhwa.dot.gov/ohim/onh00/bar8.htm. Accessed 27 Dec 2016
Fountas, G., Anastasopoulos, P.C.: A random thresholds random parameters hierarchical ordered probit analysis of highway accident injury-severities. Anal. Methods Accid. Res. 15, 1–16 (2017)
Fountas, G., Anastasopoulos, P.C.: Analysis of accident injury-severity outcomes: the zero-inflated hierarchical ordered probit model with correlated disturbances. Anal. Methods Accid. Res. 20, 30–45 (2018)
Fountas, G., Anastasopoulos, P.C., Abdel-Aty, M.: Analysis of accident injury-severities using a correlated random parameters ordered probit approach with time variant covariates. Anal. Methods Accid. Res. 18, 57–68 (2018)
Froehlich, J., Dillahunt, T., Klasnja, P., Mankoff, J., Consolvo, S., Harrison, B., Landay, J.A.: UbiGreen: investigating a mobile tool for tracking and supporting green transportation habits. In: Proceedings of the Sigchi Conference on Human Factors in Computing Systems, pp. 1043–1052. ACM (2009)
Frommer, D.: Millions of Americans Still Play Pokémon GO Every Day. https://www.vox.com/2017/3/23/15039626/pokemon-go-daily-users-chart. Accessed 10 Oct 2020 (2020)
Gerlich, R.N., Drumheller, K., Babb, J., De’Armond, D.A.: App consumption: an exploratory analysis of the uses and gamification of mobile apps. Acad. Mark. Stud. J. 19(1), 69 (2015)
Greene, W.H.: Econometric Analysis, 4th edn. Prentice Hall, New Jersey (2000)
Guo, Y., Peeta, S.: Rail-truck multimodal freight collaboration: truck freight carrier perspectives in the United States. J. Transp. Eng. 141(11), 1–11 (2015)
Guo, Y., Peeta, S.: Impacts of interactive accessibility information intervention strategy on residential location choice and travel-related behavior. In: Compendium of Transportation Research Board 96th Annual Meeting, Washington D.C., U.S. (2017)
Guo, Y., Peeta, S.: Impacts of personalized accessibility information on residential location choice and travel behavior. Travel Behav. Soc. 19, 99–111 (2020)
Guo, Y., Agrawal, S., Peeta, S., Somenahalli, S.: Impacts of property accessibility and neighborhood built environment on single-unit and multiunit residential property values. Transp. Res. Rec. J. Transp. Res. Board 2568, 103–112 (2016a)
Guo, Y., Wang, J., Peeta, S.: The impacts of household registration and head of household travel behavior on travel mode choice in China. In: Compendium of Transportation Research Board 95th Annual Meeting, Washington D.C., U.S. (2016b)
Guo, Y., Wang, J., Peeta, S., Anastasopoulos, P.C.: Impacts of internal migration, household registration system, and family planning policy on travel mode choice in China. Travel Behav. Soc. 13, 128–143 (2018)
Guo, Y., Peeta, S., Agrawal, S., Benedyk, I.: Understanding Safety implications of location-based augmented reality mobile apps: perception, attitude, and app usage behavior. Presented in 99th Transportation Research Board Annual Meeting, January 15th, 2020, Washington D. C., the U.S.A. (2020a)
Guo, Y., Wang, J., Peeta, S., Anastasopoulos, P.C.: Personal and societal impacts of motorcycle ban policy on motorcyclists’ home-to-work morning commute in China. Travel Behav. Soc. 19, 137–150 (2020)
Hamari, J., Koivisto, J.: Social motivations to use gamification: an empirical study of gamifying exercise. In: ECIS 2013 Proceedings, paper 122 (2013)
Hamari, J., Koivisto, J., Sarsa, H.: Does gamification work? A literature review of empirical studies on gamification. In: System Sciences (HICSS), In Proceedings of 2014 47th Hawaii International Conference, pp. 3025–3034 (2014)
Hasegawa, H.: Analyzing tourists’ satisfaction: a multivariate ordered probit approach. Tourism Manag. 31(1), 86–97 (2010)
Hessing, D.J., Elffers, H., Weigel, R.H.: Exploring the limits of self-reports and reasoned action: an investigation of the psychology of tax evasion behavior. J. Person. Soc. Psychol. 54(3), 405 (1988)
Hopkins, D.: Can environmental awareness explain declining preference for car-based mobility amongst generation Y? A qualitative examination of learn to drive behaviours. Transp. Res. Part A Policy Pract. 94, 149–163 (2016)
Hopkins, D., Stephenson, J.: Generation Y mobilities through the lens of energy cultures: a preliminary exploration of mobility cultures. J. Transp. Geogr. 38, 88–91 (2014)
Hsiao, K., Chen, C.: What drives in-app purchase intention for mobile games? An examination of perceived values and loyalty. Electron. Commer. Res. Appl. 16, 18–29 (2016)
Hsu, C.L., Lin, J.C.C.: What drives purchase intention for paid mobile apps?—An expectation confirmation model with perceived value. Electron. Commer. Res. Appl. 14(1), 46–57 (2015)
Hu, X., Chiu, Y.C., Zhu, L.: Behavior insights for an incentive-based active demand management platform. Int. J. Transp. Sci. Technol. 4(2), 119–133 (2015)
Jalayer, M., Shabanpour, R., Pour-Rouholamin, M., Golshani, N., Zhou, H.: Wrong-way driving crashes: a random-parameters ordered probit analysis of injury severity. Accid. Anal. Prev. 117, 128–135 (2018)
Jariyasunant, J., Abou-Zeid, M., Carrel, A., Ekambaram, V., Gaker, D., Sengupta, R., Walker, J.: Quantified Traveler: Travel Feedback Meets the Cloud to Change Travel Behavior (No. UCTC-FR-2013–06) (2013)
Jariyasunant, J., Abou-Zeid, M., Carrel, A., Ekambaram, V., Gaker, D., Sengupta, R., Walker, J.L.: Quantified traveler: Travel feedback meets the cloud to change behavior. J. Intell. Transp. Syst. 19(2), 109–124 (2015)
Jin, S.T., Kong, H., Wu, R., Sui, D.Z.: Ridesourcing, the sharing economy, and the future of cities. Cities 76, 96–104 (2018)
Juhász, L., Novack, T., Hochmair, H.H., Qiao, S.: Cartographic vandalism in the era of location-based games—the case of OpenStreetMap and Pokémon GO. ISPRS Int. J. Geo-Inf. 9(4), 197 (2020)
Jylhä, A., Nurmi, P., Sirén, M., Hemminki, S., Jacucci, G.: Matkahupi: a persuasive mobile application for sustainable mobility. In: Proceedings of the 2013 ACM Conference on Pervasive and Ubiquitous Computing Adjunct Publication, pp. 227–230. ACM (2013)
Kaczmarek, L.D., Misiak, M., Behnke, M., Dziekan, M., Guzik, P.: The Pikachu effect: social and health gaming motivations lead to greater benefits of Pokémon GO use. Comput. Hum. Behav. 75, 356–363 (2017)
Kato, T.A., Teo, A.R., Tateno, M., Watabe, M., Kubo, H., Kanba, S.: Can Pokémon GO rescue shut-ins (hikikomori) from their isolated world. Psychiatry Clin. Neurosci. 71(1), 75–76 (2017)
Kazhamiakin, R., Marconi, A., Perillo, M., Pistore, M., Valetto, G., Piras, L., Avesani, F., Perri, N.: Using gamification to incentivize sustainable urban mobility. In: 2015 IEEE First International Smart Cities Conference (ISC2), pp. 1–6. IEEE (2015)
Kenworthy, J.R., Laube, F.B.: Patterns of automobile dependence in cities: an international overview of key physical and economic dimensions with some implications for urban policy. Transp. Res. Part A Policy Pract. 33(7–8), 691–723 (1999)
Khoo, H.L., Asitha, K.S.: User requirements and route choice response to smart phone traffic applications (apps). Travel Behav. Soc. 3, 59–70 (2016)
Klein, N.J., Smart, M.J.: Millennials and car ownership: less money, fewer cars. Transp. Policy 53, 20–29 (2017)
Kogan, L., Hellyer, P., Duncan, C., Schoenfeld-Tacher, R.: A pilot investigation of the physical and psychological benefits of playing Pokémon GO for dog owners. Comput. Hum. Behav. 76, 431–437 (2017)
Kwon, O.H., Yoon, Y., Jang, K.: Evaluating the effectiveness of the law banning handheld cellphone use while driving. Saf. Sci. 70, 50–57 (2014)
Langenbucher, J., Merrill, J.: The validity of self-reported cost events by substance abusers: limits, liabilities, and future directions. Eval. Rev. 25(2), 184–210 (2001)
Lee, Y.K., Chang, C.T., Lin, Y., Cheng, Z.H.: The dark side of smartphone usage: psychological traits, compulsive behavior and technostress. Comput. Hum. Behav. 31, 373–383 (2014)
Lehto, T., Oinas-Kukkonen, H.: Persuasive features in six weight loss websites: a qualitative evaluation. In: International Conference on Persuasive Technology, pp. 162–173. Springer, Berlin, Heidelberg (2010)
Li, Y., Landay, J.A.: Into the wild: low-cost ubicomp prototype testing. Computer 41(6), 94–97 (2008)
Li, Y., Guo, Y., Lu, J., Peeta, S.: Impacts of congestion pricing and reward strategies on automobile travelers’ morning commute mode shift decisions. Transp. Res. Part A Policy Pract. 125, 72–88 (2019)
Liu, C.Z., Au, Y.A., Choi, H.S.: Effects of freemium strategy in the mobile app market: an empirical study of google play. J. Manag. Inf. Syst. 31(3), 326–354 (2014)
Liu, J., Kauffman, R.J., Ma, D.: Competition, cooperation, and regulation: understanding the evolution of the mobile payments technology ecosystem. Electron. Commer. Res. Appl. 14(5), 372–391 (2015)
Long, J.S., Freese, J.: Regression Models for Categorical Dependent Variables Using Stata, 3rd edn. Stata Press, College Station (2014)
Magliocchetti, D., Gielow, M., De Vigili, F., Conti, G., De Amicis, R.: A personal mobility assistant based on ambient intelligence to promote sustainable travel choices. Procedia Comput. Sci. 5, 892–899 (2011)
Mannering, F.L., Shankar, V., Bhat, C.R.: Unobserved heterogeneity and the statistical analysis of highway accident data. Anal. Methods Accid. Res. 11, 1–16 (2016)
Marczewski, A.: Gamification: A Simple Introduction and a Bit More, (Self-Published on Amazon Digital Services, 2013). Kindle edition, Loc, 1405 (2013)
McFadden, D.: Econometric models of probabilistic choice. In: Structural Analysis of Discrete Data with Econometric Applications, pp. 198–270 (1981)
McFadden, D., Train, K.: Mixed MNL models for discrete response. J. Appl. Econom. 15(5), 447–470 (2000)
Mehra, A., Paul, J., Kaurav, R.P.S.: Determinants of mobile apps adoption among young adults: theoretical extension and analysis. J. Mark. Commun. pp. 1–29 (2020)
Meloni, I., di Teulada, B.S.: I-Pet individual persuasive eco-travel technology: a tool for VTBC program implementation. Transp. Res. Procedia 11, 422–433 (2015)
Meloni, I., Sanjust, B., Delogu, G., Sottile, E.: Development of a technological platform for implementing VTBC programs. Transp. Res. Procedia 3, 129–138 (2014)
Mobile App Daily: Pokemon GO Revenue, Statistics And All Figures Revealed (2019). https://www.mobileappdaily.com/2018/07/27/pokemon-go-revenue-statistics#:~:text=Pokemon%20GO%20Retention%20Rate&text=According%20to%20the%20reports%2C%20almost,is%2015%25%20after%203%20days. Accessed 17 Oct 2020
Mun, M., Reddy, S., Shilton, K., Yau, N., Burke, J., Estrin, D., Hansen, M., Howard, E., West, R., Boda, P.: PEIR, the personal environmental impact report, as a platform for participatory sensing systems research. In: Proceedings of the 7th International Conference on Mobile Systems, Applications, and Services, pp. 55–68. ACM (2009)
Nakashima, R., Sato, T., Maruyama, T.: Gamification approach to smartphone-app-based mobility management. Transp. Res. Procedia 25, 2344–2355 (2017)
O’Brien, H.L., Toms, E.G.: What is user engagement? A conceptual framework for defining user engagement with technology. J. Am. Soc. Inf. Sci. Technol. 59(6), 938–955 (2008)
Oleksinski, J.: Here’s How to Mater Pokémon GO (2016). https://nypost.com/2016/07/11/heres-how-to-master-pokemon-go/. Accessed 3 Nov 20
Owens, J.M., Antin, J.F., Doerzaph, Z., Willis, S.: Cross-generational acceptance of and interest in advanced vehicle technologies: a nationwide survey. Transp. Res. Part F Traffic Psychol. Behav. 35, 139–151 (2015)
Pew Research Center: Mobile Fact Sheet (2019). https://www.pewresearch.org/internet/fact-sheet/mobile/#:~:text=mobile%20revolution%20below.-,Mobile%20phone%20ownership%20over%20time,smartphone%20ownership%20conducted%20in%202011. Accessed 2 Nov 2020
Piras, F., Sottile, E., Calli, D., Meloni, I.: Automatic data collection for detecting travel behavior: the IPET platform. Procedia Comput. Sci. 134, 421–426 (2018)
Ploderer, B., Reitberger, W., Oinas-Kukkonen, H., Gemert-Pijnen, J.: Social interaction and reflection for behaviour change. Person. Ubiquitous Comput. 18(7), 1667–1676 (2014)
Pokémon, G.O.: Pokémon GO Updates (2020). https://pokemongolive.com/en/post/. Accessed 10 Oct 2020.
Quddus, M.A., Noland, R.B., Chin, H.C.: An analysis of motorcycle injury and vehicle damage severity using ordered probit models. J. Saf. Res. 33(4), 445–462 (2002)
Rasche, P., Schlomann, A., Mertens, A.: Who is still playing Pokemon Go? A Web-based survey. JMIR Ser. Games 5(2), e7 (2017)
Rauschnabel, P.A., Rossmann, A., tom Dieck, M.C.: An adoption framework for mobile augmented reality games: the case of Pokémon Go. Comput. Hum. Behav. 76, 276–286 (2017)
Roider, O., Wegener, S., Stark, J., Judmaier, P., Michelberger, F., Barberi, A.: Merging virtual world with real-life behavior: a concept for a smartphone app to influence young people’s travel behavior. Transp. Res. Rec. 2673, 241–250 (2019)
Ruiz-Ariza, A., Casuso, R.A., Suarez-Manzano, S., Martínez-López, E.J.: Effect of augmented reality game Pokémon GO on cognitive performance and emotional intelligence in adolescent young. Comput. Educ. 116, 49–63 (2018)
Russo, B.J., Savolainen, P.T., Schneider, W.H., IV., Anastasopoulos, P.C.: Comparison of factors affecting injury severity in angle collisions by fault status using a random parameters bivariate ordered probit model. Anal. Methods Accid. Res. 2, 21–29 (2014)
Sawano, T., Ozaki, A., Shimada, Y., Leppold, C., Tsubokura, M., Tsukada, M., Kami, M., Ohira, H.: Pokémon GO & driving. QJM Int. J. Med. 110(5), 311–312 (2017)
Schrammel, J., Busch, M., Tscheligi, M.: Peacox-Persuasive advisor for CO2-reducing cross-modal trip planning. In: PERSUASIVE (Adjunct Proceedings) (2013)
Serino, M., Cordrey, K., McLaughlin, L., Milanaik, R.L.: Pokémon Go and augmented virtual reality games: a cautionary commentary for parents and pediatricians. Curr. Opin. Pediatr. 28(5), 673–677 (2016)
Shaheen, S., Cohen, A., Zohdy, I., Kock, B.: Smartphone Applications to Influence Travel Choices: Practices and Policies. U.S. Department of Transportation (2016). https://ops.fhwa.dot.gov/publications/fhwahop16023/fhwahop16023.pdf
Statista: Most Popular Mobile Gaming Related Apps in the United States as of September 2019, by monthly users (2020). https://www.statista.com/statistics/580150/most-popular-us-gaming-apps-ranked-by-audience/. Accessed 13 Oct 2020
Stopher, P.R.: Reducing road congestion: a reality check. Transp. Policy 11(2), 117–131 (2004)
Sunio, V., Schmöcker, J.D.: Can we promote sustainable travel behavior through mobile apps? Evaluation and review of evidence. Int. J. Sustain. Transp. 11(8), 553–566 (2017)
Tang, B.J., Li, X.Y., Yu, B., Wei, Y.M.: How app-based ride-hailing services influence travel behavior: an empirical study from China. Int. J. Sustain. Transp. 14, 1–15 (2019)
Tate, D.F., Lyons, E.J., Valle, C.G.: High-tech tools for exercise motivation: use and role of technologies such as the internet, mobile applications, social media, and video games. Diabetes Spectr. 28(1), 45–54 (2015)
Tateno, M., Skokauskas, N., Kato, T.A., Teo, A.R., Guerrero, A.P.: New game software (Pokémon Go) may help youth with severe social withdrawal, hikikomori. Psychiatry Res. 246, 848 (2016)
Van Grove, J.: Gamification: How competition is reinventing business, marketing and everyday life. Mashable. Accessed 13 Oct 2020 (2011)
Vasserman, S., Feldman, M., Hassidim, A.: Implementing the wisdom of Waze. In: Twenty-Fourth International Joint Conference on Artificial Intelligence (2015)
Wagner-Greene, V.R., Wotring, A.J., Castor, T., Kruger, J., Mortemore, S., Dake, J.A.: Pokémon GO: Healthy or harmful? Am. J. Public Health 107(1), 35–36 (2017)
Washington, S.P., Karlaftis, M.G., Mannering, F.L.: Statistical and Econometric Methods for Transportation Data Analysis, 2nd edn. Chapman & Hall/CRC, Boca Raton (2010)
Wells, S., Forbes, P., Masthoff, J., Gabrielli, S., Jyllha, A.: SUPERHUB: integrating digital behaviour management into a novel sustainable urban mobility system. In: Proceedings of the 27th International BCS Human Computer Interaction Conference, p. 62. British Computer Society (2013)
Williams, R.: Understanding and interpreting generalized ordered logit models. J. Math. Sociol. 40(1), 7–20 (2016)
Williamson, J.W.: Will the ‘Pokémon’ be heroes in the battle against physical inactivity. Sport Exercise Med. 2(1), 13–14 (2016)
Wong, F.Y.: Influence of Pokémon Go on physical activity levels of university players: a cross-sectional study. Int. J. Health Geogr. 16(1), 8 (2017)
Xian, Y., Xu, H., Xu, H., Liang, L., Hernandez, A.F., Wang, T.Y., Peterson, E.D.: An initial evaluation of the impact of Pokémon GO on physical activity. J. Am. Heart Assoc. 6(5), e005341 (2017)
Yamamoto, T., Shankar, V.N.: Bivariate ordered-response probit model of driver’s and passenger’s injury severities in collisions with fixed objects. Accid. Anal. Prev. 36(5), 869–876 (2004)
YouGov: Pokémon Go: 34m Downloads, 31m Current Players, and 10m Paying Users Since U.S. Launch (2016). URL: https://today.yougov.com/topics/entertainment/articles-reports/2016/08/12/pokemon-go-34m-downloads-31m-current-players-and-1. Accessed 25 Oct 2020
Zhang, D., Magalhães, D.J.A.V., Wang, X.: Prioritizing bicycle paths in Belo Horizonte City, Brazil: analysis based on user preferences and willingness considering individual heterogeneity. Transp. Res. Part A Policy Pract. 67, 268–278 (2014)
Zheng, L., Guo, Y., Peeta, S., Wu, B.: Impacts of information from various sources on the evacuation decision-making process during no-notice evacuations in campus environment. J. Transp. Saf. Secur. 12(7), 892–923 (2020)
Zichermann, G., Cunningham, C.: Gamification by Design: Implementing Game Mechanics in Web and Mobile Apps. O’Reilly Media Inc., Newton (2011)
Author information
Authors and Affiliations
Contributions
The authors confirm contribution to the paper as follows: study conception and design: YG, SP, SA, and IB; data collection: YG, SA, IB; analysis and interpretation of results: YG; draft manuscript preparation: YG, SP, SA. All authors reviewed the results and approved the final version of the manuscript.
Corresponding author
Ethics declarations
Conflict of interest
On behalf of all authors, the corresponding author states that there is no conflict of interest.
Additional information
Publisher's Note
Springer Nature remains neutral with regard to jurisdictional claims in published maps and institutional affiliations.
Appendix
Appendix
Some other factors that were considered but not found to be statistically significantly correlated with travel decisions of interest.
Familiarity and involvement with Pokémon GO |
Number of days played at the time of survey |
Player level at the time of survey |
Date of starting to play Pokémon GO |
Pokémon GO related behavior |
Motivations to play Pokémon GO |
Sources of information or tips related to Pokémon GO |
Smartphone operating system used for Pokémon GO |
Frequency of playing Pokémon GO with people they know and strangers |
Experience of playing Pokémon GO with people they know and strangers |
Sociodemographic and behavioral characteristics |
Self-reported location lived in at the time of survey |
Average monthly temperature of the city that individual lived in at the time of survey |
Educational level |
Employment status |
Race/ethnicity |
Number of vehicles available |
Annual household income |
Work/school flexibility |
Number of household members |
Rights and permissions
About this article

Cite this article
Guo, Y., Peeta, S., Agrawal, S. et al. Impacts of Pokémon GO on route and mode choice decisions: exploring the potential for integrating augmented reality, gamification, and social components in mobile apps to influence travel decisions. Transportation 49, 395–444 (2022). https://doi.org/10.1007/s11116-021-10181-9
Accepted:
Published:
Issue Date:
DOI: https://doi.org/10.1007/s11116-021-10181-9