
Abstract
Numerical weather prediction models and high-performance computing have significantly improved our ability to model near-surface variables, but their uncertainty quantification still remains a challenging task. Ensembles are usually produced to depict a series of possible future states of the atmosphere, as a means to quantify the prediction uncertainty, but this requires multiple instantiation of the model, leading to an increased computational cost. Weather analogs, alternatively, can be used to generate ensembles without repeated model runs. The analog ensemble (AnEn) is a technique to identify similar weather patterns for near-surface variables and quantify forecast uncertainty. Analogs are chosen based on a similarity metric that calculates the weighted multivariate Euclidean distance. However, identifying optimal weights for similarity metric becomes a bottleneck because it involves performing a constrained exhaustive search. As a result, only a few predictors were selected and optimized in previous AnEn studies. A new machine learning similarity metric is proposed to improve the theoretical framework on how weather analogs are identified. First, a deep learning network is trained to generate latent features using all the temporal multivariate input predictors. Analogs are then selected in this latent space, rather than the original predictor space. The proposed method does not require prior predictor selection and an exhaustive search, thus presenting a significant computational benefit and scalability. It is tested for surface wind speed and solar irradiance forecasts in Pennsylvania from 2017 to 2019. Results show that the proposed method is capable of handling a large number of predictors, and it outperforms the original similarity metric in RMSE, bias, and CRPS. Since the data-driven transformation network is trained using the historical record, the proposed method has been found to be more flexible for searching through a longer record.
1 Introduction
Recent advancement in numerical weather prediction (NWP) systems and high-performance computing (HPC) technologies have greatly improved our ability to model near-surface variables. For example, High-Resolution Rapid Refresh (HRRR) and North American Mesoscale Model (NAM) can provide mesoscale weather forecasts at very high resolution, 3 km and 12 km, respectively. Theoretically, if boundary and initial conditions can be completely specified, all details of a turbulent flow can be exactly predicted based on the equations of motion (Venkatram 1983). However, due to observational biases and limitations in data assimilation, forecast accuracy can still be impacted by uncertainties in model initialization (Price et al. 2015). This uncertainty eventually propagates to the final forecasts and cause forecasts to be inaccurate. Therefore, forecast uncertainty quantification is critical to better understand and evaluate the quality of NWP predictions.
Ensemble models are typically produced to assess the forecast uncertainty associated with NWP systems. There are a wide range of methods for generating forecast ensembles, including varying the initial perturbations applied to state variables (i.e., wind speed, temperature, etc.), the dynamics schemes, or parameterizations of an NWP model, or using stochastic means of perturbing physical parameterizations (Clemente-Harding 2019). However, one important limitation of these method lies in their computational costs. NWP models are run multiple times, which linearly increases the computational cost.
Many statistical and machine learning (ML) methods can also be used to generate uncertainty information, i.e., probabilistic forecasts, in a postprocessing style, without running the model multiple times. There are, in general, two types of postprocessing methods. Parametric methods usually assume a prior distribution of the predictand and estimate the associated distributional parameters, for examples, ensemble model output statistics (Wilks 2009; Scheuerer and Hamill 2015), mixed-type meta-Gaussian regression (Herr and Krzysztofowicz 2005; Wu et al. 2011), and Bayesian-based methods (Raftery et al. 2005; Wang et al. 2009). The other type is the nonparametric method which does not assume a prior distribution of the predictand, but instead it empirically models the distribution using quantiles (Massidda and Marrocu 2018).
Specifically, analog ensemble (AnEn) (Delle Monache et al. 2013; Hamill and Whitaker 2006) is a nonparametric technique to generate ensemble predictions from a deterministic NWP model and the corresponding observations. It works by searching for historical forecasts that are most similar to the target forecast, and then, the past observations associated with the most similar past forecasts make up the ensemble members. Different from its predecessors (van den Dool 1989; Toth 1989) where large scale weather analogs are sought, AnEn identifies weather analogs independently at each grid point (Sperati et al. 2017) over a short time window, e.g., 3 h. The highly constrained way of analog identification drastically reduces the degree of freedom and increases the chance of finding good weather analogs, making it a fit solution for predicting near-surface variables, compared to other statistical ensemble methods, including quantile regression (Delle Monache et al. 2018) and linear regression (Delle Monache et al. 2013), and dynamic ensemble systems (Junk et al. 2015b, a).
AnEn also presents several computational benefits, among all to be computationally efficient using supercomputers because it is embarrassingly parallelizable (Cervone et al. 2017; Hu et al. 2020). AnEn generates forecast ensembles from existing deterministic predictions without running the numerical weather model multiple times. This characteristic can be valuable when limited computational resources are present but a large ensemble is needed for uncertainty quantification. AnEn is thus particularly suitable for high-resolution NWP models analog ensembles, where computational efficiency is an imperative.
The core of AnEn is a similarity metric that quantifies the distance (a.k.a. dissimilarity, error or skill) between any two given temporal, spatial, and multivariate forecasts. A set of predictor weights is used to determine the influence of the individual predictors. The optimal set of weights varies depending on the type of forecast (e.g., output variable), its location, time of day, or period of the year. Currently, the predictor weight combination is usually determined by a constrained exhaustive grid search process that tests a limited set of weight combinations, which remain fixed. This is an expedient, but it also introduces error. The current similarity metric is impeded by:
-
1.
Weight optimization is computationally expensive. Selecting a proper subset of the hundreds output by NWP models is a challenging task. Especially, the combination of multiple predictors and their relative weights are difficult to inform (Junk et al. 2015b).
-
2.
AnEn assumes a static model. However, NWP models are constantly subject to changes in their physical parameterization schemes (Bosveld et al. 2020; Fischereit et al. 2022). As a result, AnEn might not yield the expected improvement when a longer search period is used due to model updates and upgrades.
Due to the computational burden for optimizing predictor weights, previous work was limited to using only a few predictors. Alessandrini et al. (2015a) applied AnEn to short-term photovoltaic (PV) power forecasts at three power plants in Italy with a 1-year search period and five predictors. Cervone et al. (2017) investigated the performance of AnEn plus a feed-forward neural network to further account for the physical and the engineering bias, but it is also confined within 1 year of training and five predictors. Other applications of AnEn include wind speed forecasts (Eckel and Delle Monache 2016; Alessandrini et al. 2015b; Vanvyve et al. 2015; Shahriari et al. 2020) and air quality predictions (Monache et al. 2020), and they all suggest to use a few selected predictors and the need to have a static model.
This paper seeks to improve AnEn by proposing a neural network (NN)-based similarity metric to overcome the above limits. The NN is trained to learn a similarity metric, rather than the direct modeled output (Khodayar and Teshnehlab 2015; Xiaoyun et al. 2016; Gensler et al. 2016; Qing and Niu 2018). It associates patterns considering historical forecasts and observations, while the original metric only compares forecasts. Because the weights of an NN can be effectively trained, the proposed approach allows to seamlessly use more predictors to characterize the weather patterns, which was previously an intractable problem with the constraint grid search approach.
The paper is organized as follows: Section 2 introduces AnEn, the NN-based model architecture, and reverse analog (RA); Sect. 3 describes the observations and NWP forecasts used in the study; Sect. 4 shows verification results with deterministic and probabilistic metrics; and Sect. 5 provides the summary and conclusions.
2 Methodology
2.1 Analog Ensemble
AnEn generates forecast ensembles from an archive of deterministic model predictions and the corresponding observations of interest. AnEn first identifies the M most similar historical forecasts to the current target forecast, and then, the observations corresponding to the selected historical forecasts consist of the ensemble members. The number of analog members depends on the length of the search history: a very small number of analog ensemble members could lead to sampling errors and a very large number of members could generate extremely unrepresentative ensembles (Delle Monache et al. 2013; Hu et al. 2021; Bodini et al. 2021). This process is repeated for each forecast cycle time (e.g., when the forecast was initiated), each forecast lead time, and at each grid point independently.
The key component of AnEn is the weather similarity metric. Delle Monache et al. (2013) proposed the following equation as a measure for dissimilarity:
where \(F_\textrm{t}\) is the multivariate target forecast at the time t; \(A_{t^{\prime }}\) is a historical multivariate analog forecast at a historical time point \(t^{\prime }\); \(N_v\) is the number of variables from forecasts; \(w_{i}\) is the weight parameter for the forecast variable i as its importance; \(\sigma _{f_{i}}\) is the standard deviation of the respective variable during the historical time period; \({\tilde{t}}\) indicates a short time window over which the metric is computed and it equals half the number of the additional time points to consider; finally, \(F_{i, t+j}\) and \(A_{i, t^{\prime }+j}\) are the values of the respective target forecast and the past analog forecast in the time window for the variable i.
This metric has been broadly used in the literature (Junk et al. 2015b; Frediani et al. 2017; Delle Monache et al. 2013, 2018; Alessandrini et al. 2018; Hu and Cervone 2019). Its implementation (Hu et al. 2020) and application to large-scale simulation (Cervone et al. 2017) have also been studied. AnEn, being a highly parallelizable algorithm, thrives in cases where historical archives of observations and forecasts are abundant and the uncertainty information associated with a deterministic prediction is desired.
The current weather similarity metric, however, poses a dilemma in its optimization process. For example, most literature has only used a handful of predictors to calculate the similarity metric while, in reality, NWP models can simulate hundreds. A potential problem is that weather analogs identified with only a few predictors might not actually be “good analogs” (van den Dool 1989; Toth 1989). These weather analogs might not be representative of the underlying weather patterns and thus could introduce errors. Additionally, weight optimization can also lead to a computational burden. Generally, an extensive grid search algorithm is used to identify the best set of predictor weights. The computational cost scales exponentially with the number of variables. Reducing the number of trials for each predictor can reduce the computation, but it poses the risk of not finding the optimal weight combination. Neither of these approaches is suitable for investigating a large number of predictors.
The similarity metric is defined based on forecasts. Since weather forecasts are prone to errors due to imperfect model physics and data assimilation, the weather analogs might not be representative of the true weather regime. When forecasts are associated with a large error, e.g., if the NWP model misses the formation of convective clouds and issues a clear-day forecast, all weather analogs will be generated for the wrong type. A potential solution is to include more predictor variables, which can constrain the degree of freedom when calculating the similarity metric. Such false-positive weather analogs will then be associated with lower similarity measures.
2.2 Deep Analog
2.2.1 Machine Learning Model Architecture
NNs can extract high-level features and patterns by applying nonlinear transformation on multivariate input predictors time-series. A deep analog (DA) based on a NN learns an empirical transformation so that similar forecasts are closer together in this transformed space. A successful transformation implies that the nearest distance between two points in the transformed space actually represents two model runs that are most similar. This work is different from the original AnEn that weather similarity is not calculated directly with weather variables, which can be highly correlated, but on the transformed features. This task is also different from canonical classification and regression problems: there are no predefined categories and the optimal similarity measure of weather forecasts is unknown due to errors in the forecasts. NNs, instead, are designed to learn a set of functions that carries out effective transformation for finding weather analogs.
Training a NNs requires giving a set of examples and counter-examples, so that over time the network can learn patterns of similarity and encode them internally using a set of latent features. There are multiple types of networks designed for learning this similarity, and in this work we used a triplet network, which is a special case of a Siamese network.
Siamese and triplet NNs are specifically designed for identifying similar images. Baldi and Chauvin (1993) and Bromley et al. (1994) provide a generalized framework to train NNs for similarity-oriented tasks, without limiting the type of NN to use. The learned compressed representation is also referred to as embeddings or latent features that abstracts low-level features like rotation and scaling. For example, an RGB image with \(128\times 128\times 3\) pixels can be compressed to an embedding vector containing only 16 values. When applying a trained network, the embeddings of input images are first calculated. If two embeddings are similar, e.g., measured by their L2 norm, then the original images should also be similar. Past literature has explored their applications to feature extraction of fingerprints (Baldi and Chauvin 1993), signatures (Bromley et al. 1994), and faces (Chopra et al. 2005; Wu et al. 2017; Hsu et al. 2019).
The difference between Siamese and triplet networks consists of the way they select the output based on the input. Siamese networks require two images as input, and they choose if they belong to the same category or not. Triplet networks require three images as input, composed of a target image and two candidate images, and they choose which candidate is more similar to the target. In our case, rather than images, a target forecast and two candidate forecasts are used, and the network selects one of the two candidate forecasts. Working with forecasts is more challenging than images because of an additional data dimension, and increased search space. While images consist of three dimensions, horizontal and vertical axes, color layers (e.g., usually three or four variables like red, green, blue and alpha channel), forecasts have horizontal and vertical axes, a temporal forecast lead time (generally 24–72 h), and predictors (hundreds of variables like temperature, wind, fluxes, at different pressure levels).
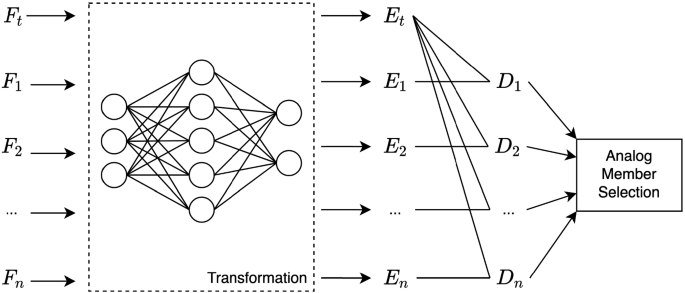
Schematic of the proposed deep analog network process. F denotes the multivariate forecast time series, t for target, E for embedding, and D for distance
While it is theoretically possible using any type of NN to create latent features, in this work we used a long short-term memory (LSTM) to encode forecast time series. Hochreiter and Schmidhuber (1997a) originally proposed LSTM to encode time sequence information of arbitrary lengths (Chung et al. 2014; Xiaoyun et al. 2016; Gensler et al. 2016; Qing and Niu 2018; Gao et al. 2019). LSTMs use memory cells and gate units to allow information from previous time lags to flow easily into later predictions (Hochreiter and Schmidhuber 1997b; Gers et al. 2000). Recall the term \({\tilde{t}}\) from Eq. (1) indicating a time window. This parameter is usually set to one, but it can vary based on the application. When generating AnEn, the length of time series varies depending on the time window size. Therefore, the ability to encode an arbitrarily long time sequence is desired when generating embeddings for similarity calculation.
Figure 1 shows the schematic of DA. F stands for multivariate forecasts from an NWP model; \(F_\textrm{t}\) denotes the target forecast and \(F_i (i \in {1, 2, ..., n})\) denotes the n historical forecasts; \(E_\textrm{t}\) represents the transformed target forecast and \(E_i\) denotes the transformed historical forecast; D stands for distance. Transformation is first carried out for both the target forecast and historical forecasts. The generated embeddings (\(E_\textrm{t}\) and \(E_i\)) are then used to calculate distances. Analog members are finally determined based the distance in the transformed parameter space, rather than on the original input variables.
2.3 Model Training
The training process of DA is done by minimizing the triplet loss function (Hoffer and Ailon 2015; Schroff et al. 2015; Dong and Shen 2018). It is a discriminative loss function that encourages the output to be small for similar pairs and large for dissimilar pairs. It works by taking a triplet as input, composed of a target (\(F_\textrm{t}\)), a positive (\(F_\textrm{p}\)), and an negative forecast (\(F_\textrm{n}\)). Then, the triplet loss function is given by:
where N is the number of triplet samples and \(E_{\omega }\) denotes the embeddings generated from the LSTM network with learnable weights \(\omega \); \(||E_{\omega }(F_\textrm{t}^i) - E_{\omega }(F_\textrm{p}^i)||\) denotes the L-2 norm between the target and the positive forecasts for the i-th triplet sample. \(\alpha \) is a margin that keeps negative pairs away from positive pairs.

Schematic of the reverse analog for constructing triplet samples
We propose the RA for constructing triplet samples for training, inspired by the negative sampling technique (Dyer 2014; Goldberg and Levy 2014; Xu et al. 2015; Wang et al. 2018). As shown in Fig. 2, the process of sampling triplet forecasts is given below:
-
1.
An observation and forecast target pair is selected (orange and blue rectangles linked with the dashed double arrow).
-
2.
Most similar historical observations to the target observation are identified (green rectangles), based on the smallest absolute value difference.
-
3.
The historical forecasts corresponding to the most similar observations are selected (red rectangles).
-
4.
A triplet is created by sampling one positive example from the selected historical forecasts and a negative counter example from the remaining historical forecasts (black rectangle).
The key idea of RA is that the forecast similarity is determined by whether their associated observations are similar. When observations are the most similar, their associated forecasts are the ideal analogs given the current data. However, similar observations can have very different forecasts, which would normally not be selected as analogs by the traditional AnEn. On the other hand, the NN learns a nonlinear transformation that converts the original weather predictors into a new representation space defined in terms of similarity of the observed fields. Therefore, in this transformed search space, the metric favors analogs with similar observations, which might have different weather predictors.
With Eq. (1) in AnEn, the only way to include both the forecast-observation relationship during the analog search is to use the current observation at time-zero as additional predictors in Eq. (1). This is because in real time, future observations (beyond time-zero) are unavailable. It is theoretically possible to test whether observations would lead to better analogs using historical data, but this cannot be transitioned to an operation method.
The selection of the positive and negative cases for the triplet training can be performed in a number of ways. For example, the triplet could always be composed of the most similar and most dissimilar forecasts, but this would lead to training the model with the easiest cases. In turn, this will lead to poor performance because the network is only presented with extreme cases (e.g., a sunny day vs a hurricane) and is not able to distinguish smaller differences. A fitness proportionate selection (Whitley 1994; Hancock 1994) was used to introduce randomness and to prevent a greedy search (Vafaie and Imam 1994; Wilt et al. 2010; Hu and Cervone 2019). The goal is to learn a generalizable embedding function relating forecasts and observations.
In this work, we trained two separate transformation networks for wind speed and solar irradiance. Both networks use the entire set of 227 available variables from the NWP model with a sequential architecture of an LSTM followed by a linear output layer. The LSTM consists of 20 hidden units and 3 stacked layers. The 20 hidden units are then input to the linear layer to generate the final 20 embeddings. To prevent overfitting during training, a dropout rate of 0.01 is used for LSTM. The early stopping mechanism is engaged when no improvement on the validation set is observed for 15 consecutive epochs. The optimizer is adaptive moment estimation (ADAM) with a learning rate of 0.005. PyTorch v 1.8.1 was used for the implementation. The code is available at https://weiming-hu.github.io/AnalogsEnsemble for AnEn and https://github.com/Weiming-Hu/DeepAnalogs for DA. Hyperparameter tuning is done using data from 2011 to 2018, excluding the test year 2019 to prevent data leakage. NN was trained using on a Dell Precision 7920 workstation with 64 GB of RAM, 16 GB of GPU memory, and 16 physical cores.
3 Research Data
Experiments are done on two geographic scales: a local study located at the Pennsylvania State University, and a regional study covering the entire state of Pennsylvania. For the local study, data used originate from a ground observation station actively maintained by the Surface Radiation Budget (SURFRAD) project.Footnote 1 Observations of solar irradiance and surface wind speed are available between 2011 and 2019. SURFRAD (Augustine et al. 2000, 2005) project was established in 1993 to provide high-quality, continuous, and long-term measurements of the surface radiation budget. Observations from SURFRAD have been used in various validation procedures for satellite-derived estimates and NWP models. In our case, the verified NWP model is the NAM forecast system (For Environmental Prediction/National Weather Service/NOAA/US Department of Commerce 2015). NAM is a major operational model run by National Centers for Environmental Prediction (NCEP) for weather predictions. It uses boundary conditions from the global forecast system (GFS) model and is initialized four times per day at 00, 06, 12, and 18 UTC, each producing forecasts for the next 84 h. The first 37 forecast lead times are provided hourly and after that every 3 h for the following 57 h. In this study, NAM data with a 12-km spatial resolution were used. NAM provides simulations for over three hundred weather variables that cover a wide range of vertical profile of the atmosphere. It simulates in total 60 vertical layers on a hybrid sigma-pressure coordinate system. It also simulates a single compound atmospheric layer for variables like downwelling shortwave solar radiation and total precipitation.
For the regional study, forecasts are still collected from NAM but verified against the model analysis, instead of SURFRAD due to its lack of spatial coverage and resolution. The model analysis is used as ground truth when measurements are not available. NAM analysis is provided four times a day, at 00, 06, 12, and 18 UTC. The output variables for the regional study are solar irradiance at the surface, and wind speed at the surface and 80 m above ground. The 80-m wind speed was included into the experiment because it is the benchmark for regional wind power assessment. In total, 1225 grid cells are used to simulate the entire state of Pennsylvania.
4 Results
Results for wind speed and solar irradiance predictions are shown in the following sections, divided into local and regional studies. Training and testing are performed using data from 2011 to 2018, and for 2019, respectively. Analogs are generated with an ensemble of 11 members.
Two different AnEn benchmarks are performed. In the first, predictors for AnEn are selected based on the literature (Cervone et al. 2017; Delle Monache et al. 2013; Alessandrini et al. 2019; Shahriari et al. 2020; Sperati et al. 2017), and predictor weights are optimized via a constrained extensive grid search, testing all possible combinations of discrete weights ranging from 0 to 1 with an increment of 0.1. The predictors manually selected include downwelling shortwave radiation, surface wind speed and wind direction, relative humidity and temperature at 2 m above ground. In the second benchmark, all 227 NAM predictors are used with equal weights, since a constrained extensive grid search for all 227 predictors is computationally prohibitive.
Following, AnEn is used to refer to results relative to the five weight optimized predictors, M-AnEn for results relative to all 227 predictors, equally weighted, and DA for results relative to the analogs computed using the NN metric.
4.1 Local Study
The local study is performed using data from the SURFRAD station located at 40.72\(^\circ \) N, 77.93\(^\circ \) W, 10 km southwest from the main campus, and NAM data for the cell which includes this location. This particular SURFRAD station is the only one available for the state of Pennsylvania. Additionally, the authors’ familiarity with local conditions can assist with the interpretations of the results.
4.1.1 Deterministic and Probabilistic Verification
A set of deterministic and probabilistic statistical tests are used to evaluate the analogs generated. For the deterministic tests, the ensemble mean is computed, while for the probabilistic metrics, all members of the ensemble are used.
Figure 3a–c shows the bias, root-mean-square error (RMSE), and continuous rank probability score (CRPS) for solar irradiance forecasts. For all figures, the horizontal axis represents the lead times for the 84 h of the NAM forecasts, and the vertical axis for solar irradiance in W/m\(^2\). Each figure shows four lines, for NAM, AnEn, M-AnEn and DA.
In terms of bias (Fig. 3a), NAM has on average the largest bias, followed by AnEn, DA, and M-AnEn. No method tested can totally eliminate the bias; however, the bias must be evaluated in combination with other metrics, as it is relatively easy to generate analogs, which have zero bias, but perform badly according to other predictive measures of accuracy. NAM shows a large negative value during mornings and a large positive value during afternoons, suggesting that the model does not perfectly capture the diurnal trend. AnEn has the second largest bias, which is negative for all lead times, suggesting a tendency to under-predict the observed value. DA has a smaller negative bias than AnEn for most lead times, suggesting that the combination of more predictors and the NN-based similarity metric can correct both the tendency to over- and under-predict. M-AnEn achieves the smallest bias among the AnEn methods, but it shows the reverse trend of a positive bias for most lead times.

Verification comparisons for a–c solar irradiance and d–f wind speed forecasts. Black crosses on the bottom of c, f indicate the lead time hours that DA is significantly better than the M-AnEn with a 90% confidence. Vertical dashed lines indicate individual forecast days in local time
In terms of RMSE and CRPS, DA outperforms all other methods. In terms of CRPS, DA outperforms the M-AnEn for most lead times in the first 24 h, and the results are statistically significant as shown by the 90% confidence shown with a shaded area in Fig. 3c. This result is extremely important because the first 24-h forecasts are paramount, due to the energy market operating on a day-ahead schedule. The forecasts can thus provide actionable information for energy system planning and scheduling trying to match power demand and supply.
Similarly, Fig. 3d, e, f shows the bias, RMSE and CRPS for surface wind speed forecasts. Lead times are shown on the horizontal axes, and wind speed is shown on the vertical axes in m/s. In terms of bias (Fig. 3d), NAM again shows the largest bias, also with a large variation. The AnEn and M-AnEn both showed a comparable negative bias, followed by the DA with the smallest positive bias for most lead times. Results suggest that DA forecasts have the least systematic bias compared to other methods.
Results of RMSE and CRPS (Fig. 3e, f) for wind speed are consistent with those for solar irradiance. The DA outperforms AnEn on almost all lead times. The improvement of DA over the M-AnEn is statistically significant for most lead times in the first 24 h, as shown by the 90% confidence interval. The close resemblance in RMSE between M-AnEn and NAM starting from the second day suggests (Fig. 3e) that increasing the number of predictor variables, without properly optimizing the predictor weights, does not improve prediction accuracy. Instead, DA uses the same number of predictors as M-AnEn, but predictors are first transformed into a set of latent features before weather analogs are sought. This nonlinear transformation is carried out by the trained NN that has learned the relative importance of the input predictors and optimized it for the best predictive skill.

Rank histograms for solar irradiance (a–c) and wind speed forecasts (d–f) with 11 ensemble members
The following metrics are used to test all members of the ensemble, and not just their means. Figure 4 shows the rank histograms Hamill (2001) for solar (a–c) and wind (d–f), where the horizontal axis shows the binned intervals determined by the sorted ensemble members, and the vertical axis the frequency with which an observation falls in each bin. A flat histogram indicates that over the entire test set, there is no over- or under-estimation because the observation is equally likely to be closest to any ensemble. A convex histogram (\(\cup \)-shaped) shows too many observations are outside of the ensemble, and therefore, ensembles are too small (under-dispersive); a concave histogram (\(\cap \)-shaped) shows that too many observations are within the ensemble, and therefore, ensembles are too large (over-dispersive).
Another metric to quantify the quality of ensemble dispersion is the missing rate error (MRE) Chu and Coimbra (2017), which represents the fraction of observations that are higher/lower than the highest/lowest ranked ensemble member. MRE is calculated as \(\textrm{MRE} = f_1 + f_M - 2/ (M + 1)\), where \(f_1\) and \(f_M\) are the relative frequencies of the first and the last bins in the histogram, and M is the number of ensemble members. A positive/negative MRE indicates under-/over- dispersion.
A ranked histogram with an increasing or decreasing trend shows a negative and positive bias, respectively. We refer to Hamill (2001); Delle Monache et al. (2013); Junk et al. (2015b) for a more in-depth discussion of the rank histogram and its interpretation. A set of ensemble forecasts are necessary to compute a ranked histogram, and therefore, it is not computed for NAM where only a deterministic forecast is available.
In terms of solar irradiance, the M-AnEn is shown to be over-dispersive (Fig. 4a), and this suggests that ensemble members have too much disagreement and this large internal variation within the ensemble indicates poor analogs. Both AnEn and DA are slightly under-dispersive (Fig. 4b, c) as shown by the positive MRE. However, the more prominent problem is a systematic negative bias indicated by the increasing heights of bars. This result is consistent with the negative bias shown in Fig. 3a.
Similarly, in terms of wind speed, both M-AnEn and AnEn are shown to be slightly over-dispersive with a negative bias (Fig. 4d, e). On the other hand, DA (Fig. 4f) shows an almost flat histogram, which indicates good calibration between ensemble forecasts and observations. A slightly decreasing trend of the bar heights shows the predictions are over-predicting, which is consistent with the small positive bias shown in Fig. 3d.

Binned spread-skill correlation diagrams for solar irradiance (a) and wind speed forecasts (b). Vertical lines indicate the 90% confidence interval
The spread-skill correlation is another metric to test the quality of the ensembles by measuring whether the ensemble spread is proportionate to the expected error. A set of ensemble forecasts are first split into a number of bins, and then, the correlation between the ensemble spread and the expected error is calculated within each bin. The expected error is calculated as the RMSE of the ensemble mean and plotted against spread. A well-calibrated ensemble has a close-to-one correlation between the ensemble spread and its expected error. Lines above/below the diagonal line indicate under-/over- dispersion.
Figure 5a, b shows the binned spread-skill correlation diagrams for solar irradiance and wind speed, respectively. DA and AnEn performed similarly for forecasts with small ensemble spread, showing under-dispersion. Both methods are over-dispersive for forecasts with large spread (solar irradiance over 180 W/m\(^2\) and wind speed over 1.8 m/s), but they are different that DA has a reduced RMSE compared to AnEn, while their ensemble spread is comparable. This reduction in RMSE, but not in ensemble spread, indicates that DA mostly improves the predictive skill of the hard-to-predict cases, but does not affect dispersion as much for these cases. Some examples of such hard-to-predict cases include: (1) abrupt weather regime changes and (2) constantly moving partial clouds. Since these cases typically have fewer natural analogs for which DA and AnEn try to find, both of them have limited skills in predicting these cases. However, they can choose different sets of historical forecasts as analogs that might yield different results. This difference will be further discussed in the following section.
4.1.2 Nonlinear Transformation and Latent Features
DA learns a nonlinear transformation on the predictor variables that can better characterize the relationship between forecasts and observations. There are 20 latent features generated by DA, optimized using the triplet training. To visualize all embeddings is ineffective, but it is possible to show slices of this latent space. A good transformation would show that forecasts clustered together in this new latent space correspond to the ideal ensemble members.

A case study of solar irradiance prediction on September 17, 2019, showing the predicted time series from various methods (a). The average of ensemble members are calculated to show a single predicted time series. The shaded area is 11 AM local time. A subset of the original forecast variables and the latent features at this particular time point are shown in (b) and (c). The irradiance ensemble from AnEn and DA are shown in (d), together with SURFRAD and NAM as points
The forecasts and the associated latent features are visualized for September 17, 2019, in Fig. 6. This day was chosen because of the relative high irradiation values, and the ineffective correction carried out by AnEn. It is also important to remember that glsNAM forecasts have a spatial resolution of 12 km, and thus, comparison with a single point is not an indication of overall model performance. We use this day to visualize how the generated latent futures help DA to generate a better prediction.
Figure 6a shows the observed SURFRAD measurements, the NAM forecast, and the ensemble mean for DA and AnEn. The M-AnEn is not shown because of its poor accuracy. SURFRAD time series shows a typical peak at around early afternoon when the sun reaches the solar noon. NAM slightly under-predicts solar irradiance in the morning but over-predicts in the afternoon. AnEn is shown to have a noticeable under-prediction through the day with a negative bias of about 180 W/m\(^2\) during solar noon. On the other hand, DA closely follows SURFRAD, having the highest prediction accuracy compared with NAM and AnEn.
The AnEn looks for analogs with the original forecast variables but DA works by generating a different set of latent features at each hour before analogs are sought. Figure 6b, c visualizes the relationship between two variables or features used by AnEn or DA, at 11:00 AM (shaded region in Fig. 6a). The grey dots indicate all the historical forecasts in the search repository from 2011 to 2018, and they collectively show the entire search space for this analog selection. The figure also shows the target forecast as a red circle; the historical forecasts selected by AnEn as orange crosses; the historical forecasts selected by DA as blue pluses; the ideal historical forecasts selected by RA process as green circles. These members are ideal because the corresponding observations to these forecasts produce the perfect ensemble (accurate and sharp). In other words, these forecasts are associated with the observations that are closest to the true solar irradiance value (at around 460 W/m\(^2\)).
While in the original forecast representation space (Fig. 6b), the ideal forecasts (green circles) are scattered and they are far from the target (red circle) and the AnEn members. In the transformed space (Fig. 6c), however, ideal forecasts are closer to the target forecast and the DA members. Since a Euclidean distance metric is used to define similarity in both spaces, a clustered pattern is helpful for DA to select the ideal forecasts as analogs. Although only two latent features are shown, choosing different latent features would change the shape of the 2D distribution, but they would not change the conclusions.
Since the transformation is learned on the basis of observation values, the analogs selected by DA outperforms the analogs selected by AnEn. The basis of this conclusion is that the transformation performed by NN learns the relationship between the forecasts and their associated observations, and this relationship defines a better Cartesian representation space to select analogs using an Euclidean metric, as shown in Fig. 6c.
The AnEn and DA ensembles are visualized using box plots in Fig. 6d. The box plots show a summary for the distribution of the analogs, where the horizontal line represents the median of the distribution, the box contains 50% of the data, and the whiskers extend to 1.5 times the interquartile range. NAM and SURFRAD are plotted as circles. The AnEn ensemble is shown to have a skewed distribution to do the negative bias of several analog members. DA generates a symmetric distribution, with the median matching the SURFRAD observation. This shows a more accurate and better calibrated ensemble.

Binned RMSE for a solar irradiance and b wind speed forecasts binned by NAM prediction error intervals measured by the absolute difference. Verification for wind speed forecasts are done for all forecast lead times; verification for solar irradiance forecasts is only done for lead times valid during day times. The number on top of each bar group denotes the total number of forecasts in the group
DA and AnEn use different representation spaces to characterize forecast similarity. This leads to different selection of historical forecasts as analogs. Another outcome of applying such a transformation before analog selection is the improved skill on hard-to-predict cases.
Figure 7 shows the binned RMSE as a function of the absolute error of NAM , for solar (a) and wind speed (b), respectively. As postprocessing methods, the goals of DA and AnEn are to remove errors from NAM and improve predictive skills. Figure 7 shows how much error is removed from NAM in each bin by applying the postprocessing methods. As a reference, NAM lies roughly on a one-to-one diagonal line and the area below indicates improvement by the particular postprocessing method. Points on the right side of the figures represent forecasts with larger error.
In terms of solar irradiance (Fig. 7a), DA outperforms (with a lower RMSE) AnEn and NAM for almost all bins except for the first bin where NAM is already accurate. This is expected because both AnEn and DA generate ensemble forecasts and need to account for the forecast uncertainty by having a group of similar forecasts. On the other hand, the bins to the right of the horizontal axis show that DA consistently removes more error from NAM compared to AnEn, especially for the hard-to-predict cases where large error from NAM is to be expected.
Similarly, Fig. 7b shows the same problem for wind speed. DA and AnEn are able to remove errors from NAM for almost all bins, but DA is more effective than AnEn at correcting NAM predictions for hard-to-predict cases (last three bins on the right). When NAM has a larger error, AnEn becomes less robust because it relies on these forecasts as predictors. The transformation carried out by a trained network in DA helps to better cope with these hard-to-predict cases.
In summary, both Figs. 6 and 7 show that, by applying a nonlinear transformation before analog selection; DA chooses a different set of analog forecasts from AnEn. Because the transformation is learned on the basis of observation values, the analogs selected by DA construct a more accurate ensemble, especially for predicting hard-to-predict cases.
4.1.3 Impact of Model Updates
Both AnEn and DA rely on historical forecasts and observations to generate forecast ensembles. One important assumption of AnEn is that similar forecasts have similar error patterns and thus the forecast error can be corrected by using the observations associated with the most similar historical forecasts. This assumption, however, can be violated if NWP models are updated during the historical period, which is common in model operation. Operational models are constantly being updated to improve their skills but, as a result, more recent forecasts no long possess the same error patterns with their historical analogs.
As an example, NAM has gone through a series of updates. The most notable change was a core update from the Eta model to the weather research and forecasting (WRF) model in 2006. Subsequently, NAM had minor updates once every several months.Footnote 2
The transformation of forecasts into a latent space, carried out by DA, can help analog identification to overcome the limit posed by model updates. Because two forecasts are deemed analogs as long as their observations are similar, they can have different predictors but still be put close to each other in the latent space. In other words, DA can be more tolerant of model updates, thanks to the transformation. In contrast, AnEn relies on model forecasts to calculate the similarity which can be more sensitive to model updates.
Two metrics are used to test the tolerance of model updates. RMSE is calculated using ensemble mean against SURFRAD observations. Brier score is another error metric that measures the accuracy of probabilistic forecasts. To calculate Brier score for continuous variables (like solar irradiance and wind speed), a threshold is first chosen. Observation (\(o_i\)) values are replaced with ones if they are over or equal the threshold, otherwise zero. Then, probabilistic forecasts (\(f_i\)) of whether the threshold will be exceeded is calculated. Brier score is calculated as \(\textrm{BS} = \frac{1}{N}\sum _{i = 1}^{N}{(f_i - o_i)^2}\), where N is the number of samples.

Sensitivity studies of the length of the search history for predicting solar irradiance and wind speed. Historical forecasts from 2018 are used for the single-year case; forecasts from 2017 to 2018 are used for the 2-year case; forecasts from 2015 to 2018 are used for the 4-year case; and forecasts from 2011 to 2018 are used for the 8-year case. The thresholds for Brier are the 75-th percentile of the distribution of solar irradiance and wind speed. a, b Show the RMSE and c, d show the Brier scores. The performance metrics are generated from a subset of lead times (11 AM to 12 PM) to prevent skewed verification due to night times and to ensure variability. Weights used by AnEn are optimized using the 8-year case; the embedding network used by DA is trained with the 8-year case
Figure 8a, b shows the RMSE as a function of the number of search years. The M- AnEn has a high RMSE for both solar irradiance and wind speed because its weights are not optimized, but as more years are included in the search repository, RMSE drops and its performance increases. The AnEn and DA have similar RMSE up until 4 years in the repository. When more data are included (e.g., 8 years), AnEn no longer yields the expected improvement in performance, but DA continues to gain improvement from having a larger search repository.
In terms of Brier scores (Fig. 8c, d), the 75-percentile value is selected as the threshold, corresponding to 730 W/m\(^2\) in irradiance and 4.2 m/s in wind speed. This percentile is chosen because the corresponding solar irradiance and wind speed are usually preferred (or minimum) conditions for power generation. Again, M- AnEn is shown on the top with the highest error, but its performance increases as more data are available in the search repository. The performance of AnEn peaks when having 4 years in search and decreases when more years are added, but DA does not suffer from the same issue and continues to gain improvements.
In summary, AnEn relies on the NAM variables as predictors when searching for analogs. This approach provides an exact mapping between the target and historical forecasts. It assumes that similar forecasts are associated with similar errors, and therefore, forecast errors can be corrected by looking for similar historical forecasts. However, any updates to the model (changes to the data assimilation process or physic schemes) would break this mapping, whereas the nonlinear relationship from the DA would be more robust and it does not assume the model is static throughout the historical record. Figure 8 shows that, consistently, DA has a better tolerance of model updates and benefits from having a large search repository. DA learns the forecast–observation relationship from historical data and tries to use this relationship when generating new forecasts.
4.2 Regional Study
A regional study is carried out to test the performance of DA on a spatial domain. It uses data from the NAM forecasts and the analysis field over the state of Pennsylvania. With a spatial resolution of 12 km, 1225 grid cells make up this study region.
4.2.1 Impact of Different Types of Model Training
When generating forecasts for a single location, model training is straightforward because one NN is trained using data for that location. However, when generating forecasts for a spatial domain, there are different options on how to include the spatial information into the training.
Table 1 summarizes the series of NNs trained by using different sets of training data. For solar irradiance, one NN model is trained (Exp. 1 and 2) for predicting the entire region, but the training data can come from either a single grid cell (Exp. 1) or a subset of all grid cells (Exp. 2). The single grid cell used encompasses the SURFRAD station, and the sampled 100 grid cells are selected with a equal spacing across Pennsylvania.
For wind speed at surface and 80 m above ground (Exp. 3–8), the same configuration is used where one NN model is trained with the training data from either a single grid cell (Exp. 3 and 6) or a subset of all grid cells (Exp. 4 and 7). The third set of experiments (Exp. 5 and 8) train multiple NN models that predict for different parts of the study domain. First, the annual average wind speed at each grid cell is calculated. All grid cells are then binned with 0.5 m/s intervals. For each interval, a NN is trained using data from the grid cells belonging to the interval. Typically, 100 grid cells are randomly sampled within the same interval, but if fewer than 100 grid cells are available in an interval, all grid cells are used.
The spatial forecasts from the experiments listed in Table 1 are verified with RMSE, shown in Table 2. The test period is the year 2019, all days from 14:00 to 17:00 when model analysis is available. Verification of wind speed at 80 m above ground is carried out for strong wind cases (\(> 4\) m/s), which is the typical cut-off speed for wind turbines. To explain the notation, DA 1 @ 100 stands for DA that has 1 NN trained with data from 100 grid cells.
For solar irradiance, M- AnEn does not outperform NAM on a spatial domain, although the reversed has previously been shown in the local study (Fig. 3). Both AnEn and DA outperform NAM, but the best performance is given by DA 1 @ 100. This indicates that, for spatial forecast problems, the NN trained at one grid cell can still be limited ( DA 1 @ 1) compared to AnEn, but the problem can be solved by including data from other grid cells in the study domain so that the trained NN is exposed to different forecast-observation pairs in general, not only limited to a constrained location.
For wind speed at surface and 80 m above ground, M- AnEn again does not outperform NAM but AnEn shows consistent results on the two vertical levels by improving NAM by about 7.5%. However, if only trained at one location ( DA 1 @ 1), DA does not improve NAM predictions. Once the training data consist of a subset of all the grid cells ( DA 1 @ 100), DA becomes the most preferable options for predicting wind speed. This confirms the importance of having training data from across the study domain when generating spatial forecasts.
Finally, for surface wind speed, DA with multiple NNs ( DA 8 @ 408) slightly decreases the performance compared to DA with a single NN ( DA 1 @ 100). For 80-m wind speed, DA with multiple NNs ( DA 9 @ 408) has similar performance to DA with a single NN ( DA 1 @ 100). These results suggest that using more NNs might not be the most effective way to further squeeze out any performance of this type of network. This could be limited to the complex topography or the capability of an analog-based approach. A better way to encode spatial information into the similarity metric might be using more suited architecture like the convolutional neural network.
4.2.2 Spatial Error Patterns
The DA shows outperformance compared to AnEn on average. However, there could be a spatial variation in its performance across the study domain. Figure 9 visualizes the performance variation with the error distribution and geographic maps.

Distributions of prediction errors (a, c, e) and geographic maps comparing DA and AnEn (b, d, f). The verification period is 2019 daily from 2 to 5 PM to favor the daytime period and only large wind (\(> 4\) m/s) cases are verified. Predictions over water (upper-left in b, d, f) have been removed. In (a, c, e), the three hinges are, in turn, the first, second, and third quartiles; the whiskers extend from the hinge to the value at 1.5 * interquantile range of the hinge. Locations with an annual wind speed over 4 m/s are shown in (f) to highlight strong wind region. Training data sites are circled in black
Figure 9a shows the error distributions of solar irradiance forecasts, as measured by RMSE, in a violin plot from NAM, M- AnEn, AnEn, and two versions of DA ( DA 1 @ 1 and DA 1 @ 100). AnEn and DA typically have a better performance than NAM and M- AnEn with DA 1 @ 100 being the most accurate method, thanks to the increased training data from sampled grid cells. Figure 9b compares the RMSE of AnEn and DA on a geographic map, where green circles indicate DA outperforms AnEn. The most improvement of DA takes place at southeastern and central Pennsylvania, and some improvement is also observed at northwestern Pennsylvania close to Lake Erie. For the rest of the domain with smaller red circles, it indicates AnEn outperforms DA, but the difference is small (lower than 5% of the error of AnEn).
In terms of surface wind speed (Fig. 9c), the improvements from AnEn and DA are less prominent than those of solar irradiance, likely due to wind speed being a more dynamic variable. DA 1 @ 1 outperforms M- AnEn which indicates that NN has learned the relationship between forecasts and observations that is helpful for spatial forecasts. However, more training data can be used ( DA 1 @ 100) to further improve the efficacy of the trained NN. Figure 9d compares DA 1 @ 100 to AnEn in a geographic map, and the result shows a large part of the domain favoring DA over AnEn.
Similarly, Fig. 9e shows the error distributions of wind speed at 80 m above ground. It confirms that the same technique, adding training data from a number of grid cells, is effective for predicting mid-air level wind speed. Figure 9f compares DA to AnEn where the average wind speed at 80 m above ground is over 4 m/s. This region is suitable for wind power generation, and it includes mostly northern and southeastern Pennsylvania and a narrow band following the southwestern Allegheny Mountains. The comparison shows a large area with preference of DA over AnEn.
In summary, DA can be trained with data from multiple grid cells so that the NN learns the forecast–observation relationship helpful for spatial forecasts. This training technique has been found to be more effective than having multiple trained NNs, considering not only the higher prediction accuracy, but also the saved computation for training multiple NNs.
4.3 Comparison of Computation Scaling

Weight optimization runtime as a function of the number of predictors. The optimization is carried out for a single grid using 8 years of training and 1 year of validation
Both AnEn and DA require an optimization process prior to the generation of forecasts, but in vastly different forms. AnEn adopts a constrained exhaustive search that goes through with all possible weight combinations. A critical drawback of this approach is its poor scaling performance when more predictors are used. On the other hand, DA relies on a trained NN that transforms input predictors into latent features. These features can then be used with equal weight, when calculating distances in the latent space, because the relative importance of the input predictors have already been taken into consideration by the nonlinear transformation. This difference in the optimization process presents a huge computational benefit of DA.
Figure 10 compares the runtime needed by the two approaches for weight optimization as a function of the number of variables (predictors). Experiments are run on a compute node with an Intel Haswell Xeon CPUs (12 cores) for AnEn or on a GPU node for DA with an NVIDIA P100 GPU. The reason for using different architectures is that the DA and AnEn algorithms have different requirements. The implementation of the DA takes full advantage of the parallel GPU architecture, while AnEn requires traditional CPUs. Furthermore, while it is not possible to run AnEn on a GPU architecture, it is theoretically possible to run DA on a CPU architecture, but it would be tremendously slow. To optimize predictor weights for AnEn, weights are searched from zero to one with an increment of 0.1. Results shows a near-exponential, rather than exponential, growth as the number of predictors increases, because only the weight combination with a sum of one is put to trial. This sum-of-one restriction is commonly used to reduce the total number of weight combinations.
The DA, however, relies on backpropagation algorithms, like ADAM, to train the NN. Training time is less sensitive to the number of input predictors, but more sensitive to the size of the NN and the number of training samples, which remain constant throughout the analysis. This demonstrates a significant computational benefit because using more input predictors only marginal increases the training time. This key difference gives DA the ability to cope with big data with a large number of predictors.
The profiling experiments are limited to a maximum of seven predictors because the optimization time of AnEn scales poorly and it takes an astronomical amount of computation time to optimize weights for the 227 predictors (about \(10^{100}\) years). However, using the NN-based similarity metric, DA only needs few than 2 h for training the network. These estimations are made by extrapolating profiling results shown in Fig. 10.
5 Discussion and Conclusions
This work improves AnEn forecasts by introducing an NN-based similarity metric and RA for triplet forecast sampling. Specifically, weather analogs are no longer identified in the original forecast variable space, but in a transformed latent space generated by a trained NN. The main findings and contribution of this work are highlighted below:
-
1.
DA overcomes the computational limit posed by optimizing predictor weights for the conventional similarity metric (Delle Monache et al. 2013). More predictors can be used as input to DA to generate predictions with a higher accuracy.
-
2.
DA has been found to be more accurate in predicting hard-to-forecast cases compared to AnEn where only a few predictor variables can be used.
-
3.
DA has a higher level of tolerance to model updates when multiple years of data are included in the search repository, because NN learns the relationship on the basis of observations and forecasts variables are transformed to reflect the similarity in observations.
-
4.
Although AnEn works independently on each grid cell, DA can generate accurate forecasts for a spatial domain if trained with data from a subset of all grid cells.
Fanfarillo et al. (2021) previously proposed to use an encoder–decoder architecture for analog generation that saves computation and memory. They achieved a constant scaling in computation and memory when the size of the search repository increases. But yet the ML model was not able to outperform AnEn on average. This work, however, is able to show that DA outperforms AnEn. It suggests that the latent features generated by the trained NN help to identify better analogs than AnEn.
The key difference between this and the previous work is that auto-encoder, acting like a data compressor, seeks to represent the complex NWP model forecasts with fewer features. The goal is to reduce the number of variables and generate compact representation of weather forecasts. However, DA is different that it learns the similarity based on observation and tries to construct a transformation so that this similarity can be better reflected with forecasts. The goal is to find better analogs and produce more accurate forecast ensembles. The number of latent features that NN generates is less relevant. The proposed sampling and data-labeling technique, RA, ensure that NN learns the correct similarity based on observations so that better forecast analogs can be identified.
During model training, separate NNs are trained for solar irradiance and wind speed forecasts. It is possible to train only one NN that identifies analogs for both variables at the same time (e.g., identifying days with the most solar irradiance and wind speed at the same time). This would require creating a composite variable combining the normalized solar irradiance and wind speed to account for both. This approach has potential application to hybrid power plants where both solar and wind energy are harvested. Currently, this works focuses on predicting solar irradiance and wind speed as two independent predictands. Therefore, this composite approach will be beyond the scope of this work.
The benefit of DA will be increasingly prominent as the available computation, and data in Earth observations and atmospheric modeling are growing exponentially. The inclusion of a NN and the triplet network training contributes to a higher tolerance of model updates as the search repository grows. It ensures that DA can keep improving its prediction accuracy by relying on the recent advancement in modelling and high-performance computing communities.
Future research should be directed to the application of such a framework in extreme weather forecasting and forecasts over a large spatial domain. In this work, LSTM is used as the transformation network, but studies are highly encouraged to systematically evaluate the performance of different NNs, like the recurrent neural network and the gated recurrent unit, as the embedding network.
Availability of data and materials
The NAM forecasts and model analysis can be publicly accessed at https://www.ncei.noaa.gov/products/weather-climate-models/north-american-mesoscale. The SURFRAD dataset can be publicly accessed at https://gml.noaa.gov/aftp/data/.
Notes
Station coordinates can be accessed from https://www.esrl.noaa.gov/gmd/grad/surfrad/sitepage.html.
The update frequency is estimated from the changelogs from the official code base on GitHub at https://github.com/wrf-model/WRF.
References
Alessandrini S, Delle Monache L, Sperati S, Cervone G (2015a) An analog ensemble for short-term probabilistic solar power forecast. Appl Energy 157:95–110
Alessandrini S, Delle Monache L, Sperati S, Nissen JN (2015b) A novel application of an analog ensemble for short-term wind power forecasting. Renew Energy 76:768–781. https://doi.org/10.1016/j.renene.2014.11.061
Alessandrini S, Delle Monache L, Rozoff CM, Lewis WE (2018) Probabilistic prediction of tropical cyclone intensity with an analog ensemble. Mon Weather Rev 146(6):1723–1744. https://doi.org/10.1175/MWR-D-17-0314.1
Alessandrini S, Sperati S, Delle Monache L (2019) Improving the analog ensemble wind speed forecasts for rare events. Mon Weather Rev 147(7):2677–2692. https://doi.org/10.1175/MWR-D-19-0006.1
Augustine JA, DeLuisi JJ, Long CN (2000) SURFRAD: a national surface radiation budget network for atmospheric research. Bull Am Meteorol Soc 81(10):2341–2358
Augustine JA, Hodges GB, Cornwall CR, Michalsky JJ, Medina CI (2005) An update on SURFRAD: the GCOS surface radiation budget network for the continental United States. J Atmos Ocean Technol 22(10):1460–1472
Baldi P, Chauvin Y (1993) Neural networks for fingerprint recognition. Neural Comput 5(3):402–418. https://doi.org/10.1162/neco.1993.5.3.402
Bodini N, Hu W, Optis M, Cervone G, Alessandrini S (2021) Assessing boundary condition and parametric uncertainty in numerical-weather-prediction-modeled, long-term offshore wind speed through machine learning and analog ensemble. Wind Energy Sci Discuss 2021:1–22. https://doi.org/10.5194/wes-2021-33
Bosveld FC, Baas P, Beljaars A, Holtslag AA, de Arellano JVG, Van De Wiel BJ (2020) Fifty years of atmospheric boundary-layer research at Cabauw serving weather, air quality and climate. Boundary-Layer Meteorol 177(2):583–612
Bromley J, Guyon I, LeCun Y, Säckinger E, Shah R (1994) Signature Verification using a "Siamese" time delay neural network. In: Advances in neural information processing systems, pp 737–744
Cervone G, Clemente-Harding L, Alessandrini S, Delle Monache L (2017) Short-term photovoltaic power forecasting using artificial neural networks and an analog ensemble. Renew Energy 108:274–286. https://doi.org/10.1016/j.renene.2017.02.052
Chopra S, Hadsell R, LeCun Y (2005) Learning a similarity metric discriminatively, with application to face verification. In: 2005 IEEE computer society conference on computer vision and pattern recognition (CVPR’05), vol 1, pp 539–546. https://doi.org/10.1109/CVPR.2005.202
Chu Y, Coimbra CF (2017) Short-term probabilistic forecasts for direct normal irradiance. Renew Energy 101:526–536. https://doi.org/10.1016/j.renene.2016.09.012
Chung J, Gulcehre C, Cho K, Bengio Y (2014) Empirical evaluation of gated recurrent neural networks on sequence modeling. arXiv:1412.3555 [cs]
Clemente-Harding L (2019) Extension of the analog ensemble technique to the spatial domain. Ph.D. thesis, Pennsylvania State University, University Park, Pennsylvania
Delle Monache L, Eckel FA, Rife DL, Nagarajan B, Searight K (2013) Probabilistic weather prediction with an analog ensemble. Mon Weather Rev 141(10):3498–3516. https://doi.org/10.1175/MWR-D-12-00281.1
Delle Monache L, Alessandrini S, Djalalova I, Wilczak J, Knievel JC (2018) Air Quality Predictions with an Analog Ensemble. Atmos Chem Phys Discuss. https://doi.org/10.5194/acp-2017-1214
Dong X, Shen J (2018) Triplet loss in siamese network for object tracking. In: Proceedings of the European conference on computer vision (ECCV), pp 459–474
Dyer C (2014) Notes on noise contrastive estimation and negative sampling. arXiv:1410.8251
Eckel FA, Delle Monache L (2016) A hybrid nwp-analog ensemble. Mon Weather Rev 144(3):897–911
Fanfarillo A, Roozitalab B, Hu W, Cervone G (2021) Probabilistic forecasting using deep generative models. GeoInformatica 25(1):127–147
Fischereit J, Brown R, Larsén XG, Badger J, Hawkes G (2022) Review of mesoscale wind-farm parametrizations and their applications. Boundary-Layer Meteorol 182(2):175–224
For Environmental Prediction/National Weather Service/NOAA/US Department of Commerce EMCC (2015) Ncep North American Mesoscale (NAM) 12 km analysis. Res Data Arch at the Natl Cent for Atmos Res, Comput and Inf Syst
Frediani MEB, Hopson TM, Hacker JP, Anagnostou EN, Delle Monache L, Vandenberghe F (2017) Object-based analog forecasts for surface wind speed. Mon Weather Rev 145(12):5083–5102. https://doi.org/10.1175/MWR-D-17-0012.1
Gao M, Li J, Hong F, Long D (2019) Day-ahead power forecasting in a large-scale photovoltaic plant based on weather classification using LSTM. Energy 187(115):838. https://doi.org/10.1016/j.energy.2019.07.168
Gensler A, Henze J, Sick B, Raabe N (2016) Deep learning for solar power forecasting: an approach using AutoEncoder and LSTM neural networks. In: 2016 IEEE international conference on systems, man, and cybernetics (SMC), pp 002,858–002,865. https://doi.org/10.1109/SMC.2016.7844673
Gers FA, Schmidhuber J, Cummins F (2000) Learning to forget: continual prediction with LSTM. Neural Comput 12(10):2451–2471
Goldberg Y, Levy O (2014) word2vec explained: deriving Mikolov et al.’s negative-sampling word-embedding method. arXiv:1402.3722
Hamill TM (2001) Interpretation of rank histograms for verifying ensemble forecasts. Mon Weather Rev 129(3):550–560
Hamill TM, Whitaker JS (2006) Probabilistic quantitative precipitation forecasts based on reforecast analogs: theory and application. Mon Weather Rev 134(11):3209–3229
Hancock PJ (1994) An empirical comparison of selection methods in evolutionary algorithms. In: AISB workshop on evolutionary computing. Springer, pp 80–94
Herr HD, Krzysztofowicz R (2005) Generic probability distribution of rainfall in space: the bivariate model. J Hydrol 306(1):234–263. https://doi.org/10.1016/j.jhydrol.2004.09.011
Hochreiter S, Schmidhuber J (1997a) Long short-term memory. Neural Comput 9(8):1735–1780. https://doi.org/10.1162/neco.1997.9.8.1735
Hochreiter S, Schmidhuber J (1997b) Long short-term memory. Neural Comput 9(8):1735–1780
Hoffer E, Ailon N (2015) Deep metric learning using triplet network. In: Feragen A, Pelillo M, Loog M (eds) Similarity-based pattern recognition. Lecture notes in computer science. Springer, Cham, pp 84–92, https://doi.org/10.1007/978-3-319-24261-3_7
Hsu CC, Lin CW, Su WT, Cheung G (2019) Sigan: siamese generative adversarial network for identity-preserving face hallucination. IEEE Trans Image Process 28(12):6225–6236
Hu W, Cervone G (2019) Dynamically Optimized Unstructured Grid (DOUG) for analog ensemble of numerical weather predictions using evolutionary algorithms. Comput Geosci 133(104):299. https://doi.org/10.1016/j.cageo.2019.07.003
Hu W, Cervone G, Clemente-Harding L, Calovi M (2020) Parallel analog ensemble: the power of weatheranalogs. In: Proceedings of the 2020 improving scientific software conference. https://doi.org/10.5065/p2jj-9878
Hu W, Clemente L, Young GS, Cervone G (2021) Empirical inverse transform function for ensemble forecast calibration. NCAR technical notes NCAR/TN-567+ PROC, p 12. https://doi.org/10.26024/p6mv-en77
Junk C, Delle Monache L, Alessandrini S (2015a) Analog-based ensemble model output statistics. Mon Weather Rev 143(7):2909–2917. https://doi.org/10.1175/MWR-D-15-0095.1
Junk C, Delle Monache L, Alessandrini S, Cervone G, von Bremen L (2015b) Predictor-weighting strategies for probabilistic wind power forecasting with an analog ensemble. Meteorol Z 24(4):361–379. https://doi.org/10.1127/metz/2015/0659
Khodayar M, Teshnehlab M (2015) Robust deep neural network for wind speed prediction. In: 2015 4th Iranian Joint congress on fuzzy and intelligent systems (CFIS), pp 1–5. https://doi.org/10.1109/CFIS.2015.7391664
Massidda L, Marrocu M (2018) Quantile regression post-processing of weather forecast for short-term solar power probabilistic forecasting. Energies 11(7):1763
Monache LD, Alessandrini S, Djalalova I, Wilczak J, Knievel JC, Kumar R (2020) Improving air quality predictions over the united states with an analog ensemble. Weather Forecast 35(5):2145–2162. https://doi.org/10.1175/WAF-D-19-0148.1
Price J, Porson A, Lock A (2015) An observational case study of persistent fog and comparison with an ensemble forecast model. Boundary-Layer Meteorol 155(2):301–327
Qing X, Niu Y (2018) Hourly day-ahead solar irradiance prediction using weather forecasts by LSTM. Energy 148:461–468. https://doi.org/10.1016/j.energy.2018.01.177
Raftery AE, Gneiting T, Balabdaoui F, Polakowski M (2005) Using Bayesian model averaging to calibrate forecast ensembles. Mon Weather Rev 133(5):1155–1174. https://doi.org/10.1175/MWR2906.1
Scheuerer M, Hamill TM (2015) Statistical postprocessing of ensemble precipitation forecasts by fitting censored, shifted gamma distributions*. Mon Weather Rev 143(11):4578–4596. https://doi.org/10.1175/MWR-D-15-0061.1
Schroff F, Kalenichenko D, Philbin J (2015) FaceNet: a unified embedding for face recognition and clustering. In: Proceedings of the IEEE conference on computer vision and pattern recognition, pp 815–823
Shahriari M, Cervone G, Clemente-Harding L, Delle Monache L (2020) Using the analog ensemble method as a proxy measurement for wind power predictability. Renew Energy 146:789–801. https://doi.org/10.1016/j.renene.2019.06.132
Sperati S, Alessandrini S, Delle Monache L (2017) Gridded probabilistic weather forecasts with an analog ensemble: Gridded Probabilistic Forecasts with an Analog Ensemble. Q J R Meteorol Soc 143(708):2874–2885. https://doi.org/10.1002/qj.3137
Toth Z (1989) Long-range weather forecasting using an analog approach. J Clim 2(6):594–607. https://doi.org/10.1175/1520-0442(1989)002<0594:LRWFUA>2.0.CO;2
Vafaie H, Imam IF (1994) Feature selection methods: genetic algorithms vs. greedy-like search. In: Proceedings of the international conference on fuzzy and intelligent control systems, vol 51, p 28
van den Dool HM (1989) A new look at weather forecasting through analogues. Mon Weather Rev 117(10):2230–2247. https://doi.org/10.1175/1520-0493(1989)117<2230:ANLAWF>2.0.CO;2
Vanvyve E, Delle Monache L, Monaghan AJ, Pinto JO (2015) Wind resource estimates with an analog ensemble approach. Renew Energy 74:761–773. https://doi.org/10.1016/j.renene.2014.08.060
Venkatram A (1983) Uncertainty in predictions from air quality models. Boundary-Layer Meteorol 27(2):185–196
Wang QJ, Robertson DE, Chiew FHS (2009) A Bayesian joint probability modeling approach for seasonal forecasting of streamflows at multiple sites. Water Resour Res. https://doi.org/10.1029/2008WR007355
Wang P, Li S, et al. (2018) Incorporating gan for negative sampling in knowledge representation learning. arXiv:1809.11017
Whitley D (1994) A genetic algorithm tutorial. Stat Comput 4(2):65–85
Wilks DS (2009) Extending logistic regression to provide full-probability-distribution MOS forecasts. Meteorol Appl 16(3):361–368. https://doi.org/10.1002/met.134
Wilt CM, Thayer JT, Ruml W (2010) A comparison of greedy search algorithms. In: Third annual symposium on combinatorial search
Wu L, Seo DJ, Demargne J, Brown JD, Cong S, Schaake J (2011) Generation of ensemble precipitation forecast from single-valued quantitative precipitation forecast for hydrologic ensemble prediction. J Hydrol 399(3):281–298. https://doi.org/10.1016/j.jhydrol.2011.01.013
Wu H, Xu Z, Zhang J, Yan W, Ma X (2017) Face recognition based on convolution siamese networks. In: 2017 10th international congress on image and signal processing. BioMedical engineering and informatics (CISP-BMEI). IEEE, pp 1–5
Xiaoyun Q, Xiaoning K, Chao Z, Shuai J, Xiuda M (2016) Short-term prediction of wind power based on deep long short-term memory. In: 2016 IEEE PES Asia-pacific power and energy engineering conference (APPEEC), pp 1148–1152. https://doi.org/10.1109/APPEEC.2016.7779672
Xu K, Feng Y, Huang S, Zhao D (2015) Semantic relation classification via convolutional neural networks with simple negative sampling. arXiv:1506.07650
Funding
This work was supported by the National Science Foundation [Grant Numbers #1639707] and the Institute for Computational and Data Sciences at the Pennsylvania State University.
Author information
Authors and Affiliations
Contributions
Weiming Hu and Guido Cervone wrote the main manuscript text and performed the experiments and analysis. George Young and Luca Delle Monache contributed to the formulation of the proposed methodology and the design of experiments and verification. All authors reviewed the manuscript.
Corresponding author
Ethics declarations
Ethical Approval
We confirm that this work is original and has not been published elsewhere, nor is it currently under consideration for publication elsewhere. All authors have given consent for publication. The corresponding author confirms on behalf of all authors that there have been no involvements that might raise the question of bias in the work reported or in the conclusions, implications, or opinions stated.
Competing interests
The authors declare no known competing interests or conflicts that would influence the work reported in this research.
Additional information
Publisher's Note
Springer Nature remains neutral with regard to jurisdictional claims in published maps and institutional affiliations.
Rights and permissions
Open Access This article is licensed under a Creative Commons Attribution 4.0 International License, which permits use, sharing, adaptation, distribution and reproduction in any medium or format, as long as you give appropriate credit to the original author(s) and the source, provide a link to the Creative Commons licence, and indicate if changes were made. The images or other third party material in this article are included in the article’s Creative Commons licence, unless indicated otherwise in a credit line to the material. If material is not included in the article’s Creative Commons licence and your intended use is not permitted by statutory regulation or exceeds the permitted use, you will need to obtain permission directly from the copyright holder. To view a copy of this licence, visit http://creativecommons.org/licenses/by/4.0/.
About this article

Cite this article
Hu, W., Cervone, G., Young, G. et al. Machine Learning Weather Analogs for Near-Surface Variables. Boundary-Layer Meteorol 186, 711–735 (2023). https://doi.org/10.1007/s10546-022-00779-6
Received:
Accepted:
Published:
Issue Date:
DOI: https://doi.org/10.1007/s10546-022-00779-6