
Abstract
Advances in immunology and immune therapies require knowledge of antigenic peptide sequences that are presented on MHC class II and class I molecules of antigen presenting cells. The most specialized antigen presenting cells are dendritic cells (DCs). In the past, the small number of DCs that could be isolated from mouse spleen prevented direct analysis of the MHC II peptide repertoire presented by DCs. Here we describe a protocol that integrates immunological methods (in vivo enrichment of mouse spleen DCs by Flt3L treatment and immunoprecipitation of MHC II-peptide complexes), mass spectrometry analysis and peptide synthesis (LC-MS/MS and quantitation analysis for non tryptic peptides) to identify and quantitate the endogenous peptides that are bound to MHC II molecules on DCs. The described method produces quantitative data that are reproducible and reliable enough to cover a wide range of peptide copy numbers. We propose the application of this method in future studies to quantitatively investigate the MHC II repertoire on DCs presented during viral infections or different immunizations in vaccine development research.
1 Introduction
Major histocompatibility complex class II (MHC II) molecules are expressed on the surface of antigen-presenting cells, such as dendritic cells (DCs) and display short bound peptide fragments derived from self- and nonself antigens. These peptide-MHC complexes function to maintain immunological tolerance in the case of self-antigens and to initiate CD4+ T cell-mediated adaptive immunity in the case of foreign proteins [1, 2].
Here we report in great detail the application of mass spectrometry (MS) analysis to identify MHC II peptides derived from endogenous proteins expressed in freshly isolated murine splenic DCs [3]. In the past, limited numbers of DCs in vivo have restricted their use for proteomic studies, but now the number of splenic DCs can be expanded in vivo by treatment with Flt3L [4–6], which is a regulator of hematopoietic cell development [7, 8]. In addition, rapid advances in mass spectrometry (MS) instrumentation and computational technologies have made it feasible to detect candidate peptides in a complex biological sample with high sensitivity [9]. MS-based strategies for the precise measurements of peptides have been exploited to quantitatively determine the absolute expression levels of a given protein or post-translationally modified protein [10]. These strategies may vary depending on the MS platforms, but they all rely on the introduction of isotope-labeled heavy peptides, which precisely mimics their endogenous counterparts. Synthetic standard peptides with incorporated 13C, 14N, or both are used as internal standards, which are introduced at a known concentration in order to quantify the corresponding endogenous counterparts [3, 9, 10]. With the method presented here, starting with about 5 × 10⁸ splenic DCs, we were able to identify a repertoire of hundreds of MHC II peptides from endogenous proteins localized in all cell compartments [3]. Using synthetic isotope-labeled peptides, in a single experiment, we detected peptides in a wide range of concentration spanning from 2.5 fmol/μL to 12 pmol/μL [3].
This method, as outlined in Fig. 14.1, sets a foundation for future MS based peptide analysis to quantitatively investigate the MHC II repertoire on DCs generated under viral infections or, in vaccine development studies, during different immunization conditions.

A schematic diagram summarizing the steps performed to identify peptides presented by MHC II molecules on DCs, from sample preparation to peptide identification and quantitation by LC-MS/MS analysis
2 Materials
We do not add sodium azide to any reagents. Carefully follow all waste disposal regulations when disposing waste materials.
2.1 Cell Culture
Prepare all solutions for cell culture with culture grade reagents and store media and other biological reagents at 4 °C.
-
1.
Balb/c × C57BL/6 (I−Ab,d/Ed) F1 mice, maintained under specific pathogen-free conditions and used at 6–8 weeks of age.
-
2.
Melanoma cells expressing Fms-like tyrosine kinase 3 ligand (Flt3L) [11] cultured with Dulbecco’s modified Eagle medium (DMEM) containing 10 % heat-inactivated fetal bovine serum (FBS).
-
3.
Anti-CD11c magnetic beads and MACS LS columns (Miltenyi Biotec).
-
4.
Phosphate buffered saline (PBS): 137 mM NaCl, 2.7 mM KCl, 10 mM Na2HPO4, 2 mM KH2PO4, pH 7.4.
-
5.
Anti-MHC class II hybridoma cells (clone N22) [12], maintained in DMEM medium with 2 mM l-glutamine, 5 % heat-inactivated FBS.
2.2 Generation of Affinity Column
-
1.
CNBr Sepharose beads (GE Healthcare).
-
2.
Coupling buffer (CB): 0.5 M NaCl, 0.1 M NaHCO3, pH 8.3.
-
3.
Activating buffer: 1 mM HCl.
-
4.
Glycine solution: 0.2 M glycine, pH 8.0.
-
5.
Poly-prep columns (Bio-Rad).
-
6.
Affinity-purified N22 antibody from culture supernatants using Protein G Sepharose beads as per manufacturer’s instructions.
2.3 Affinity Purification of MHC II Molecules
-
1.
Cell lysis buffer: 20 mM Tris–HCl pH 8, 1 % 3-[(3-cholamidopropyl)dimethylammonio]-1-propanesulfonate (CHAPS), 5 mM ethylenediaminetetraacetic acid (EDTA), 10 μg/mL aprotinin, 10 μg/mL leupeptin, 10 μg/mL pepstatin, 0.1 mM iodoacetamide, 1 mM phenylmethanesulfonylfluoride (PMSF) (all kept at −20 °C) (see Note 1).
-
2.
Washing buffer 1: 250 mM NaCl, 50 mM Tris–HCl pH 8.
-
3.
Washing buffer 2: 50 mM Tris–HCl, pH 8.
-
4.
10 % glacial acetic acid.
2.4 Western Blot
-
1.
Mini PROTEAN Tetra Cell with Mini Trans-Blot module (Bio-Rad).
-
2.
PowerPac Basic power supply (Bio-Rad).
-
3.
10 % sodium dodecyl sulfate polyacrylamide gel electrophoresis (SDS-PAGE) gel, 10 mL per two 1 mm-gels: 4.8 mL H2O, 2.5 mL 1.5 M Tris–HCl pH 8, 2.5 mL 40 % Acrylamide/Bis 37.5:1, 100 μL 10 % SDS, 50 μL 10 % APS, 7 μL TEMED.
-
4.
4× SDS protein sample buffer: 40 % glycerol, 240 mM Tris/HCl pH 6.8, 8 % SDS 0.04 % bromophenol blue, 5 % beta-mercaptoethanol.
-
5.
Prestained protein standards (Bio-Rad).
-
6.
10× Running buffer: 0.25 M Tris base, 1.92 M glycine, 1 % SDS, pH 8.3.
-
7.
Polyvinylidene difluoride (PVDF) transfer membrane.
-
8.
Transfer N-cyclohexyl-3-aminopropanesulfonic acid (CAPS) buffer: 10 mM CAPS, 10 % Methanol, pH 11.
-
9.
Tris buffered saline + tween (TBST) washing buffer: 20 mM Tris–HCl, 137 mM NaCl, 0.2 % Tween20, pH 8.
-
10.
Blocking solution: 5 % skim milk in TBST.
-
11.
Anti-mouse IA antibody (clone KL295) [13].
-
12.
Anti-mouse IgG1 HRP-conjugated antibody (SouthernBiotech).
-
13.
Enhanced chemiluminescence (ECL) Plus Western Blotting Detection kit.
-
14.
BioMax XAR Film (Kodak).
-
15.
SRX-101A processor and IS-199 X-ray developer/fixer Auto mixer (Konica).
2.5 Solid Phase Extraction (SPE)
Store all SPE buffers at 4 °C.
-
1.
SPE Equilibration buffer: 0.1 % (V/V) trifluoroacetic Acid (TFA) in high performance liquid chromatography (HPLC) grade water up to 1 L. Store at 4 °C.
-
2.
SPE Washing buffer: 50 % (V/V) HPLC grade acetonitrile in HPLC grade water up to 1 L. Store at 4 °C.
-
3.
SPE Elution buffer: 0.1 % TFA in 50 % HPLC grade acetonitrile in HPLC grade water up to 1 L. Store at 4 °C.
-
4.
10 kDa cutoff membrane filter (Sartorius Stedim, Aubagne, France).
-
5.
C-18 cartridge (Waters, Milford, MA).
2.6 LC/MS/MS Analysis
Prepare all solutions for MS analysis using HPLC grade water and other analytical reagents. Store all chemical reagents at room temperature.
-
1.
Aqueous mobile phase A: 0.1 % formic acid in water up to 1 L (Solvent A).
-
2.
Organic mobile phase B: 0.1 % formic acid in acetonitrile up to 1 L (Solvent B).
-
3.
Ultimate 3000 nano-HPLC (ThermoFisher, Sunnyvale, CA).
-
4.
LTQ-Orbitrap (ThermoFisher, San Jose, CA).
-
5.
Bioworks Software (ThermoFisher, San Jose, CA).
-
6.
PepMap trap column (100 Å, 5 μm, 800 μm × 2 mm, Dionex, Sunnyvale, CA).
-
7.
Acclaim Pepmap 100 C18 analytical column (100 Å, 3 μm, 75 μm × 15 cm, Dionex, Sunnyvale, CA).
-
8.
Mascot software (Matrix Science, Boston, MA).
3 Methods
3.1 In Vivo DC Expansion
-
1.
Inject 5 × 10⁶ Flt3L B16 cells subcutaneously into the abdomen region of mice. After 15–20 days, all major splenic DC subsets had expanded >10-fold in agreement with previous reports [4, 14].
3.2 DC Prep
-
1.
Remove Flt3L-treated spleens, cut in small fragments, and digest into single cell-suspensions with 400 U/mL collagenase D (Roche Applied Science) for 25 min at 37 °C.
-
2.
Purify CD11c+ DCs by positive selection using anti-CD11c magnetic beads and MACS columns as per manufacturer’s instructions.
-
3.
Wash DCs three times with PBS by pelletting cells for 5 min at 500 × g.
3.3 Generation of Affinity Columns
-
1.
To begin coupling of CNBr Sepharose beads (adapted from ref. 15), measure the OD of the antibody solution at 280 nm by using a quartz cuvette and a spectrophotometer with UV.
-
2.
Use 40 mg of Sepharose per mg of antibody based on 1 OD280 = 0.7 mg/mL antibody.
-
3.
Take up Sepharose in 1 mM HCl for 30 min (rotate).
-
4.
Centrifuge and discard supernatant.
-
5.
Add purified N22 monoclonal antibody, 15 mg (see Note 2) to coupling buffer (adjust concentration to give 2–3 mg of antibody/mL of coupling buffer; measure OD280 before start).
-
6.
Incubate for 60 min on a rotator.
-
7.
Measure the OD280 to determine coupling efficiency (see Note 3) and incubate longer if necessary.
-
8.
Centrifuge and discard the supernatant.
-
9.
Incubate for 30 min with glycine solution on rotator.
-
10.
Centrifuge and discard the supernatant.
-
11.
Wash the beads twice with PBS and transfer them to a poly-prep column (see Note 4).
-
12.
Store the finished column at 4 °C in PBS and use it within 24–48 h.
3.4 Affinity Purification of MHC II Molecules
-
1.
Lyse cells with cell lysis buffer (108/mL) for 45–60 min at 4 °C on a rotator.
-
2.
Clear cell lysate by 20 min centrifugation at 21,000 × g and transfer cleared lysate into a fresh tube.
-
3.
Incubate cleared lysate with N22 antibody-conjugated CNBr Sepharose beads (see Note 5), overnight at 4 °C on rotator.
-
4.
Spin down beads at 50 × g for 2 min.
-
5.
Remove and save the flow through (see Note 6).
-
6.
Wash beads six times with washing buffer 1 (6 mL/wash).
-
7.
Wash beads six times with washing buffer 2 (6 mL/wash).
-
8.
Elute MHC II-peptides complexes from beads with 1 mL of 10 % glacial acetic acid, 3 min at room temperature (RT) on rotator. Then, spin down for 3 min at 50 × g and recover elution fraction E1.
-
9.
Repeat acid elution an additional four times: collect elution fractions E2, E3, E4, E5.
-
10.
Boil each elution fraction for 10 min at 70 °C, then store at −20 °C.
3.5 Western Blot to Evaluate Yield of Immunoprecipitated MHC II-Peptide Complexes
General: detailed instructions for SDS-PAGE are provided in ref. 16.
-
1.
Mix 5 μL aliquot of each elution fraction from step 10 of Subheading 3.4 with 7.5 μL 4× SDS sample buffer; add 1 M triethylammonium bicarbonate (TEAB), to neutralize very acidic pH (<3), up to 30 μL volume/lane (see Note 7).
-
2.
Heat samples to 100 °C for 4–5 min. Do not boil too long, proteins get destroyed/degraded.
-
3.
Run on 10 % SDS-PAGE, under reducing condition, ~2 h at 30 mA, constant current, until the dye front reaches the bottom of the gel.
General: detailed instructions for blotting under wet conditions are found in ref. 17.
-
1.
Pre-wet PVDF membrane in methanol (5 min is sufficient) and then in transfer buffer. Pre-wet sponge and filter paper in transfer buffer.
-
2.
Assemble transfer components included in the Mini Trans-Blot module (as per manufacturer’s instructions): the gel and membrane are sandwiched between sponge and paper (sponge/paper/gel/membrane/paper/sponge) and all are clamped tightly together after ensuring no air bubbles have formed between the gel and membrane.
-
3.
Submerge sandwich in transfer buffer: place the gel/filter sandwich in the holder such that the proteins will migrate from the gel to the membrane, in the direction of the positive (red) electrode (anode).
-
4.
Apply electrophoresis to PVDF membrane for 2 h at 300 mA, constant current.
-
5.
Block PVDF membrane with blocking solution for 1 h at RT.
-
6.
Blot membrane with anti-mouse I-A primary antibody, clone KL295 (1:1,000 dilution in blocking solution) and incubate on rotator for 1 h 30 min at RT or overnight at 4 °C.
-
7.
Wash six times for 10 min each in ~30 mL of TBST.
-
8.
Add a secondary anti-mouse IgG1 HRP-conjugated antibody (1:10,000 dilution in blocking solution) and incubate on rotator for 1 h 30 min at RT.
-
9.
Wash as in step 7.
-
10.
Detect immunoreactive protein bands with ECL Plus Western Blotting Detection Kit. Add 2 mL of ECL solution onto the membrane and wait for 5 min. Drain ECL solution, wrap in plastic.
-
11.
Place the blot into an autoradiography cassette, and expose to film (in a dark room) for 5 s to 2 min depending on the signal. Insert film in film processor according to manufacturer’s instructions (see Fig. 14.2).
Fig. 14.2 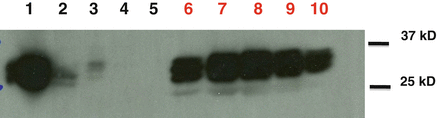
Western blot analysis of immunoaffinity purified MHC II-peptide complexes. A cell lysate made of Flt3L DCs was first immunoprecipitated for class II molecules on N22 antibody-CNBr Sepharose beads. (1) Cell lysate, as 0.3 % input, and (2) flow through from beads, 15 μL/lane. (3–5) Serial washes with Tris–HCl pH 8/250 mM NaCl (3, 4), Tris–HCl pH 8 (5), 15 μL/lane. (6–10) Acid eluted MHC II-complexes, E1–E5 fractions, 5 μL/lane. Membrane was immunoblotted with anti-IA antibody (KL295 sup, 1:1,000) and with an anti-mouse IgG1 HRP-conjugated (1:10,000) as secondary antibody

3.6 MHC Peptides Purification and Concentration
-
1.
Pipette acid-extracted MHC peptide mixture into a 10 kDa cutoff membrane filter.
-
2.
Centrifuge filter at 3,000 × g for 15 min.
-
3.
Collect the flow-through from the filter.
-
4.
Wash C-18 cartridge (Waters, Milford, MA) with 1 mL 50 % acetonitrile in water and discard the flow-through. Repeat this three times.
-
5.
Equilibrate the C-18 cartridge with 1 mL 0.1 % TFA in water, and discard the flow-through. Repeat this four times.
-
6.
Load the peptides mixture from membrane filter to the C-18 cartridge and adjust the vacuum so the flow is very slow (see Note 8).
-
7.
Wash the C-18 cartridge with 1 mL 0.1 % TFA in water and discard the flow-through. Repeat this three times.
-
8.
Elute the peptides by adding 500 μL of 0.1 % TFA in 50 % acetonitrile and keep the flow-through. Repeat this two times, and combine all the flow-throughs.
-
9.
Speed-vac the eluate to dryness (5–7 μL).
-
10.
Prior to MS analysis, reconstitute dried peptides by adding 20 μL 0.1 % TFA in water.
3.7 LC/MS/MS Analysis
-
1.
Load the peptide mixture onto a Pepmap trap column at a flow rate of 30 μL/mL running with aqueous mobile phase A using a Dionex Ultimate 3000 nanoHPLC coupled with LTQ-Orbitrap for LC/MS/MS analysis. After 5 min of loading and washing, switch the trap column online with the analytical Acclaim Pepmap 100 C18 column running at 250 nL/min.
-
2.
Separate the peptide mixture with a shallow gradient: 0–55 % organic solvent B in 120 min, followed by 25 min gradient from 55 to 80 % organic solvent B. Organic solvent B is maintained at 80 % for another 10 min and then decreased to 0 % in 10 min. Re-equilibrate the column at 0 % mobile phase B for another 10 min. The flow rate was maintained at 250 nL/min.
-
3.
Operate the LTQ-Orbitrap in the data-dependent acquisition mode with a MS full scan (620–1,200 m/z; 30,000 resolution) followed by six data dependent MS/MS scans in the ion trap at 35 % normalized collision energy (see Note 9).
-
4.
Use the following dynamic exclusion parameters, to maximize acquisition of data from more components in a complex peptide mixture: Repeat count = 1; Repeat duration = 30 s; Exclusion list = 100: and Exclusion time = 90 s.
3.8 Database Searching
-
1.
In order to prepare the database search with MASCOT, the Raw data files from LTQ-Orbitrap need to be converted to a single combined DTA file. Open the RAW data file in Bioworks software (ThermoFisher, San Jose, CA) and run the DTA extraction tool. Finally combine all the extracted DTA files to a single DTA file.
-
2.
Search Peptides against IPI (International Protein Index) mouse database on the converted DTA file by using MASCOT software. The following search parameters are used in all MASCOT searches: the digestion enzyme is set as none and methionine oxidation as the variable modification. The maximum error tolerance for MS scans is 10 ppm for MS and 1.0 Da for MS/MS respectively.
-
3.
Manually inspect MS/MS spectra to confirm that the major fragmented ions match the identified peptide sequences (see Note 10).
-
4.
Compare MS/MS spectra of eluted natural peptides with the MS/MS spectra obtained from the corresponding synthetic (isotopically labeled) counterparts, as shown in Fig. 14.3 (see Note 11).
Fig. 14.3 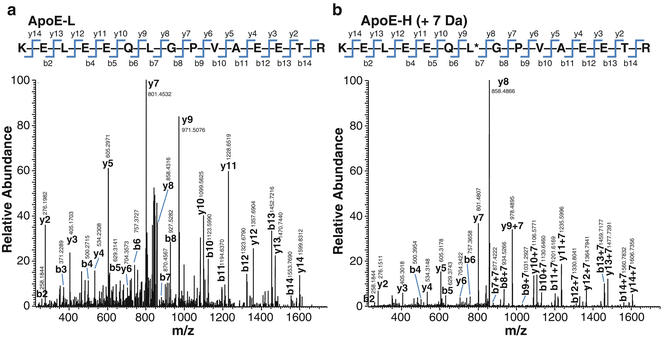
Identification of a representative MHC class II-associated peptide derived from DCs. Comparison of MS/MS spectra of naturally eluted apolipoprotein E (APOE) peptide (a), identified using MASCOT software in a representative DC sample, with MS/MS spectra of the matching synthetic isotope-labeled APOE peptide (b). The corresponding y and b series are marked

3.9 MHC II Peptide Quantitation
-
1.
Mix 10 μL peptide mixture with 10 μL isotope labeled peptides dissolved in 50 % acetonitrile/0.1 % TFA in water.
-
2.
Load the peptides mixture onto a nano LC-LTQ Orbitrap (the LTQ-Orbitrap is operated in full scan mode with a mass resolution of 30,000). The MS settings are identical to the ones indicated in the experimental step 3 of Subheading 3.7.
-
3.
Compare the peak intensity of the native peptides and isotope labeled peptides as a function of m/z values.
-
4.
Determine the amount of the native peptides based on the ratio of peak intensities of the native peptides and isotope labeled peptides and the exact amount of isotope labeled peptides spiked in the peptides (see Note 12). As an example, Fig. 14.4 illustrates the intensity’s comparison of an endogenous MHC II peptide and its synthetic isotope labeled counterpart at m/z 864.4469 and m/z 867.9954, respectively. Using the ratio of the intensity observed in the spectra (100 vs. 93.24 %), and the known quantity of isotopically labeled peptide spiked into the sample (0.4 ng/10 μL sample), the quantity of the endogenous peptide can be extrapolated. Thus, our calculation results in 100/93.24 × 0.4 ng of standard/10 μL sample × 2 = total 0.858 ng of endogenous peptide/20 μL sample.
Fig. 14.4 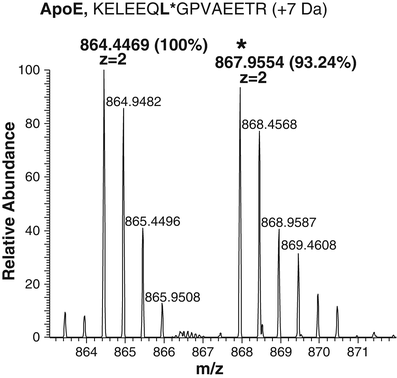
Quantitation analysis by LC-MS of selected MHC II endogenous peptides. Synthetic isotope-labeled peptides (0.8 ng) were spiked into a representative DC sample. Quantitation of the endogenous counterpart was obtained comparing peaks’ intensity of the selected peptide pair. The heavy isotope peak is indicated with asterisk. MS profile of the APO E peptide pair identified in the MHC II peptide mixture eluted from one representative DC sample. Isotopic patterns of the ions were consistent with the predicted patterns based on the isotopic ratios. Mass shift of the isotope-labeled peptide is consistent with the predicted value

4 Notes
-
1.
Alternatively, replace protease inhibitors with Mini Protease Inhibitor Tablet (Roche Applied Science) and add iodoacetamide and PMSF as above.
-
2.
For optimal preparation, the antibody is dialyzed overnight against 0.5–1 L of 0.1 M NaHCO3, pH 8.3/0.5 M NaCl buffer using dialysis tubing. Change the buffer once after 2–4 h. Recover antibody and store at 4 °C.
-
3.
The efficiency of antibody coupling to CNBr Sepharose beads is determined by measuring protein concentration in the supernatant obtained from the coupling reaction (Subheading 3.3, step 6). The protein remaining in these supernatant fractions represents antibody that was not immobilized on beads. The efficiency of conjugation can be estimated by:
-
(a)
Percentage bound = 100 [(total mg antibody added) − (mg antibody in supernatant)]/(total mg antibody added).
-
(b)
Efficiencies less than 70 % indicate that very inefficient antibody immobilization has occurred. The cause of poor coupling is often the presence of traces of buffer components (free amines in Tris–HCl buffer) that competes with primary amines of the antibody for binding at the active sites of the CNBr activated Sepharose beads.
-
(a)
-
4.
Rinse the beads with several bed volumes of PBS. Monitor the level of liquid in the reservoir and do not allow the beads to become dry. Discard rinse.
-
5.
Alternatively, protein G-Sepharose beads (~1 mL volume), previously washed with PBS are saturated with 15 mg of N22 antibody, 2 h binding at RT or overnight at 4 °C on rotator. Then the lysate is incubated with N22-saturated protein G beads, overnight at 4 °C on rotator.
-
6.
We recommend that cell lysates and flow through not be frozen or stored in order to not compromise peptide recovery. Optionally, the flow through from the anti-MHC II antibody column can be loaded on a serial MHC class I antibody column in order to immunoprecipitate MHC I-peptide complexes.
-
7.
For Western blot sample preparation, 5 μL aliquots of acid extracted MHC-peptide proteins are diluted to the final volume of 30 μL/lane with 1 M triethylammonium bicarbonate (TEAB) to neutralize very acidic pH (<3). The rest of samples, which are constituted of Tris–HCl pH 8 buffer, can be diluted safely in PBS.
-
8.
Alternately, let material flow through the C-18 cartridge by gravity.
-
9.
This means that the most intense six masses from each full mass spectrum with doubly and triply charged states are selected for fragmentation by collision-induced dissociation in the linear ion-trap. The 35 % normalized collision energy ensures that the optimum MS/MS data are automatically collected, independently on the mass of the analyte. This is particularly relevant when analyzing mixture where peptides have masses that range from below 600 Da to over 2,000 Da.
-
10.
For peptides with Mascot scores of 20–30, we recommend manually inspecting their MS/MS spectra to confirm that the major fragmented ions matched the identified peptide sequences.
-
11.
To unambiguously confirm peptide identification, we recommend comparison of MS/MS spectra of natural eluted peptides, identified by MASCOT software in DC samples, with MS/MS spectra of the matching synthetic (isotopically labeled) peptides. The identical fragmentation patterns obtained in the MS/MS spectra confirm the identity of the peptide sequence between the native peptide and the synthetic isotopically labeled counterpart.
-
12.
The absolute quantification is determined by comparing the peak intensity of the native peptide with the peak intensity of heavy peptide added at 0.8 ng. The actual copy numbers of MHC II-bound peptides from DCs were calculated as follows: (a) moles of native peptide determined by quantitation analysis = g/MW; (b) Molecules of native peptide = moles (from step 1) × 6.022 × 1023/mol; (c) Molecules of native peptide per cell = molecules (from step 2)/number of cells used per quantitation analysis.
References
Banchereau J, Steinman RM (1998) Dendritic cells and the control of immunity. Nature 392:245–252
Mellman I, Steinman RM (2001) Dendritic cells: specialized and regulated antigen processing machines. Cell 106:255–258
Bozzacco L, Yu H, Zebroski HA et al (2011) Mass spectrometry analysis and quantitation of peptides presented on the MHC II molecules of mouse spleen dendritic cells. J Proteome Res 10:5016–5030
Bozzacco L, Trumpfheller C, Huang Y et al (2010) HIV gag protein is efficiently cross-presented when targeted with an antibody towards the DEC-205 receptor in Flt3 ligand-mobilized murine DC. Eur J Immunol 40:36–46
Maraskovsky E, Brasel K, Teepe M et al (1996) Dramatic increase in the numbers of functionally mature dendritic cells in Flt3 ligand-treated mice: multiple dendritic cell subpopulations identified. J Exp Med 184:1953–1962
O'Keeffe M, Hochrein H, Vremec D et al (2002) Effects of administration of progenipoietin 1, Flt-3 ligand, granulocyte colony-stimulating factor, and pegylated granulocyte–macrophage colony-stimulating factor on dendritic cell subsets in mice. Blood 99:2122–2130
Curti A, Fogli M, Ratta M et al (2001) Stem cell factor and FLT3-Ligand are strictly required to sustain the long-term expansion of primitive CD34(+)DR(−) dendritic cell precursors. J Immunol 166:848–854
D'Amico A, Wu L (2003) The early progenitors of mouse dendritic cells and plasmacytoid predendritic cells are within the bone marrow hemopoietic precursors expressing Flt3. J Exp Med 198:293–303
Bozzacco L, Yu H, Dengjel J et al (2012) Strategy for identifying dendritic cell-processed CD4+ T cell epitopes from HIV gag p24 peptides. PloS one (in press)
Gerber SA, Rush J, Stemman O et al (2003) Absolute quantification of proteins and phosphoproteins from cell lysates by tandem MS. Proc Natl Acad Sci U S A 100:6940–6945
Dranoff G, Jaffee E, Lazenby A et al (1993) Vaccination with irradiated tumor cells engineered to secrete murine granulocyte–macrophage colony-stimulating factor stimulates potent, specific, and long-lasting anti-tumor immunity. Proc Natl Acad Sci U S A 90:3539–3543
Metlay JP, Witmer-Pack MD, Agger R et al (1990) The distinct leukocyte integrins of mouse spleen dendritic cells as identified with new hamster monoclonal antibodies. J Exp Med 171:1753–1771
Kang Y-S, Yamazaki S, Iyoda T et al (2003) SIGN-R1, a novel C-type lectin expressed by marginal zone macrophages in spleen, mediates uptake of the polysaccharide dextran. Int Immunol 15:177–186
Pulendran B, Lingappa J, Kennedy MK et al (1997) Developmental pathways of dendritic cells in vivo: distinct function, phenotype, and localization of dendritic cell subsets in FLT3 ligand-treated mice. J Immunol 159:2222–2231
Shelver WL (2005) Immunochemical protocols. In: Burns R (ed) Methods in molecular biology. Humana Press, Totowa, NJ
Hames BD, Rickwood D (1998) Gel electrophoresis of proteins: a practical approach. Oxford University Press, Oxford
Bolt MW, Mahoney PA (1997) High-efficiency blotting of proteins of diverse sizes following sodium dodecyl sulfate-polyacrylamide, gel elecrophoresis. Anal Biochem 247:185–192
Acknowledgments
We thank Dr. Svetlana Mojsov, the Rockefeller University, New York and Dr. Jörn Dengjel, University of Freiburg, Freiburg, for critical discussion and analytical tools. We are grateful to Marguerite Nulty for help with the references. This work was supported by grants from National Institute of Allergy and Infectious Diseases (NIAID), AI13013, 081677, and AI051573 to Ralph M. Steinman.
Author information
Authors and Affiliations
Editor information
Editors and Affiliations
Rights and permissions
Copyright information
© 2013 Springer Science+Business Media, LLC
About this protocol
Cite this protocol
Bozzacco, L., Yu, H. (2013). Identification and Quantitation of MHC Class II-Bound Peptides from Mouse Spleen Dendritic Cells by Immunoprecipitation and Mass Spectrometry Analysis. In: Fulton, K., Twine, S. (eds) Immunoproteomics. Methods in Molecular Biology, vol 1061. Humana Press, Totowa, NJ. https://doi.org/10.1007/978-1-62703-589-7_14
Download citation
DOI: https://doi.org/10.1007/978-1-62703-589-7_14
Published:
Publisher Name: Humana Press, Totowa, NJ
Print ISBN: 978-1-62703-588-0
Online ISBN: 978-1-62703-589-7
eBook Packages: Springer Protocols