
Abstract
Nitric oxide (NO) is now well established as a signalling molecule in plants, regulating various physiological processes ranging from development to responses to pathogens and changes in the physical environment. Various methods for the detection of NO in plant tissue have been described, and all of these methods have serious limitations that impact their utility for accurate detection of NO in plant tissues. Despite such limitations, both difluorofluorescein diacetate and oxyhemoglobin present convenient and relatively easy approaches for measuring NO in plant tissue and their utility can be enhanced by including appropriate controls to address some of the limitations that these two methods have. This chapter provides methods for measuring or detecting NO production in plant tissue using either difluorofluorescein diacetate or oxyhemoglobin.
1 Introduction
Endogenously synthesized NO serves as a vital signalling molecule that regulates various plant physiological processes [1–3]. Some of the signalling functions of NO are transduced via NO-dependent induction of cyclic guanosine monophosphate (cGMP) biosynthesis by NO-responsive guanylate cyclases [4–6]. Because of its importance in the regulation of plant physiology, various methods have been developed for the detection and quantification of NO in plant tissue [7]. Diaminofluorescein fluorescent dyes have been used extensively for detecting NO in plant tissues, whereas an oxyhemoglobin-based assay, which presents a fairly sensitive and inexpensive method for NO detection, remains rather underutilized in plant science research.
The relative ease, low cost, and sensitivity of the two methods, together with their reproducibility and requirement of only a few specialized pieces of equipment that can be used for various other purposes, make 4-amino-5-methylamino-2,7-difluorofluorescein diacetate (DAF-FM DA) (which we refer to simply as difluorofluorescein diacetate) and oxyhemoglobin the preferred reagents in methods for measuring plant NO content in many laboratories. Furthermore, DAF-FM DA is more photo-stable and less sensitive to pH variations than other diaminofluorescein fluorescent dyes used for NO detection in plants. We have used the two methods successfully for various plant tissue types ranging from roots [8] to root nodules [9].
2 Materials
DAF-FM DA must be stored desiccated at −20 °C, at which the solution is stable for up to a year. Solutions of catalase and superoxide dismutase must be stored at 4 °C where they are stable for at least 6 months. Hemoglobin must be stored at 4 °C and freshly prepared just before use.
2.1 Reagents and Equipment for the DAF-FM DA Method
-
1.
DAF-FM DA loading buffer: 10 mM 3-(N-Morpholino)propanesulfonic acid sodium salt (MOPS sodium salt), pH 7.0, 10 μM 4-amino-5-methylamino-2,7-difluorofluorescein diacetate (DAF-FM DA). This must be prepared fresh every day of use and kept in the dark.
-
2.
DAF-FM DA wash buffer: 10 mM 3-(N-Morpholino)propanesulfonic acid sodium salt (MOPS sodium salt), pH 7.0.
-
3.
Standard microscope slides and coverslips.
-
4.
Confocal laser scanning microscope (e.g., we use the Zeiss Axiovert 200 M LSM 510 META confocal microscope).
-
5.
Vibratome (e.g., we use the Leica VT1200 S vibrating blade microtome).
-
6.
Software for analyzing pixel intensity (e.g., AlphaEase FC imaging software, Alpha Innotech Corporation).
2.2 Reagents and Equipment for the Oxyhemoglobin Method
-
1.
Hemoglobin (we use lyophilized hemoglobin from bovine blood).
-
2.
Catalase (we use catalase from Corynebacterium glutamicum, supplied as a suspension at ∼500,000 Units/mL.
-
3.
Superoxide dismutase (e.g., superoxide dismutase from bovine liver supplied as a suspension at 2,000–6,000 Units/mg protein).
-
4.
Sodium hyposulfite (Na2S2O4).
-
5.
Sephadex G-25 beads.
-
6.
Potassium phosphate buffer, pH 7.4 (50 mM): Mix 40.1 mL of K2HPO4 with 9.9 mL of KH2PO4 and make up the volume to 1 L with distilled H2O. Check that the pH is 7.4, otherwise adjust it to 7.4 using 0.5 M KOH or concentrated HCl.
-
7.
Extraction buffer: 0.1 M sodium acetate, 1 M NaCl, 1 % (w/v) ascorbate, pH 6.0. Adjust pH with acetic acid and NaOH.
-
8.
Spectrophotometer capable of kinetic readings at wavelengths between 401 and 421 nm.
3 Methods
All procedures are carried out at room temperature unless specified otherwise.
3.1 Detection of Nitric Oxide in Plant Tissue Using Difluorofluorescein Diacetate
-
1.
Obtain fresh tissue (e.g., leaves, roots, etc.) using tweezers and scalpel blades to make sections of the plant tissue.
-
2.
Use quick-setting superglue to secure the plant tissue onto the sectioning platform of the vibratome (Note that thin leaves do not need to be sectioned on a vibratome and would in fact not be suitable to attachment to the vibratome’s sectioning platform with superglue, hence these leaves can be stained directly with DAF-FM diacetate without sectioning).
-
3.
Once the superglue is dry, apply a few drops of DAF-FM DA wash buffer onto the plant tissue to prevent it from drying.
-
4.
Section the plant tissue to produce 100–200 μm sections using the vibratome (normally, standard razor blades perform well for the sectioning on the vibratome).
-
5.
Transfer the tissue sections to DAF-FM DA loading buffer (1 mL loading buffer in 1.5 mL microcentrifuge tubes for small sections or 10 mL loading buffer in Petri dishes for large sections that would not fit into 1.5 mL microcentrifuge tubes) (see Note 1).
-
6.
Incubate these samples at room temperature in the dark for 30 min.
-
7.
Remove the DAF-FM DA loading buffer from the tissue and add an equal volume of DAF-FM DA wash buffer and incubate the samples in the dark for 10 min to wash off unbound DAF-FM DA.
-
8.
Repeat the washing step once more, and then transfer the tissue section onto a microscope slide.
-
9.
Add a few drops of DAF-FM DA wash buffer to the sample on the slide just sufficient to cover the sample and to prevent bubbles when a coverslip is placed onto the specimen, and then place a coverslip on the specimen.
-
10.
Set-up the confocal laser scanning microscope such that the excitation wavelength from the argon laser is 480–490 nm and emission is 520–530 nm.
-
11.
Collect green fluorescence (as a result of reaction of DAF-FM-2T with NO) images and analyze green pixel intensities using appropriate image analysis software (Fig. 1).
Fig. 1 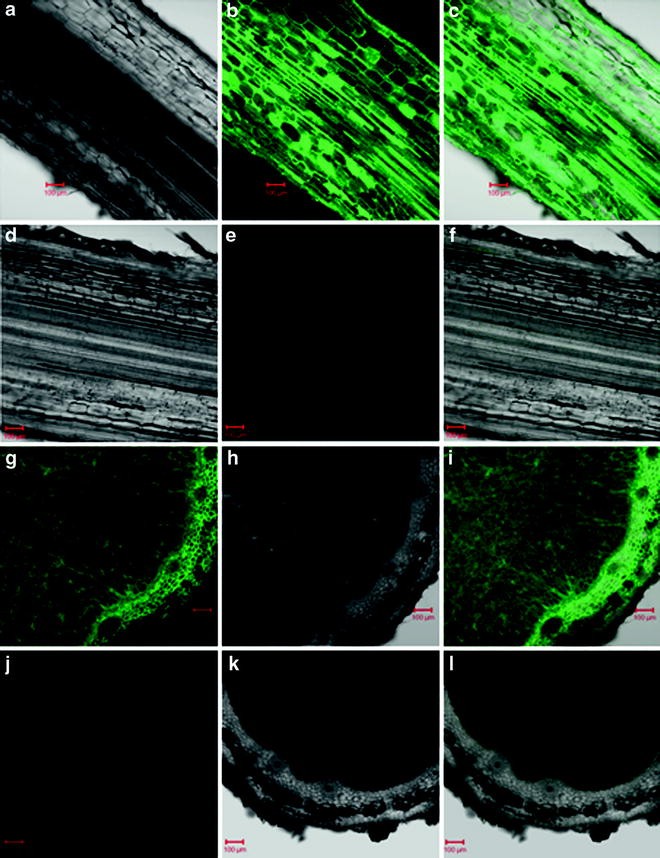
Typical results obtained for NO detection using DAF-FM DA in maize roots [(a)–(e), see ref. 8] and soybean root nodules [(g)–(l), see ref. 9)]. (a), (d), (h), and (k) are bright-field images; (b), (e), (g), and (j) are fluorescence images, whereas (c), (f), (i), and (l) are overlay images of the bright-field and fluorescence images. (d), (e), and (f) represent the control in which no DAF-FM DA was added (DAF-FM DA loading buffer lacking DAF-FM DA), whereas (j), (k), and (l) represent controls where 1 mM L-NNA was added before addition of the DAF-FM DA loading buffer

3.2 Measurement of Plant Nitric Oxide Content Using the Oxyhemoglobin Method
-
1.
Add 5 g of Sephadex G-25 beads to 25 mL of potassium phosphate buffer in a 100 mL beaker and allow the matrix to swell overnight at 4 °C.
-
2.
Carefully transfer the matrix into a chromatography column and let the liquid flow through until only just enough liquid is left in the column to just cover the matrix.
-
3.
Wash the matrix twice with 4 mL of potassium phosphate buffer.
-
4.
Gently dissolve 25 mg of hemoglobin in 1 mL of 50 mM potassium phosphate buffer in a 100 mL bottle.
-
5.
Add 1.5 mg of sodium hyposulfite and mix the solutions. Continue adding the sodium hyposulfite until the solution turns dark purple (maximum 2.5 mg of sodium hyposulfite).
-
6.
Aerate the solution by blowing air into the solution using a 2–5 mL pipette for 5 min, and then incubate the solution at room temperature for 30 min (at this stage the solution should turn from dark purple to light red, indicating conversion from methemoglobin to oxyhemoglobin).
-
7.
Transfer the oxyhemoglobin into the Sephadex column to desalt and purify the oxyhemoglobin.
-
8.
Collect 4–5 fractions (200–250 μL each) of the oxyhemoglobin onto Eppendorf/microcentrifuge tubes by passing the solution through the column.
-
9.
Dilute the fractions 20-fold and determine the absorbance of each fraction at 415 nm. The fraction containing oxyhemoglobin will be the one with the highest absorbance at 415 nm.
-
10.
Calculate the concentration of the oxyhemoglobin fraction by using the extinction coefficient of 131 mM−1 cm−1 for oxyhemoglobin at 415 nm.
-
11.
Obtain tissue extracts by grinding 100 mg of plant tissue into a fine powder in liquid nitrogen and transferring the powder into 300 μL of Extraction Buffer in a microcentrifuge tube.
-
12.
After vortexing the mixture for 30 s, spin the sample for 20 min at 10,000 × g.
-
13.
Transfer the supernatant to a clean tube and add 200 Units of catalase and 200 Units of superoxide dismutase (see Note 2).
-
14.
Mix the sample by mild vortexing for 10 s and incubate the reaction for 10 min.
-
15.
Add freshly prepared oxyhemoglobin to a final concentration of 10 μM. Mix by gentle vortexing for 10 s.
-
16.
Incubate the reaction at room temperature for 10 min.
-
17.
Measure absorbance of the reaction mixture at 401 and 421 nm, and then calculate NO concentration by subtracting the absorbance at 421 nm from the absorbance at 401 nm, and then dividing the difference by 77 mM−1 cm−1 (Fig. 2) (see Note 3).
Fig. 2 
Typical results obtained for NO detection using the oxyhemoglobin methods in maize roots (see ref. 8). DETA/NO is a nitric oxide donor, whereas DETA is a control for DETA/NO as it is chemically analogous to DETA/NO but lacks the NO group, and thus DETA does not release NO

4 Notes
-
1.
It is important that appropriate controls for DAF-FM DA staining are included in the experiment to ensure that the fluorescence detected is a result of reaction of NO with the fluorophore. This is most effectively done by pretreating the tissue sections (for 15 min) with the NO scavenger 2-(4-carboxyphenyl)-4,4,5,5-tetramethylimidazoline-l-oxyl-3-oxide (carboxyPTIO) at a final concentration of 400 μM or, in cases where nitric oxide synthase-like activity is thought to be the source of the NO, pretreating the tissue sections (for 30 min) with the nitric oxide synthase inhibitor N-ω-nitro-l-arginine (L-NNA) at a final concentration of 1 mM before adding the DAF-FM DA loading buffer.
-
2.
Catalase and superoxide dismutase are added to prevent the reaction of O2 − and H2O2 with NO, which would interfere with accurate measurement of NO content.
-
3.
The calculation yields NO content as nM, which can be translated to nmol/g−1 of tissue fresh weight (calculated back to the 100 mg used in the assay) or nmol/mg−1 of protein content in the tissue (predetermined from the amount of tissue used, based on a Bradford assay performed on the tissue).
References
Baudouin E (2011) The language of nitric oxide signalling. Plant Biol 13:233–242
Besson-Bard A, Pugin A, Wendehenne D (2008) New insights into nitric oxide signalling in plants. Ann Rev Plant Biol 59:21–39
Corpas FJ, Barroso JB, Carreras A, Quiros M, Leon AM et al (2004) Cellular and subcellular localization of endogenous nitric oxide in young and senescent pea plants. Plant Physiol 136:2722–2733
Bai X, Todd CD, Desikan R, Yang Y, Hu X (2012) N-3-oxo-decanoyl-l-homoserine-lactone activates auxin-induced adventitious root formation via hydrogen peroxide- and nitric oxide-dependent cyclic GMP signaling in mung bean. Plant Physiol 158:725–736
Wilson ID, Neill SJ, Hancock JT (2008) Nitric oxide synthesis and signalling in plants. Plant Cell Environ 31:622–631
Ederli L, Meier S, Borgogni A, Reale L, Ferranti F, Gehring C, Pasqualini S (2008) cGMP in ozone and NO dependent responses. Plant Signal Behav 3:36–37
Mur LA, Mandon J, Cristescu SM, Harren FJ, Prats C (2011) Methods of nitric oxide detection in plants: a commentary. Plant Sci 181:509–519
Keyster M, Klein A, Ludidi N (2012) Caspase-like enzymatic activity and the ascorbate-glutathione cycle participate in salt tolerance of maize conferred by exogenously applied nitric oxide. Plant Signal Behav 6:349–360
Keyster M, Klein A, Ludidi N (2010) Endogenous NO levels regulate nodule functioning: potential role of cGMP in nodule functioning? Plant Signal Behav 5:1679–1681
Author information
Authors and Affiliations
Editor information
Editors and Affiliations
Rights and permissions
Copyright information
© 2013 Springer Science+Business Media New York
About this protocol
Cite this protocol
Ludidi, N. (2013). Measurement of Nitric Oxide in Plant Tissue Using Difluorofluorescein and Oxyhemoglobin. In: Gehring, C. (eds) Cyclic Nucleotide Signaling in Plants. Methods in Molecular Biology, vol 1016. Humana Press, Totowa, NJ. https://doi.org/10.1007/978-1-62703-441-8_18
Download citation
DOI: https://doi.org/10.1007/978-1-62703-441-8_18
Published:
Publisher Name: Humana Press, Totowa, NJ
Print ISBN: 978-1-62703-440-1
Online ISBN: 978-1-62703-441-8
eBook Packages: Springer Protocols