
Abstract
Interest in the investigation of mitochondrial dysfunction has seen a resurgence over recent years due to the implication of such dysfunction in both drug-induced toxicity and a variety of disease states. Here, we describe a methodology to assist in such investigations whereby the oxygen consumption of isolated mitochondria is assessed in a high-throughput fashion using a phosphorescent oxygen-sensitive probe, standard microtitre plates, and plate reader detection. The protocols provided describe the required isolation procedures, initial assay optimization, and subsequent compound screening. Typical data is also provided illustrating the expected activity levels as well as recommended plate maps and data analysis approaches.
1 Introduction
Mitochondrial dysfunction is a common mechanism of drug-induced toxicity and has been implicated with a variety of drug classes (1, 2). This has led to a requirement for a high-throughput method of assessing the metabolic implications of drug treatment. Oxygen consumption measurements are favored in this regard as they provide direct information on the activity of oxidative phosporylation and are therefore highly sensitive to perturbations in mitochondrial function. Such measurements allow the identification of compounds that specifically perturb mitochondrial function while also providing information on the mechanisms involved; electron transport chain (ETC), ATPase, and adenine-nucleotide translocator (ANT) inhibitors, for example, will cause a decrease in ADP-activated respiration while uncouplers cause as an increase in basal respiration. Traditionally, these measurements were performed using standard polarography; however, limited throughput precludes such an approach to this type of application. The necessary throughput is instead achieved using a phosphorescent water-soluble oxygen probe (MitoXpress™) thereby allowing 96- and even 384-well plate-based analysis of mitochondrial oxygen consumption (3, 4). Probe emission is quenched by molecular oxygen via a physical (collisional) mechanism; whereby depletion of dissolved oxygen causes an increase in probe emission. Measuring this signal, therefore, allows the quantification of dissolved oxygen, with changes in probe signal reflecting changes in oxygen concentration within the sample. Successful analysis requires rates of oxygen consumption which exceed the rates of back diffusion from ambient air. For this reason, a sealing layer of mineral oil is applied to limit such back diffusion, thereby increasing assay sensitivity. Detailed protocols are presented describing mitochondrial isolation from relevant tissues and typical activity values are provided. Assay optimization is also addressed and suggestions are provided on how to perform compound screening and on the recommended approach to data interpretation.
2 Materials
2.1 Mitochondrial Isolation
-
1.
Glass tissue homogenizer with Teflon pestle (100 ml).
-
2.
Glass beakers.
-
3.
Glass stirring rods.
-
4.
Plastic funnel.
-
5.
Centrifuge tubes (50 ml).
-
6.
Power drill (hand held or static).
-
7.
Ultra-Turrax tissue homogenizer (IKA, T25).
-
8.
Cheesecloth.
-
9.
Refrigerated high-speed centrifuge.
-
10.
Several ice buckets.
-
11.
BCA kit for protein determination.
-
12.
Eppendorf tubes.
-
13.
Standard clear bottom 96-well plate.
-
14.
Automated Pipettes: Gilson P20, P200, and P1000.
-
15.
Eppendorf syringe dispenser with 2.5-ml plastic syringes.
-
16.
Absorbance plate reader.
-
17.
UV reader such as SpectraMax, Tecan, Victor, FLUOstar Omega.
-
18.
Triton X-100.
-
19.
Type XXIV protease.
2.1.1 Isolation of Liver Mitochondria
Prepare the following buffers (see Note 1.1):
-
1.
Buffer I: 210 mM mannitol, 70 mM sucrose, 5 mM HEPES, 1 mM EGTA, 0.5% BSA, pH 7.4.
-
2.
Buffer II: 210 mM mannitol, 70 mM sucrose, 10 mM MgCl2, 5 mM K2HPO4, 10 mM MOPS, 1 mM EGTA, pH 7.4.
2.1.2 Isolation of Cardiac and Skeletal Muscle Mitochondria
Prepare the following buffers (see Note 1.1):
-
1.
Buffer I: 100 mM KCl, 40 mM Tris–HCl, 10 mM Tris-base, 5 mM MgCl2, 1 mM EDTA, and 1 mM ATP, pH 7.4.
-
2.
Buffer II: 100 mM KCl, 40 mM Tris–HCl, 10 mM Tris-base, 1 mM MgSO4, 0.1 mM EDTA, 0.2 mM ATP, and 2% BSA, pH 7.4.
-
3.
Buffer III: 100 mM KCl, 40 mM Tris–HCl, 10 mM Tris-base, 1 mM MgSO4, 0.1 mM EDTA, and 0.2 mM ATP, pH 7.4.
-
4.
Buffer IV: 220 mM mannitol, 70 mM sucrose, 10 mM Tris–HCl, and 1 mM EGTA, pH 7.4.
2.2 Assay Optimization (see Note 1.1)
-
1.
Isolated mitochondria of known concentration.
-
2.
Ice (for storage of isolated mitochondria).
-
3.
Glutamate/malate: 0.5/0.5 M in H2O, pH 7.4, aliquot and store at −20°C.
-
4.
Sodium succinate: 1 M in H2O, pH 7.4, aliquot and store at −20°C.
-
5.
Adenosine 5′-diphosphate (ADP): 100 mM in H2O, aliquot and store at −20°C.
-
6.
“Respiration Buffer”: 250 mM sucrose, 15 mM KCl, 1 mM EGTA, 5 mM MgCl2, 30 mM K2HPO4, pH 7.4.
-
7.
MitoXpress™ Probe (Luxcel Biosciences).
-
8.
Heavy mineral oil (VWR, IC15013880).
-
9.
Black body clear bottom 96-well plate (Costar 3631 or equivalent).
-
10.
Automated pipettes: Gilson P20, P200, and P1000.
-
11.
8- or 12-channel 100-μl pipette.
-
12.
Gilson Distriman® pipette with 1,250-μl cartridges.
-
13.
Multio-BlokR heater.
-
14.
2 ml clear Eppendorf tubes.
-
15.
Water bath, 30°C (for warming solutions).
-
16.
Time-resolved fluorescence plate reader with temperature control and kinetic analysis software.
2.3 Screening
Materials as listed in Subheading 2.1 plus:
-
1.
PCR plates for compound dilutions.
2.4 Data Analysis
-
1.
Plate reader software [Magellan (Tecan), MARS (BMG Labtech), WorkOut (PerkinElmer), SoftMax Pro (Molecular Devices)].
-
2.
Data Processing Software (MS Excel, Microcal Origin, GraphPad prism).
3 Methods
The most critical aspect of functional mitochondrial measurements such as those outlined here is the quality of the mitochondria preparation used. Quality control of the mitochondrial preparation is therefore of critical importance such that variations in source tissue or possible batch-to-batch variability can be accounted for prior to the assessment of effector action. It is also critically important that the preparation be well coupled. This is determined from the respiratory control ratio (RCR); the ratio of ADP-stimulated to basal respiration (state 3/state 2).
Screening for compounds with a mitochondrial liability can be carried out on a variety of substrate combinations, the most common of which are glutamate/malate, and succinate feeding complex 1 and complex 2 of the ETC, respectively. If heart mitochondria are used, fatty acids can be used as substrates, also. Respiration can then be assessed in basal (state 2) or ADP-stimulated (state 3) conditions with inhibitor screening generally performed in state 3 and uncoupler screening performed in state 2. As the resultant oxygen consumption rate is dependent on both substrate and ADP availability, it is necessary to establish the optimum protein concentration for such screening.
3.1 Mitochondrial Isolation
3.1.1 Isolation of Liver Mitochondria
-
1.
Euthanize animals with an overdose of carbon dioxide (see Note 1.2), excise organs rapidly, and place in ice-cold Buffer I.
-
2.
Using a pair of scissors, finely mince approximately 6 g of liver tissue and then wash repeatedly in Buffer I until the homogenate is blood-free. Then add five volumes of Buffer I and homogenize using 6–8 passes of a smooth glass grinder with Teflon pestle driven by a power drill on low speed.
-
3.
Adjust to 8 volumes with Buffer I and centrifuge at 700 × g at 4°C for 10 min, then filter through two layers of cheesecloth and recentrifuge for 10 min at 14,000 × g to precipitate the mitochondrial fraction.
-
4.
Discard the supernatant, using a glass stirring rod, resuspend the mitochondrial pellet in 20 ml of isolation buffer I, and recentrifuge at 10,000 × g for 10 min at 4°C.
-
5.
Repeat this wash step in Buffer II.
-
6.
Resuspend the resultant mitochondrial pellet in 0.7 ml of Buffer II and store on ice until required (see Note 1.3).
-
7.
Determine protein concentration using a BCA kit as per manufacturer’s instructions, briefly.
-
8.
Construct a standard curve using Albumin stock solutions at 1.5, 1.0, 0.75, 0.5, 0.25, 0.125, 0.025, and 0 mg/ml prepared in 1% v/v Triton X (see Note 1.4).
-
9.
Dilute samples of the mitochondrial preparation 1:60, 1:80, and 1:100, using 1% v/v Triton X as dilute.
-
10.
Mix 9.8-ml protein reagent A with 200-μl protein reagent B to produce the developing reagent. Then add 20 μl of each standard or sample into a 96-well plate followed by 200 μl of developing reagent.
-
11.
Incubate the plate for 30 min at 37°C, then read absorbance at 520 nm and calculate mitochondrial protein concentration (see Note 1.3).
3.1.2 Isolation of Cardiac and Skeletal Muscle Mitochondria
-
1.
Euthanize animals with an overdose of carbon dioxide (see Note 1.2), excise either two rat hearts or 10 g of mixed muscle (EDL/gastrocnemius/soleus), and place in ice-cold Buffer I.
-
2.
Add Type XXIV protease to a concentration of 5 mg/g of wet tissue and mince finely using a pair of scissors. Incubate for 7 min intermittently mixing and mincing, then add an equal volume of Buffer I to terminate the digestion.
-
3.
Using an Ultra-Turrax tissue homogenizer (IKA, T25) set at setting 1 (11,000 rpm) homogenize the resultant mixture for 30 s and then centrifuge the homogenate at 4°C for 10 min at 700 × g.
-
4.
Filter the supernatant through two layers of cheesecloth and recentrifuge at 14,000 × g for 10 min at 4°C.
-
5.
Discard the supernatant, and using a glass stirring rod resuspend the mitochondrial pellet in Buffer II, then centrifuge at 7,000 × g for 10 min at 4°C.
-
6.
Discard the supernatant, using a glass stirring rod, resuspend the mitochondrial pellet in 20 ml of Buffer III, then centrifuge at 3,500 × g for 10 min at 4°C. Then resuspend the mitochondrial pellet in a minimal volume of solution IV for further use (see Note 1.3).
-
7.
Protein concentrations should be determined as described in step 8 of the preceding protocol.
3.2 Oxygen Consumption Analysis: Assay Optimization
-
1.
Reconstitute MitoXpress™ probe in 1 ml of respiration buffer mixing to insure resuspension. Then dilute to 10 ml with the same buffer and warm to 30°C (see Note 2.1).
-
2.
Set instrument temperature to 30°C and allow sufficient time for target temperature to be reached. Prepare a kinetic protocol using the recommended optical settings (see Table 1) reading test wells at 0.5–1.5 min intervals over 30–60 min (see Note 2.2).
Table 1 Summary of recommended instrument setting for common fluorescence plate readers -
3.
Warm mineral oil to 30°C.
-
4.
For state 2 respiration (Basal), add 150 μl of substrate stock solution (succinate or glutamate/malate) to 1.35 ml of incubation buffer and warm to 30°C.
-
5.
For state 3 respiration (ADP-stimulated), add 150 μl of substrate stock and 100 μl ADP stock to 1.25 ml of incubation buffer and warm to 30°C.
-
6.
Using respiration buffer, prepare a six-point mitochondrial protein dilution series to a 1.5-ml total volume for each concentration. Recommended concentrations (mg/ml): 1.5, 1.0, 0.5, 0.25, 0.125, and 0.63.
-
7.
Place a clear bottomed, 96-well plate on a plate heater equilibrated to 30°C and, using automatic or multichannel pipette, dispense solutions as per the recommended plate map (Fig. 1) adding the following to each well:
Fig. 1. 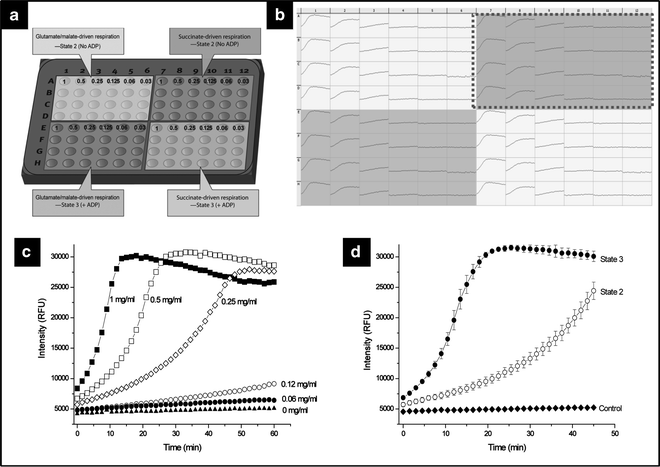
Assay optimization. (a) Typical plate layout for the initial optimization of liver mitochondrial protein concentration needed for screening of NCEs. Typical data output is presented in (b) as a MARS plate view (BMG Labtech) showing a serial dilution of mitochondrial protein at the indicated concentrations (mg/ml) measuring both glutamate/malate (left ) and succinate (right ) driven respiration in both basal (state 2, top) and ADP-stimulated (state 3, bottom). State 2 succinate-driven respiration profiles are presented in detail in (c) and the effect of ADP addition on succinate-driven respiration is presented in (d). If cardiac mitochondria are used, the same plate layout can be used to optimize the protein amount for respiration using fatty acids.
-
(a)
100 μl of assay buffer containing MitoXpress™ probe.
-
(b)
50 μl of mitochondrial stock dilutions giving the desired mitochondria concentration.
-
(c)
50 μl of substrate solution (final concentration 25 mM for succinate or 12.5/12.5 mM glutamate/malate) for basal respiration.
-
(d)
50 μl of substrate/ADP solution (final concentration 25 mM for succinate, 12.5/12.5 for mM glutamate/malate, 1.65 mM for ADP) for ADP-stimulated respiration.
-
(a)
-
8.
Using a syringe dispenser, add 100 μl of prewarmed heavy mineral oil to each well (see Note 3).
-
9.
Insert the microplate into the fluorescence plate reader and read using the settings outlined above. When measurement is completed, remove the plate and save the data to file.

3.3 Oxygen Consumption Analysis: Screening
-
1.
Reconstitute MitoXpress™ probe in 1 ml of assay buffer mixing to insure resuspension. Then dilute to 10 ml with the same buffer and warm to 30°C.
-
2.
Set instrument temperature to 30°C and allow sufficient time for target temperature to be reached. Prepare a kinetic protocol using the recommended optical settings (see Table 1) reading test wells at 0.5–1.5 min intervals over 30–60 min.
-
3.
Prepare compounds in DMSO to 100× the required concentration (see Note 2.4):
-
(a)
For initial screening assay at a single concentration (typically 100 nmol/mg) in duplicate as per plate map (Fig. 2).
Fig. 2. 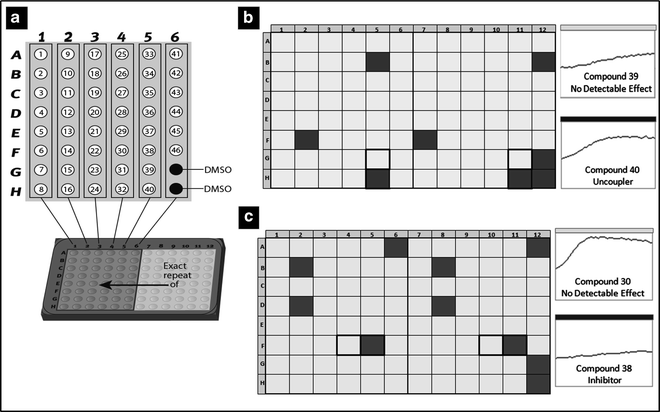
Single dose screening. 46 NCEs can be screened in duplicate on one plate using the plate layout presented in (a). Two vehicle controls (DMSO) are included on the left site of the plate, whereas on the right site of the plate, one would include FCCP [for state 2, (b)] or rotenone [for state 3, (c)], as positive controls giving the maximum uncoupling or inhibition. Typically, compounds showing more than 50% change from control values are flagged and taken forward into dose–response analysis.
-
(b)
For subsequent mechanistic elucidations and dose–response analysis 1:2 dilution seria are prepared for each compound at one data point per individual concentration as per plate map (Fig. 3).
Fig. 3. 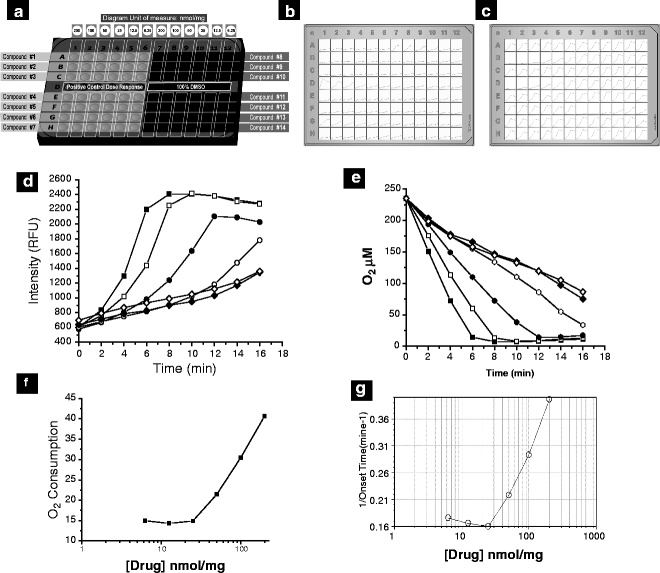
Dose–response analysis. Typical plate layout for generation for NCE dose–response curves. 14 compounds can be screened at six different concentrations (200, 100, 50, 25, 12.5, and 6.25 nmol/mg protein) using the plate map presented (a). Typical data output for uncouplers and inhibitors are shown in (b) and (c), respectively (Tecan Magellan plate views). For state 2 analysis, an FCCP dose–response is included in H1–H6 and for state 3 respiration, a nefazodone dose–response is included. A vehicle control is included in D7–12. Raw data are analyzed and UC50/IC50 values generated. Sample uncoupler raw data (A7–12), transformed data, and the resultant dose–response curve are presented in (d), (e), and (f), respectively. (g) Dose–response curve (SoftMax Pro, Molecular Devices) generated using the more basic time-to-threshold data analysis approach available on most plate readers (see Note 2.6).
-
(a)
-
4.
Prewarm mineral oil to 30°C.
-
5.
Prepare substrate stocks and prewarm reagents to 30°C.
-
(a)
State 2 analysis (uncoupler screening): Mix 5.4 ml of incubation buffer and 600 μl of either succinate or glutamate/malate stock.
-
(b)
State 3 analysis (inhibitor screening): Mix 5 ml of incubation buffer and 600 μl of either succinate or glutamate/malate stock 400 μl of ADP.
-
(a)


-
6.
Prepare 6 ml of stock mitochondria at 4× the required protein concentration (optimized above).
-
7.
Place a black 96-well plate on a plate heater equilibrated to 30°C and dispense the following solutions using either an appropriate automatic or multichannel pipette (see Note 2.3):
-
(a)
100 μl of prewarmed assay buffer.
-
(b)
1 μl of compound at desired concentration, according to the appropriate plate map.
-
(c)
50 μl of mitochondria at optimal dilution.
-
(d)
50 μl of prewarmed substrate stock solution to each well.
-
(e)
100 μl of prewarmed heavy mineral oil.
-
(a)
-
8.
Place the microplate in a fluorescence reader preset as described above and commence reading. When completed, save data to file.
3.4 Data Analysis
3.4.1 General Approach
-
1.
Standard analysis: The standard data analysis approach entails calculating “slope” values from plots of raw intensity or lifetime versus time using standard linear regression (Fig. 1). This can be performed on the software of most readers [MARS (BMG Labtech); Workout (PerkinElmer); Magellan™ (Tecan); SoftMax Pro (Molecular Devices)], or on packages such as MS Excel.
-
2.
Detailed analysis: For quantitative analysis, linearize the probe profiles using the following co-ordinate scale (5):
-
(a)
Abscissa, Y: I 0/(I 0 − I t ) – where I 0 and I t represent fluorescence signals at time 0 and t
-
(b)
Ordinate, X: 1/t, min−1
-
(c)
Exclude zero time points
Then apply linear regression analysis to the transformed profiles and determine the reciprocal slope for each of the transformed profiles (see Note 2.5).
-
(a)
-
3.
High-throughput analysis: Data analysis for large data sets is best performed using one of the following two approaches (see Note 2.6): The first is to convert probe signal to an oxygen scale and subsequently apply linear regression analysis to the transformed profiles (Fig. 3d–f ). Oxygen conversion can be approximated by normalizing profiles (dividing each value in the profile but the first value) and using the following equation: \( [{{\text{O}}_2}](t) = 235 \times 1 \times \,{(}S - X{)}/(X(S - 1)), \)
where S is the signal increase on deoxygenations. For a more detailed analysis, see Note 2.6 and supplemental material I.
The second involves using a “time-to-threshold” value calculated using plate reader software and relating the reciprocal of this value to drug concentration to generate dose–response information. This can be performed on most plate reader software (Fig. 3g).
3.4.2 Assay Optimization
-
1.
Open the saved file and either analyze on plate reader software (preferable) or export to external software package such as MS Excel. Then plot raw intensity or lifetime versus time (Fig. 1).
-
2.
Using the quantitative data analysis approach outlined above calculate an RCR and compare to expected values to insure the mitochondrial preparation is of sufficient quality (see Note 2.7). RCR is calculated by determining the state 3/state 2 ratio using reciprocal slopes.
-
3.
If this value is sufficiently high, examine individual profiles and select mitochondrial protein concentration that produce reliably measurable signal changes to allow analysis of both inhibition and uncoupling. These are then used for subsequent screening (see Notes 2.8 and 2.9).
3.4.3 Screening
-
1.
Open the saved file and either analyze on plate reader software (preferable) or export to an external software package such as MS Excel. Then plot raw intensity or lifetime versus time.
-
2.
Calculate “slope” values from plots of raw intensity or lifetime versus time using standard linear regression and compare calculated slopes to those of the untreated sample to determine what compounds, if any, are inhibiting/uncoupling (Fig. 2).
-
3.
Dose-based compound ranking can also be performed if necessary by calculating an IC50 (inhibitory effect in state 3) or UC50 (uncoupling effect in state 2 using FCCP as 100% uncoupling) value for each compound. This is best performed using one of the approaches outlined above (see Note 2.6, and supplemental data).
4 Notes
-
1.
Mitochondrial isolation
-
)
Solutions should be prepared using Millipore grade water and stored in prewashed glassware. pH should be adjusted with HCl and KOH. Do NOT use NaOH. All substrate stocks can be prepared in advance and stored in aliquots at −80°C. Buffers should be freshly prepared on a weekly basis and any BSA additions should be made on the day of use.
-
)
Sprague–Dawley rats (Charles River, Wilmington, MA) or equivalent strain. Care and maintenance need to be in accordance with the principles described in the Guide for Care and Use of laboratory Animals (NIH Publication 85–23, 1985) or equivalent. For best results the animals should weigh between 150 and 180 g. Rats are housed in pairs in a controlled environment with constant temperature (21 ± 2°C) and a 12-h light/dark cycle. Food and water are provided at ad libitum. Avoid anesthetics as they can have adverse effects on mitochondrial quality.
-
)
Mitochondria should be stored on ice at a protein concentration of >30 mg/ml and used within 4–6 h.
-
)
Protein standards: can be made in batches and stored at 4°C for several weeks. Albumin is provided as a 2-mg/ml stock solution.
-
)
-
2.
Oxygen consumption analysis
-
)
Standard probe package is for one 96-well plate (or ∼100 assay points). Probe diluted in respiration buffer should be used on the same day. Adjust volumes accordingly for smaller numbers of samples. If reconstituted in 1-ml H2O probe stock can be stored in the dark at +4°C for several days.
-
)
Where possible it is recommended that data be generated in “lifetime” mode. This is achieved on certain instruments with time-resolution capability (e.g., PerkinElmer Victor, BMG FLUOstar Omega) using a ratiometirc read as outlined in Table 4.1. Using these dual intensity reads, the corresponding lifetime is calculated using the following relationship: τ = 40/ln(R1/R2), where R1 and R2 represent read one and read two, respectively, providing lifetime values with units of μs. This can be conducted on plate reader software or after export to software packages such as MS Excel or Microcal Origin. If lifetime measurements are not possible, data can be generated in standard “intensity” mode.
-
)
To minimize oxygen depletion in samples prior to the measurement, plate preparation time should be kept to a minimum.
-
)
Concentration range is defined by the user. As drug concentrations are usually expressed in nmol/mg of mitochondrial protein, starting concentration should be altered based on the mitochondrial protein concentration being used. DMSO content should not exceed 0.5% v/v and dilution plates should be prepared no earlier than the 24-h pretreatment.
-
)
If a significant baseline drift is seen on the original profiles (i.e., at zero enzyme concentration), it is recommended that the baseline be subtracted from all profiles prior to the transformation. This usually improves the linearity of transformed plots.
-
)
While profile linearization provides an accurate measure of enzymatic activity (5) applying this approach to large data sets can be unwieldy. In instances where IC50/UC50 data is being generated on large data sets to facilitate compound ranking, less sophisticated approaches can be applied to generate comparable data in a more user friendly, high-through put compatible manner.
The options are
Oxygen conversion and linear regression
Converting from probe signal to an oxygen scale allows the use of simple linear regression for the generation of dose–response data. Oxygen concentrations can be estimated from measured probe intensities using the following relationship:
$$ [{\text{O}}_{2}](t)=\frac{{[{\text{O}}_{2}]}_{\text{a}}\times {I}_{\text{a}}\times \left({I}_{\text{o}}-{I}_{t}\right)}{{I}_{t}\times \left({I}_{\text{o}}-{I}_{\text{a}}\right)}$$[O2]a is oxygen concentration in air-saturated buffer (235 μM at 30°C) and I t , I a, and I o are fluorescent signal at time t, signal in air-saturated buffer, and signal in deoxygenated buffer (maximal signal), respectively.
By normalizing each profile for initial intensity (dividing each profile by the initial read) and measuring the signal increase on complete deoxygenation (S), this can be simplified to:
$$ [{\text{O}}_{2}](t)=235\times 1\times (S-X)/({X}^{\prime }(S-1))$$This specific transformation is only valid at 30°C and the signal increase on deoxygenation is specific to reader type, measurement settings, and buffer composition. Plates should be at measurement temperature prior the reading. It is also important that no significant deoxygenation has occurred prior to read 1 of the kinetic analysis. It should be noted that this transformation, in this instance, is not primarily intended as an analytical determination of dissolved oxygen but rather as an estimation of oxygen concentration to facilitate simple linear regression analysis to be performed on large data sets.
Threshold time
By assessing the time at which a particular signal threshold is reached and using the inverse of this value (1/threshold time) as a metric of oxygen consumption rate, dose–response data can be quickly generated using standard plate reader software. Oxygen consumption rates and the optimum threshold should, however, be optimized such that the threshold is not exceeded prior to the beginning of the assay (uncoupler analysis) or that significant activity is not missed (inhibitor analysis).
-
)
The RCR is calculated by assessing the effect of ADP addition on mitochondrial oxygen consumption and is an important metric in assessing the quality of a mitochondria preparation. A lower than expected value indicates that the mitochondria are insufficiently coupled, probably due to membrane damage during preparation. Rat liver mitochondria generally show RCRs of approximately 5.0 for glutamate/malate-driven respiration or approximately 3.0 for succinate-driven respiration. It should be noted, however, that RCR values are tissue-dependent. Calculated RCR values should be compared with that of previous experiments or literature data (6).
-
)
A concentration producing large signal changes without inducing rapid signal saturation is deemed “optimal,” thereby allowing reliable analysis of both uncoupling and inhibition of mitochondrial. These optimal concentrations will be dependent on the tissue of origin, the substrate used, and the availability of ADP specific. Typical values for rat liver mitochondria are as follows:
-
(a)
Basal respiration glutamate/malate: 1 mg/ml.
-
(b)
ADP-driven respiration with glutamate/malate: 0.25 mg/ml.
-
(c)
Basal respiration with succinate 0.5 mg/ml.
-
(d)
ADP-driven respiration with succinate: 0.25 mg/ml.
-
(a)
-
)
Prior to screening for compounds with a mitochondrial liability, it should be insured that assay performance is consistent. This is determined from CV values for intra- and interassay variations. These values should not exceed 15% and normally be at ∼10%. Once mitochondrial preparations are seen to be reproducible and the assay is well established (n = 3–5), this optimization becomes unnecessary.
-
)
References
Dykens JA, Marroquin LD, Will Y (2007) Strategies to reduce late-stage drug attrition due to mitochondrial toxicity. Expert Rev Mol Diagn 7:161–175
Wallace KB (2008) Mitochondrial off targets of drug therapy. Trends Pharmacol Sci 29:361–366
Papkovsky DB, Hynes J, Will Y (2006) Respirometric screening technology for ADME-Tox studies. Expert Opin Drug Metab Toxicol 2(2):313–323
Will Y, Hynes J, Ogurtsov VI, Papkovsky DB (2007) Analysis of mitochondrial function using phosphorescent oxygen-sensitive probes. Nat Protoc 1:2563–2572
Ogurtsov VI, Hynes J, Will Y, Papkovsky DB (2008) Data analysis algorithm for high throughput enzymatic oxygen consumption assays based on quenched-fluorescence detection. Sens Actuat B Chem 129:581–590
Hynes J, Hill R, Papkovsky DB (2006) The use of a fluorescence-based oxygen uptake assay in the analysis of cytotoxicity. Toxicol In Vitro 20:785–792
Author information
Authors and Affiliations
Corresponding author
Editor information
Editors and Affiliations
Rights and permissions
Copyright information
© 2012 Springer Science+Business Media, LLC
About this protocol
Cite this protocol
Hynes, J., Swiss, R.L., Will, Y. (2012). High-Throughput Analysis of Mitochondrial Oxygen Consumption. In: Palmeira, C., Moreno, A. (eds) Mitochondrial Bioenergetics. Methods in Molecular Biology, vol 810. Humana Press. https://doi.org/10.1007/978-1-61779-382-0_4
Download citation
DOI: https://doi.org/10.1007/978-1-61779-382-0_4
Published:
Publisher Name: Humana Press
Print ISBN: 978-1-61779-381-3
Online ISBN: 978-1-61779-382-0
eBook Packages: Springer Protocols