
Abstract
The normal blood–brain barrier (BBB) consists of tight interendothelial cell junctions and adjacent astrocyte end feet separated by a basal lamina surrounding the endothelium. The interactions between the different cell types of BBB are disrupted in distinct patterns in the microenvironment of glioma. Malignant gliomas infiltrate the surrounding normal brain parenchyma; a process associated with vascular permeability (VP) and breakdown of the BBB. Herein, we describe methods to quantitatively measure glioma-induced vascular permeability, utilizing an orthotopic xenograft model of glioma.
1 Introduction
In normal brain, endothelial cells held together by tight junctions form a tight barrier between blood and brain parenchyma (blood–brain barrier, BBB). The integrity of BBB is regulated by endothelial cells, basal lamina surrounding the capillary walls, and adjacent astrocyte end feet that form a structure collectively known as the neurovascular unit, NVU (1, 2). The interaction between these different cell types of NVU maintains a tight barrier to protect the brain from various insults and regulate the fluid balance in the brain. However, the balance is disrupted in the microenvironment of various pathologies including glioma (3). These pathologies are often accompanied with vascular permeability (VP) and leakage of fluid into the brain parenchyma which results in high pressure and brain edema.
Glioma growth induces different morphological and functional alterations to each component of the NVU (4). Especially, glioma vasculature demonstrate dilated, tortuous, and leaky vessels with increased VP and breakdown of the BBB and this compromise is associated with increased glioma tumor growth and infiltration in human and rodents (5, 6).
To examine glioma-induced vascular permeability in vivo, an orthotopic xenograft model is well suited to distinguish the role of host/tumor in tumor growth and progression. Xenograft models can be engineered such that tumor cells tagged with luciferase can be used to monitor tumor growth noninvasively or tagged with fluorescent markers for studies that need higher resolution. In fact, in vivo experimental models of glioma have been used to demonstrate that tagged tumor cells can be used to monitor the infiltration of tumor cells in the parenchyma and/or perivascular spaces even at a single cell level (5, 7–9).
We describe methods to tag human glioma cells, implant them in mice by stereotactic injection, and monitor its growth in vivo. Following tumor implantation, tumor-induced vascular permeability and BBB breakdown can be assessed by measuring extravasation of labeled tracers in a quantitative manner.
2 Materials
2.1 Cell Culture and Labeling Tumor Cells
-
1.
Dulbecco’s modified Eagle’s minimum essential medium (DMEM).
-
2.
Fetal bovine serum (FBS), penicillin, streptomycin.
-
3.
37°C CO2 incubator.
-
4.
DBTRG Human glioma cells (ATCC).
2.2 Intracranial Stereotactic Injection
-
1.
Stereotactic frame (Kopf Instruments, Tujunga, CA).
-
2.
Microsyringe (Hamilton, Reno, NV).
-
3.
Isoflurane.
-
4.
Buprenorphine.
-
5.
Sterile suture material.
-
6.
Lidocaine.
2.3 Noninvasive Imaging of Tumor Growth
-
1.
d-Luciferin (Caliper Life Science): make 15 mg/ml stock in PBS, aliquots stored at −80°C. Thaw at room temperature before use.
-
2.
Clipper/trimmer (WAHL Peanut clipper).
-
3.
Nair lotion hair remover.
2.4 Vascular Permeability Assay
-
1.
FITC-dextran 70 kDa (Sigma), reconstituted in PBS at 50 mg/ml, aliquots stored at −80°C. Thaw at room temperature before use. Avoid exposure to light.
-
2.
Heating pad.
-
3.
0.3-ml Syringe.
-
4.
Heparin/Saline: 1 USP unit/ml of heparin dissolved in saline, make fresh before use.
-
5.
Avertin (2,2,2-tribromoethanol, Aldrich): for 50× stock, make a 1:1 (w/v) solution of tribromoethanol in tert-amyl alcohol, store in the dark at 4°C. For 1× working solution, dilute the stock solution 1:50 in PBS in a glass vial and store in the dark at 4°C.
-
6.
Surgery tools: forceps, chest retractor, scissors, rodent brain matrix for coronal sections.
3 Methods
3.1 Glioma Cells
-
1.
Clone in open reading frame of firefly luciferase (pGL4.14, Promega) or red fluorescent protein (RFP) (Clontech) into a lentiviral expression vector (pLVX-puro, Clontech).
-
2.
Prepare infectious lentiviral particles in 293 T packaging cells (ATCC) (Lenti-X Lentiviral Expression Systems, Clontech), store at −80°C.
-
3.
Transduce DBTRG cells with lentivirus with polybrene added to regular growth medium (DMEM + 10% FBS with antibiotics) at a final concentration of 4 μg/ml.
-
4.
Change to regular growth media 8–24 h after transduction (longer incubation of cells with polybrene may be toxic).
-
5.
Select transduced cells by either flow cytometry (DBTRG-RFP) or by adding 2 μg/ml puromycin in the culture medium for at least 2 weeks (DBTRG-luc-puro).
3.2 Intracranial Stereotactic Injections
-
1.
Trypsinize tumor cells and resuspend cells in PBS at 1–2 E8/ml, keep cells on ice.
-
2.
Shave hair of mice in brain area prior to surgery (use Nair for complete hair removal).
-
3.
Anesthetize animal before surgery with 2–3% isoflurane.
-
4.
Immobilize 10-week-old immuno-deficient male mouse (Rag2 null) in a rodent stereotactic frame, make an incision in the skin, and make a burr hole in the skull.
-
5.
Mix tumor cells and inject 5–10 μl (one million cells) at a rate of 1–2 μl/min using a microsyringe (Hamilton, Reno, NV) mounted on a stereotactic frame (Kopf Instruments, Tujunga, CA) using coordinates of 1 mm lateral and 1 mm anterior to the bregma and 1 mm below the dura.
-
6.
Incisions are sutured with sterile suture material.
-
7.
Apply lidocaine to the incision area.
-
8.
Inject 0.05 mg/kg buprenorphine subcutaneously.
-
9.
5–10 μl of PBS is used as a control.
3.3 In Vivo Bioluminescent Imaging
Tumor growth is monitored noninvasively immediately after surgery as well as 4, 7, 14, 21, and 28 days after tumor implantation to generate a growth curve.
-
1.
Anesthetize mice with 2–3% isoflurane.
-
2.
Trim hair with clipper and remove remaining hair at the imaging site with Nair before each imaging as necessary (black hair quenches bioluminescent signal).
-
3.
Inject mice intraperitonealy with d-luciferin (150 μl of 15 mg/ml stock).
-
4.
Ten minutes after luciferin injection assess bioluminescent signal over an integration time of 10 and 60 s using a cooled charge-coupled device (CCD) camera (Spectrum; Caliper Life Sciences, Hopkinton, MA).
-
5.
Quantitate luciferase signal in the brain using Live Image software.
-
6.
Plot bioluminescent signal (corresponding to tumor growth) over time.
3.4 Measuring Vascular Permeability
Vascular permeability can be measured by measuring extravasation of fluorescently labeled dextran tracers after perfusion of blood vessels.
-
1.
Immobilize mice and dilate tail-vein with heating pad.
-
2.
Inject 100 μl of 50 mg/ml FITC-dextran 70 kDa into the tail vein.
-
3.
Wait 15–20 min to allow circulation of dextran in the body.
-
4.
For luciferase expressing cells, inject luciferin for bioluminescent imaging.
-
5.
Inject 0.3–0.5 ml avertin i.p. to make sure animal is deeply anesthetized.
-
6.
Open chest, perfuse animal with 5 ml of heparin/saline.
-
7.
Place brain in rodent brain matrix to make 1-mm coronal sections.
-
8.
Image tumor burden and FITC-dextran using a CCD camera (Fig. 1) (Spectrum, Caliper Life Sciences) or on a confocal microscope for higher resolution (Fig. 2).
Fig. 1. 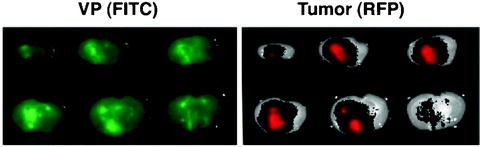
Rag2 null mice were implanted with DBTRG-RFP cells by stereotaxic injection. Twenty-eight days after tumor implantation, mice were injected with FITC-dextran, systemically perfused and 1-mm brain sections were made. Brain sections were imaged to measure vascular permeability (FITC) and tumor (RFP) with a deep cooled CCD imaging system equipped with appropriate fluorescence filter cubes, background subtraction, and image integration software. Note the co-registry of FITC and RFP signal.
Fig. 2. 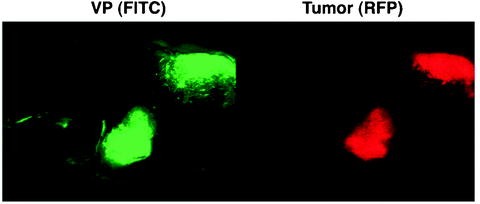
Rag2 null mice were implanted with DBTRG-RFP cells by stereotaxic injection. Twenty-eight days after tumor implantation, mice were injected with FITC-dextran, systemically perfused and 1-mm brain sections were made. Extravastion of dextran (FITC) and tumor burden (labeled with RFP) in fresh brain sections were imaged with an Olympus Fluoview 1000 (ASW 1.7b) laser scanning confocal microscope (Olympus, Melville, NY).


4 Notes
-
1.
Bicistronic lentiviral vectors expressing both luciferase and fluorescent proteins (i.e., green fluorescent protein, GFP) can be used to both perform noninvasive bioluminescent imaging on the basis of firefly luciferase as well as confocal fluorescent imaging for GFP localization.
-
2.
Optimization of the peak bioluminescence is essential in initial studies to determine the ideal substrate incubation time. This can be most easily performed by imaging animal at short intervals over 1–15 min to determine peak bioluminescence.
References
Iadecola, C. (2004), Neurovascular regulation in the normal brain and in Alzheimer’s disease. Nat Rev Neurosci,5(5): p. 347–60.
Simard, M. and M. Nedergaard (2004), The neurobiology of glia in the context of water and ion homeostasis. Neuroscience, 129(4): p. 877–96.
Abbott, N.J., L. Ronnback, and E. Hansson (2006), Astrocyte-endothelial interactions at the blood-brain barrier. Nat Rev Neurosci, 7(1): p. 41–53.
Lee, J., et al. (2009), Glioma-induced remodeling of the neurovascular unit. Brain Res, 1288: p. 125–34.
Lund, C.V., et al. (2006), Reduced glioma infiltration in Src-deficient mice. J Neurooncol, 78(1): p. 19–29.
Neuwelt, E.A. and S.I. Rapoport (1984), Modification of the blood-brain barrier in the chemotherapy of malignant brain tumors. Fed Proc, 43(2): p. 214–9.
Zhang, X., et al. (2002), Experiment and observation on invasion of brain glioma in vivo. J Clin Neurosci, 9(6): p. 668–71.
Winkler, F., et al. (2009), Imaging glioma cell invasion in vivo reveals mechanisms of dissemination and peritumoral angiogenesis. Glia, 57(12): p.1306-15
Lampson, L.A., M.A. Lampson, and A.D. Dunne (1993), Exploiting the lacZ reporter gene for quantitative analysis of disseminated tumor growth within the brain: use of the lacZ gene product as a tumor antigen, for evaluation of antigenic modulation, and to facilitate image analysis of tumor growth in situ. Cancer Res, 53(1): p. 176–82.
Author information
Authors and Affiliations
Corresponding author
Editor information
Editors and Affiliations
Rights and permissions
Copyright information
© 2011 Springer Science+Business Media, LLC
About this protocol
Cite this protocol
Lee, J., Baird, A., Eliceiri, B.P. (2011). In Vivo Measurement of Glioma-Induced Vascular Permeability. In: Turksen, K. (eds) Permeability Barrier. Methods in Molecular Biology, vol 763. Humana Press. https://doi.org/10.1007/978-1-61779-191-8_28
Download citation
DOI: https://doi.org/10.1007/978-1-61779-191-8_28
Published:
Publisher Name: Humana Press
Print ISBN: 978-1-61779-190-1
Online ISBN: 978-1-61779-191-8
eBook Packages: Springer Protocols