
Summary
Receptor trafficking is essential to the delivery of nutrients and to the proper regulation of signaling pathways in mammalian cells. Numerous transmembrane receptors undergo clathrin-mediated endocytosis, followed by sorting in the early endosome. The low-density lipoprotein (LDL) receptor-related protein (LRP) is a multiligand endocytic receptor and a member of the LDL receptor family. At the cell surface, it binds to and continuously internalizes numerous ligands including lipoproteins, proteases, protease inhibitors, growth factors, and β-amyloid precursor protein via clathrin-mediated endocytosis. Its rapid endocytosis rate allows efficient clearance of extracellular and transmembrane ligands. Once internalized into the early or sorting endosome, LRP ligands are delivered to lysosomes to be degraded, whereas LRP is efficiently recycled to the plasma membrane. Herein, the authors describe quantitative methods to measure the endocytosis and recycling capacity of receptors, using LRP as a model receptor.
Key Words
Introduction
Transmembrane receptors undergo sorting at multiple steps in the endocytic pathway. After trafficking through the secretory pathway, most cargo receptors bind to their cognate ligands at the cell surface, are internalized via a clathrin-mediated process, and are then subject to sorting in the early or sorting endosome. This step separates receptors that are destined to be degraded in the multivesicular bodies/lysosomes from those that will be recycled to the cell surface to undergo additional cycles of ligand binding and endocytosis ( 1 ). Cytoplasmic adaptor proteins have long been known to participate in clathrin-mediated sorting at the plasma membrane ( 2 ), and more recently, the role of such adaptor proteins in sorting at the recycling step has been recognized ( 3,4 ).
One well-studied cargo receptor known to undergo both rapid endocytosis and recycling to the cell surface is the low density lipoprotein (LDL) receptor-related protein (LRP), an extremely large member of the LDL receptor family ( 5 ). LRP binds and internalizes numerous ligands, including lipoproteins, proteases, protease inhibitors, growth factors, and bacterial and viral proteins ( 5 ). In addition, LRP has also been shown to function as a signaling receptor, and several cytoplasmic adaptor proteins (Dab1, PSD95, etc.) bind its 100 amino acid cytoplasmic tail ( 6–8 ). The function of LRP in both endocytosis and signal transduction requires a tight regulation of the cell surface levels of LRP.
The 100 amino acid cytosolic tail of LRP contains two NPxY motifs, two di-leucine motifs and an YxxL motif. The YxxL and distal di-leucine motifs are the primary endocytosis signals ( 9 ). The rapid endocytosis of LRP enables its ligands to be internalized and delivered to the lysosome for degradation. Subsequently, LRP is recycled to the plasma membrane. It has been shown that the proximal NPxY motif binds to SNX17, a member of Sorting Nexin family, and promotes LRP recycling ( 3 ). Because of its large size, it is difficult to manipulate and transfect full-length LRP cDNA into cells. To circumvent this issue, the authors’ laboratory has generated a set of LRP minireceptors (mLRP1-4), each consisting of one of the four extracellular ligand-binding domains fused to the transmembrane domain and cytoplasmic tail of LRP ( 10 ). Each minireceptor contains an HA epitope at the N-terminus, allowing for easy detection of the transfected receptor.
Detailed here are two quantitative assays designed to follow the trafficking of cargo receptors through the endocytosis and recycling processes. The HA-tagged domain IV-containing LRP minireceptor (mLRP4) is used as an example in these protocols. Presented first is the kinetic analysis of endocytosis, which involves the use of 125I-labeled ligand or antibody (see Note 1) to quantitatively determine the endocytic rate of wild-type and tailless (lacks the cytoplasmic tail) mLRP4. Second, a flow cytometry-based recycling assay, adapted from Austin et al. ( 3,11,12 ), is used to demonstrate the different recycling rates displayed by wild-type mLRP4 and an mLRP4 mutant deficient in SNX17 binding.
Materials
Endocytosis Assay
Preparation of Iodogen Tubes
-
1.
12 ×75-mm glass (borosilicate) tubes (Fisher).
-
2.
Iodogen powder (Pierce no. 28600).
-
3.
Desiccator filled with dri-rite (with a rack for tubes inside).
-
4.
Nitrogen gas tank (Airgas).
-
5.
5¾” pasteur pipet (Fisher).
-
6.
Chloroform (Sigma) .
Iodination of Ligand or Antibody
-
1.
Handheld survey meter for γ-radiation.
-
2.
Ring/clamp stand.
-
3.
PD10 desalting column (GE Healthcare no. 17-0851-01).
-
4.
Aerosol-barrier tips.
-
5.
50-mL conical centrifuge tubes.
-
6.
Empty lead pig for storage of iodinated protein.
-
7.
PBST buffer: phosphate-buffered saline + 0.01% Tween-20 (Sigma); stored at room temperature.
-
8.
Cytochrome c (Sigma), 20 mg/mL solution in ddH2O, stored at 4°C.
-
9.
D-Tyrosine (Sigma): 10 mg/mL in ddH2O (note: this is a saturated solution, so it will be cloudy; tap to resuspend before use), stored at 4°C.
-
10.
0.5 M sodium phosphate buffer, pH 7.4, stored at room temperature.
-
11.
Carrier-free 125I isotope (100 mCi/mL; Perkin Elmer Life Science).
-
12.
50 μg of protein to be iodinated, preferably in a volume of 90 μL or less.
Trichloroacetic Acid Precipitation to Determine the Percent of Incorporated Isotope
-
1.
Cold PBS (pH 7.4).
-
2.
50 mg/mL solution of bovine serum albumin (BSA; EMD Bioscience), prepared in PBS, sterile filtered, and stored at 4°C.
-
3.
100% w/v TCA in ddH2O (TCA, Sigma).
-
4.
Gamma tubes (Fisher no. 14-959-5) .
Kinetic Analysis of Endocytosis
-
1.
Chinese Hamster Ovary (CHO) cell culture medium: Ham’s F-12 supplemented with 10% defined fetal bovine serum (FBS; Sigma) and 2 mM l-Glutamine (Invitrogen), stored at 4°C.
-
2.
Mirus TransIT CHO transfection kit (Mirus Bioscience).
-
3.
Opti-Mem low serum media (Invitrogen).
-
4.
Trypsin-ethylenediamine-tetraacetic acid (EDTA) (Invitrogen)
-
5.
Ligand-binding buffer: 0.6 g/L BSA in Dubelcco’s Modified Eagle’s Medium (DMEM), sterile filtered and stored at 4°C.
-
6.
Stop/strip solution: 0.2 M acetic acid, pH 2.6, 0.1 M NaCl, or PBS pH 2.0, stored at 4°C.
-
7.
Low sodium dodecyl sulfate (SDS) lysis buffer: 62.5 mM Tris-HCl, pH 6.8, 0.2% SDS, 10% (v/v) glycerol.
Recycling Assay
Conjugation of Alexa Fluor 488 to Anti-HA Antibody
-
1.
Dialysis buffer: 0.1 M sodium carbonate, pH 9.3, sterile filtered and stored at 4°C.
-
2.
Snakeskin dialysis tubing (along with dialysis clips) or Slide-A-Lyzer Cassettes with buoys (Pierce).
-
3.
Anti-HA immunoglobulin (Ig)G (Covance).
-
4.
Alexa Fluor 488 Protein Labeling Kit (Invitrogen Cat. no. A10235), consisting of the following:
-
a.
Alexa Fluor 488 reactive dye (Component A)
-
b.
Sodium bicarbonate (Component B, MW = 84)
-
c.
Purification resin (Component C)
-
d.
Elution buffer (Component D)
-
e.
Purification columns
-
f.
Column funnels
-
g.
Foam column holders
-
h.
Disposable pipets
-
i.
Collection tubes
∗The kit can be stored under the conditions listed. For optimal storage conditions of individual components, refer to the labels on the vials or bags.
-
a.
-
5.
Bio-Rad protein assay dye reagent (Bio-Rad).
-
6.
Disposable cuvettes (Fisher) .
Kinetic Analysis of Recycling
-
1.
U87 culture medium: DMEM (Sigma), supplemented with 10% defined FBS , 1 mM sodium pyruvate (Invitrogen), and 350 μg/mL G418.
-
2.
G418 disulfate (Sigma) stock solution: 175 mg/mL in ddH2O, sterile filtered and stored at –20°C.
-
3.
Trypsin-EDTA (Invitrogen).
-
4.
Alexa Fluor 488 conjugated antibodies recognizing extracellular domain of receptor: light sensitive, wrap with foil and store at –20°C or –80°C.
-
5.
Ligand-binding buffer: see Subheading 2.1.4.
-
6.
Quenching antibody: anti-Alexa Fluor 488 IgG, stored at –20°C or –80°C.
-
7.
Flow cytometry buffer (PFN): PBS supplemented with 1.5% heat-inactivated FBS and 0.1% NaN3, sterile filtered and stored at 4°C.
-
8.
Cell dissociation solution (Sigma).
-
9.
PBS.
-
10.
Fluorescence-activated cell sorter tubes (VWR no. 60818-306).
Methods
Endocytosis Assay
For this assay, antibody to the extracellular region of the receptor or ligand is iodinated using the iodogen method. CHO cells are transfected with wild-type and mutant constructs to be tested, split to five 12-well plates, and assayed the next day. Specifically, iodinated antibody/ligand is added to the cells on ice and allowed to bind to cell surface receptors at 4°C. Next, each plate is warmed to 37°C for different amounts of time to initiate internalization of the receptor. After each warm up, the plates are placed back on ice and exposed to an acidic solution to strip the antibody/ligand from the cell surface. The cells are solubilized, and both the acid wash (cell surface) and lysate (internalized) fractions are counted in a γ-counter. The percent internalized at each time point is equal to the amount of internalized ligand divided by the total amount of cell-associated ligand (cell surface plus internalized), and can be plotted against time to obtain a kinetic internalization curve, as well as a half time for endocytosis.
Preparation of Iodogen Tubes
-
1.
Make iodogen solution (1 mg/mL in chloroform). Keep covered with parafilm.
-
2.
Connect Pasteur pipet to N2 outflow hose, start N2 flow. Pressure should not be too harsh (check on a tube with water inside, outflow should not disturb the surface tension).
-
3.
Pipet 10 μL iodogen solution into the bottom of glass tube (do this in batches of two to three).
-
4.
Dry the droplet with the N2 flow. Be sure to keep the droplet centered on the bottom—aim for a small “button” of dried iodogen on the inside bottom of the tube. Repeat with remaining tubes.
-
5.
Coated tubes will retain activity for 2 yr if stored in a desiccator at room temperature.
Iodination of Ligand or Antibody to Follow Internalization
-
1.
Cut open the tip of a PD10 desalting column to start drainage. Set up on the ring/clamp stand.
-
2.
Set up one 50-mL conical tube in a Styrofoam stand under the PD10 column so as to collect drainage (be sure to secure everything so that the tube does not tip over).
-
3.
Equilibrate the column with 20 to 25 mL PBST (do this while you are setting up all other materials). Once equilibrated, maintain about 500 μL of PBST on top of column until ready to load sample.
-
4.
Perform iodination according to the radiation guidelines of your institution, preferably in a designated hood. Always wear disposable gloves and a protective lab coat when working with radioactivity, and don a lead apron for extra protection. Also, be sure to use aerosol barrier tips to prevent internal contamination of pipetors.
-
5.
Put the ring/clamp stand and the 125I isotope in the hood on absorbent underpads; also set up waste bag in hood.
-
6.
In the hood, mix 50 μg of the protein to be iodinated (antibody or ligand, see Notes 1 and 2) and 10 μL (1 mCi) of 125I isotope in the iodogen-coated tube. Bring total volume to 100 μL with phosphate buffer. Tap the tube gently to mix. Incubate at room temperature for 10 min.
-
7.
After 10 min incubation, empty the flow-through from the PD10 column. Then quench the reaction by adding 20 μL d-tyrosine to the iodogen tube, being careful not to touch the sides. Tap gently for 30 s, and then add 20 μL of cytochrome c and mix by gentle tapping. It is important to try not to splash the mixture up the sides of the tube, as you will likely contaminate your pipetor.
-
8.
Add the quenched mixture evenly and dropwise to the top of the PD10 column.
-
9.
Add 300 μL of PBST buffer evenly and drop wise to the top of the column, and then add 4 to 5 mL of PBST to the column. Colored band should migrate in a horizontal band as it progresses downward.
-
10.
Start collecting fluid in the labeled screw-cap vial when the colored band reaches the bottom of the column. Your collection should have most of the color in it. Stop collecting before the color fades to avoid collecting any free isotope.
-
11.
Fill the vial to 1 mL with PBST, invert to mix. Store in the empty lead pig at 4°C until use (see Note 3).
-
12.
Dispose of radioactive waste properly. Be sure to survey your equipment for radioactivity before putting it away.
TCA Precipitation to Determine the Percent of Incorporated Isotope
-
1.
Pipet into triplicate Eppendorf tubes with tight closures: 598 μL PBS, 200 μL 50 mg/mL BSA, 200 μL 100% TCA, and 2 μL iodinated protein. Close lids, vortex, and incubate on ice for 10 min.
-
2.
Centrifuge tubes at 16,000g for 10 min at 4°C. Pipet 500 μL of supernatant into a γ-tube, discard the remaining supernatant.
-
3.
Cut the bottom of the tube, which contains the protein pellet, into another γ-tube.
-
4.
Count both sets of tubes in a γ-counter.
-
5.
To determine percent of unincorporated isotope: \(\frac{\hbox{supernatant} \times 2} {\hbox{pellet}} \times 100\)
Average the values from triplicate samples. If the percent incorporation is less than 95%, the iodination should be repeated, taking care not to collect any free isotope migrating at the end of the colored band.
Kinetic Analysis of Endocytosis
-
1.
Plate CHO cells in 6-well plates such that they are 80 to 90% confluent for transfection. Plate four wells for each construct to be assayed (see Note 4).
-
2.
The next day, transfect cells using the Mirus TransIT CHO kit, according to instructions. Specifically, for each well, combine 200 μL Opti-Mem with 8 μL CHO TransIT reagent in a polystyrene tube. Mix and incubate 15 min at room temperature. Next, add 2 μg maxiprep DNA of the construct to be tested, mix and incubate 15 min at room temperature. Add 3 μL CHO Mojo reagent, mix and incubate 15 min at room temperature. Finally, pipet mixture dropwise onto cells in complete medium, rocking to evenly distribute transfection complexes.
-
3.
At 4 to 12 h post-transfection, trypsinize three wells for each construct, retaining the fourth for assessment of transfection efficiency. Resuspend cells into a total of 18 mL media/trypsinized cells, plate 1 mL/well in triplicate wells of 12-well plates.
-
4.
The next day, perform endocytosis assay. Prewarm 50 mL ligand-binding buffer in a 37°C water bath. Rinse cells twice in ice-cold ligand-binding buffer. (Note: be careful to add the washes to the sides of the wells, so as not to disrupt the monolayers.)
-
5.
Add 125I-ligand at 5 nM final concentration or 125I-antibody at 1 nM final concentration in cold ligand-binding buffer (0.5 mL per well). Allow binding to proceed at 4°C for 40 min with gentle rocking.
-
6.
Remove unbound ligand and then wash cell monolayers three times with cold binding buffer.
-
7.
Add cold stop/strip solution (ligand) or cold PBS pH 2.0 (antibody) to the zero time-point plate, and keep on ice.
-
8.
For the remaining plates: place each one in a 37°C water bath and add 0.6 ml of ligand-binding buffer prewarmed to 37°C quickly but gently to the monolayers to initiate internalization. After each time point (1, 2, 5, and 10 min), quickly place each plate on ice, remove the ligand-binding buffer, and add 0.5 mL cold stop/strip solution (ligand) or PBS pH 2.0 (antibody).
-
9.
Strip ligand/antibody from the cell surface by incubation of cell monolayers with cold stop/strip solution (ligand) or PBS pH 2.0 (antibody) for 20 min (0.5 mL for 10 min, twice). Collect this cell surface fraction to labeled γ-tubes, and count radioactivity in a γ-counter.
-
10.
Solubilize cells with low-SDS lysis buffer. Collect this internalized fraction and count.
-
11.
The sum of internalized and cell surface ligand represents the maximum potential internalization. Calculate the fraction of internalized ligand at each time point, and plot the average of triplicate wells on a scatter plot (Fig. 1). The half-time of endocytosis refers to time required to internalize half of the acid-washable 125I-ligand/antibody initially bound to the cell surface.
-
12.
If desired, use the fourth well of transfected cells to assess the transfection efficiency by Western blot. Alternatively, a green fluorescent protein expression construct can be cotransfected into this well, and the transfection efficiency can be easily ascertained using an inverted microscope equipped with the proper filter.

Example of data derived from the kinetic analysis of endocytosis. The LRP minireceptor, mLRP4, undergoes rapid endocytosis, whereas a minireceptor lacking the cytoplasmic tail internalizes very slowly.
Recycling Assay
After a short incubation with fluorescently labeled antibody, U87 cells are chased at 37°C for different period times. The chase allows some receptor to be delivered to late endosome/lysosome while some recycle back to the plasma membrane. Recycled receptors will be recognized by anti-Alexa Fluor 488 IgG, which specifically recognizes Alexa Fluor 488, thereby quenching fluorescence. Thus, fluorescence measured after each chase by flow cytometry will represent the amount of receptors remaining inside the cell. Accordingly, the amount of receptors that recycle to the plasma membrane can be calculated by subtracting the remaining fluorescence from the total (0 min) at each time point. Percent of recycled receptor after each chase can be plotted as a function of chase time. As a control experiment, another set of cells can be chased without quenching antibody to determine any nonspecific disappearance of receptor.
Conjugation of Alexa Fluor 488 to Anti-HA Antibody (Slightly Modified From the Manufacturer’s Instructions)
-
1.
Dialyze anti-HA IgG against 2 L 0.1 M sodium carbonate (pH 9.3) overnight at 4°C. Place a stirring bar in the beaker so buffer can be kept in uniform solution.
-
2.
The next day, replace buffer with a fresh 2 L and further dialyze for 4 h.
-
3.
Remove protein from dialysis. Measure protein concentration using Bio-rad reagent. Dilute Bio-rad reagent in a 1:5 ratio with ddH2O. Mix 10 μL of dialyzed anti-HA antibody with 1 mL of diluted Bio-rad reagent in a disposable cuvette and measure the absorbance at 595 nm in a spectrophotometer. Blank sample should contain 10 μL 0.1 M sodium carbonate. Calculate the concentration of protein according to the standard curve made by BSA.
-
4.
Prepare a 1 M solution of sodium bicarbonate by adding 1 mL of ddH2O to the provided vial of sodium bicarbonate (component B). Vortex or pipet up and down until fully dissolved.
-
5.
Adjust antibody concentration to 2 mg/mL in PBS or 0.1 M sodium bicarbonate. If the concentration is lower than 2 mg/mL, see Note 5.
-
6.
To 0.5 mL of the 2 mg/mL protein solution, add 50 μL of the 1 M bicarbonate prepared in step 4.
-
7.
Allow a vial of reactive dye to warm to room temperature. Transfer the protein solution from step 6 to the vial of reactive dye. This vial contains a magnetic stir bar. Cap the vial and invert a few times to fully dissolve the dye. Stir the reaction mixture for 1 h at room temperature. Because preparation of the purification column takes approx 15 min, you may wish to begin pouring the column.
-
8.
Purify the labeled antibody by following the steps listed here:
-
a.
Assemble the column and position it upright. Attach a funnel to the top of a column. Gently insert the column through the X-cut in one of the provided foam holders to avoid damaging the column. Using the foam holder, secure the column with a clamp to a ringstand. Carefully remove the cap from the bottom of the column.
-
b.
Prepare elution buffer by diluting the room temperature 10X stock (component D) 10-fold in ddH2O. Typically, less than 10 mL will be required for each purification.
-
c.
Using one of the provided pipets, stir the purification resin (component C) thoroughly to ensure a homogeneous suspension. Pipet the resin into the column, allowing excess buffer to drain away into a small beaker or other container. Resin should be packed into the column until the resin is approx 3 cm from the top of the column.
-
d.
Allow the excess buffer to drain into the column bed. Do not worry about the column drying out because the matrix will remain hydrated. Make certain the buffer flow through the column is even prior to adding the reaction mixture. If the flow of buffer is slow or stalled, repack the column. Remove the column funnel to load the sample. Carefully load the reaction mixture from step 6 onto the column. Allow the mixture to enter the column resin. Rinse the reaction vial with approx 100 μL of elution buffer and apply to the column. Allow this solution to enter the column.
-
e.
Replace the funnel and slowly add elution buffer (prepared in Subheading 2.2.), taking care not to disturb the column bed. Continue adding elution buffer until the labeled protein has been eluted (typically about 30 min).
Important: Collect, and retain as fractions, all of the eluted buffer.
-
f.
As the column runs, periodically illuminate the column with a handheld ultraviolet lamp. You should observe two colored bands, which represent the separation of labeled protein from unincorporated dye. Collect the first colored band, which contains the labeled protein, into one of the provided collection tubes. If desired, a foam holder can be used to support the collection tube. Add elution buffer to the column as necessary. Do not collect the slower moving band, which consists of unincorporated dye.
-
g.
Once the fraction containing the labeled protein has been successfully collected, all other fractions of eluted buffer may be discarded. In rare instances where there is no discernable band corresponding to labeled protein, the retained fractions can be used to recover any unlabeled protein.
-
a.
-
9.
Measure the absorbance of the conjugate solution at 280 nm and 494 nm (A280 and A494) in a cuvette with a 1-cm pathlength. (Note: Dilution of the sample may be necessary.)
-
10.
Calculate the concentration of conjugated protein in the sample:
$$\hbox{concentration (M) = } \frac{\hbox{[A}_{280} - ({\hbox{A}}_{494} \times 0.11)] \times \hbox{dilution factor}} {203,000} $$where 203,000 cm−1M−1 is the molar extinction coefficient of a typical IgG and 0.11 is a correction factor to account for absorption of the dye at 280 nm.
-
11.
Calculate the degree of labeling:
$${\hbox{moles dye per mole protein }} = \frac{\hbox{A}_{494} \times \hbox{dilution factor}} {71,000 \times \hbox{protein concentration (M)}} $$where 71,000 cm−1M−1 is the approximate molar extinction coefficient of the Alexa Fluor® 488 dye at 494 nm. For IgGs, labeling with 4 to 9 moles of Alexa Fluor® 488 dye per mole of antibody is optimal.
Recycling Assay (Fig. 2.), see Note 6

Schematic representation of recycling assay. Receptors are labeled with fluorescent antibody (white circles), followed by a chase at 37°C for different amounts of time in the presence of the anti-Alexa 488 quenching antibody (black circles represent quenched antibody). The amount of fluorescence remaining, representing the amount of intracellular receptors, is measured by flow cytometry.
-
1.
Plate U87 cells stably expressing wild-type or mutant LRP minireceptor in 6-well plates on the day before the assay; three wells are for wild-type and three wells are for mutant receptor-expressing cells. Cells should be 90% confluent on the day of experiment.
-
2.
On the day of the assay, warm up binding buffer in 37°C water bath and chill PBS on ice. Prepare antibody solution in warm binding buffer (2 μg/mL in binding buffer). 3 mL of antibody solution is required for one 6-well plate. For four plates, make 14 mL to have enough solution.
-
3.
Quickly but gently wash cell monolayers twice with warm binding buffer. After the second wash, remove binding buffer completely by aspirating twice.
-
4.
Add antibody solution into cells, 0.5 mL per well.
-
5.
Incubate cells in antibody solution at 37°C for 20 min. During this time, prepare quenching antibody solution in warm binding buffer (24 μg/mL)
-
6.
After incubation, remove antibody solution from wells and wash cells twice with warm binding buffer. After the second wash, remove binding buffer completely by aspirating twice.
-
7.
Add 0.5 mL of quenching antibody solution to cells except for 0 min samples.
-
8.
Incubate cells at 37°C for different period of times (e.g., 0, 5, 10, 20 min). For the 0 min time point, place the plate on ice immediately.
-
9.
At each time point, place cells on ice, remove binding buffer, and wash cells twice with ice-cold PBS.
-
10.
Chill PFN on ice. Remove PBS completely and add 1 mL of cell dissociation solution into each well and incubate at 37°C for 2 min.
-
11.
Collect cells from the plate and transfer to FACS tubes.
-
12.
Use 1 mL of ice-cold complete media per well to rinse remaining cells from the plate.
-
13.
Centrifuge cells at 145 ×g for 2 min at 4°C.
-
14.
A small cell pellet should be seen at the bottom of tube. Carefully aspirate supernatant, add 2 mL of PFN to each tube, tap tube to resuspend pellet, and centrifuge at 145 ×g for 2 min at 4°C. Repeat with a second wash step.
Fig. 3. 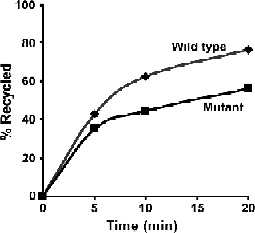
Example of data derived from the kinetic analysis of recycling. Mutant receptor shows less efficient recycling compared to wild-type receptor. Of labeled wild-type receptors, 60% returned to the cell surface within 10 min, whereas only 50% of the mutant receptor was recycled after 20-min chase.
-
15.
Gently resuspend cells in 500 μL of PFN and read in flow cytometer (BD FACS calibur).
-
16.
Data interpretation (Fig. 3): Since anti-Alexa Fluor 488 IgG quenches fluorescence of Alexa Fluor 488 on the cell surface only, the data obtained from flow cytometry analysis represent the fluorescence from the receptor remaining within the cell (not the cell surface). Quenched fluorescence is calculated by subtracting the remaining fluorescence after each chase from the total initial signal, and can be plotted as percent of total after each chase (equal to recycled receptor).
$$\hbox{{\%}\; of Recycled receptor} = \frac{\stackrel{\hbox{Total receptor (0 min)}\; -\; \hbox{intracellular receptor}}{\hbox{\qquad\qquad\qquad\qquad after each chase}}} {\hbox{Total receptor (0 min)}} \times 100$$

Notes
-
1.
Selection of ligand or antibody for endocytosis assay: The kinetic analysis of endocytosis can be performed with either antibody or ligand for the receptor of interest. Antibodies to epitope tags are preferred, while ligands and antibodies directed to the extracellular domain of the receptor may require more extensive testing to determine the degree of background binding. The iodogen method works best on antibodies that are in aqueous buffer (i.e., PBS or Tris-buffered saline), and the presence of glycerol inhibits labeling; therefore commercial antibodies stored in glycerol should be dialyzed into PBS. Furthermore, some commercial antibodies contain a carrier protein, such as BSA, which could increase the background level of radioactive binding to the cells and should be removed prior to iodination.
-
2.
Limiting protein concentration: If the concentration of protein to be iodinated is such that 90 μL will not provide 50 μg, or if the protein is very precious, smaller amounts can be iodinated. The quantity of isotope can also be reduced accordingly, but the total 100 μL reaction volume should remain the same. The final concentration of iodinated antibody should be calculated to reflect any such changes.
-
3.
Determination of iodinated protein concentration: Although some protein is certainly lost in the PD-10 column, the protein concentration is approximated as the amount of protein in the reaction divided by the final volume of the iodinated protein in the screw-cap vial. For the parameters given in the methods section, this would be 50 μg/1,000 μL = 50 ng/μL.
-
4.
The use of alternative cell types for endocytosis assay: This protocol was designed for CHO cells, which are easily transfected using the Mirus TransIT CHO kit. The authors’ laboratory has used this protocol successfully with stably transfected CHO cells, but has had limited success with transiently transfected HeLa cells.
-
5.
Limiting protein concentration for fluorescently labeling antibody: Proteins at concentrations less than 2 mg/mL will not label as efficiently. If the protein cannot be concentrated to approx 2 mg/mL, use less than 1 mg protein per reaction to increase the molar ratio of dye to protein. In addition, using a dilute protein solution, especially at less than 1 mg/mL, will make it more difficult to efficiently remove the unconjugated dye from the dye-labeled protein with acceptable yields, since the provided purification columns are designed to purify conjugates from a total volume of less than 1 mL. For reaction volumes greater than 1 mL, divide the solution of the conjugate and apply it to multiple purification columns or, to avoid further dilution of the conjugate, remove free dye by extensive dialysis.
-
6.
Flow cytometry: Perform all steps on ice except for the cell dissociation step.
References
Maxfield, F.R. and McGraw, T.E. (2004) Endocytic recycling. Nat. Rev. Mol. Cell Biol. 5, 121–132 .
Bonifacino, J.S. and Traub, L.M. (2003) Signals for sorting of transmembrane proteins to endosomes and lysosomes. Annu. Rev. Biochem. 72, 395–447.
van Kerkhof, P., Lee, J., McCormick, L., et al. (2005) Sorting nexin 17 facilitates LRP recycling in the early endosome. Embo J. 24, 2851–2861.
Carlton, J., Bujny, M., Rutherford, A. and Cullen, P. (2005) Sorting nexins—unifying trends and new perspectives. Traffic 6, 75–82.
Herz, J. and Strickland, D.K. (2001) LRP: a multifunctional scavenger and signaling receptor. J. Clin. Invest. 108, 779–784.
Trommsdorff, M., Borg, J.P., Margolis, B. and Herz, J. (1998) Interaction of cytosolic adaptor proteins with neuronal apolipoprotein E receptors and the amyloid precursor protein. J. Bio.l Chem. 273, 33556–33560.
Trommsdorff, M., Gotthardt, M., Hiesberger, T., et al. (1999) Reeler/Disabled–like disruption of neuronal migration in knockout mice lacking the VLDL receptor and ApoE receptor 2. Cell 97, 689–701.
Lillis, A.P., Mikhailenko, I. and Strickland, D.K. (2005) Beyond endocytosis: LRP function in cell migration, proliferation and vascular permeability. J. Thromb. Haemost. 3, 1884–1893.
Li, Y., Marzolo, M.P., van Kerkhof, P., Strous, G.J. and Bu, G. (2000) The YXXL motif, but not the two NPXY motifs, serves as the dominant endocytosis signal for low density lipoprotein receptor-related protein. J. Biol. Chem. 275, 17187–17194.
Obermoeller-McCormick, L.M., Li, Y., Osaka, H., FitzGerald, D.J., Schwartz, A.L., Bu, G., et al. (2001) Dissection of receptor folding and ligand-binding property with functional minireceptors of LDL receptor-related protein. J. Cel.l Sci. 114, 899–908.
Austin, C.D., De Maziere, A.M., Pisacane, P.I., Van Dijk, S.M., et al. (2004) Endocytosis and sorting of ErbB2 and the site of action of cancer therapeutics trastuzumab and geldanamycin. Mol. Biol. Cell 15, 5268–5282.
Schapiro, F.B., Soe, T.T., Mallet, W.G. and Maxfield, F.R. (2004) Role of cytoplasmic domain serines in intracellular trafficking of furin. Mol. Biol. Cell 15, 2884–2894.
Acknowledgments
Work in the authors’ laboratory is supported by grants from the National Institutes of Health, the Alzheimer’s Association, and the American Health Assistance Foundation.
Author information
Authors and Affiliations
Editor information
Editors and Affiliations
Rights and permissions
Copyright information
© 2008 Humana Press, a part of Springer Science+Business Media, LLC
About this protocol
Cite this protocol
Knisely, J.M., Lee, J., Bu, G. (2008). Measurement of Receptor Endocytosis and Recycling. In: Vancura, A. (eds) Membrane Trafficking. Methods in Molecular Biology, vol 457. Humana Press. https://doi.org/10.1007/978-1-59745-261-8_24
Download citation
DOI: https://doi.org/10.1007/978-1-59745-261-8_24
Published:
Publisher Name: Humana Press
Print ISBN: 978-1-58829-925-3
Online ISBN: 978-1-59745-261-8
eBook Packages: Springer Protocols