
Abstract
Tandem mass spectrometry has been used for determinations of enzyme activities in biological samples. Activities in rehydrated dried blood spots of lysosomal enzymes glucocerebrosidase, acid sphingomyelinase, galactocerebroside β-galactosidase, acid-α-galactosidase, acid α-glucosidase, and α-D-iduronidase are measured simultaneously by multiple-reaction monitoring of ion dissociations from cations produced by electrospray ionization of enzymatic products. Simple and inexpensive assay protocols are described that are readily adopted for handling multiple samples in 96-well microtiter plates, employing simple separation steps, and using less than or equal to 3 µmol of synthetic or commercially available substrates, and less than 25 nmol of internal standards per analysis. The assays have the potential of being used for large-scale screening of newborns for the detection of inborn errors of metabolism.
1 Introduction
Mass spectrometry (MS) is a highly sensiti ve method that has been widely used for the selective detection and quantitation of various metabolites that are present at trace levels in body fluids and manifest genetic diseases (1). In the traditional analytical approach to metabolite analysis, the compounds of interest are extracted from the biological material (urine, blood serum, and so on) (2) and separated by a gas chromatograph or a high-performance liquid chromatography that is coupled on-line to the mass spectrometer. The use of gas chromatography often requires that the metabolites be chemically derivatized prior to analysis to increase their volatility (3). The mass spectrometer ionizes the metabolite molecules and provides information on the mass-to-charge ratios (m/z) of the ions formed, in addition to their chemical composition and structure. Owing to the known and often unambiguous relationship between gasphase ions and their precursor analyte molecules, ion detection and analysis serves to identify and quantify the analytes. Molecular structure is typically inferred from ion dissociations occurring in the mass spectrometer that can be directly induced by ionization of the analyte molecules, or by collisional activation of stable ions produced from the analyte by a soft ionization method such as electrospray ionization (ESI) (4). In the latter case, ions are separated by their mass-to-charge ratios in the mass spectrometer, the ions of interest are selected, activated by collisions with gas, and one or several of their dissociation products are monitored, as described in Figs. 1 , 2 , 3 . The group of techniques using dissociations of mass-selected ions is referred to as tandem mass spectrometry (MS/MS) (5).

Flow chart of quantitative analysis of enzyme activity in dried blood spots by electrospray ionization-tandem mass spectrometry.

Chemical, ionization, and ion dissociation processes in assaying glucocerebrosidase activity by electrospray ionization-tandem mass spectrometry.

Chemical, ionization, and ion dissociation processes in assaying acid-α-galactosidase activity by electrospray ionization-tandem mass spectrometry.
In this chapter we describe a novel approach of using MS/MS for the detection of inborn errors of metabolism in patients. In particular, we focus on two groups of lysosomal storage diseases (LSD) that are caused by defective enzymes in the lysosome (6). The first group includes diseases caused by deficiencies of lysosomal enzymes involved in catabolic degradation of sphingolipids (7). The other group is mucopolysacharidoses that are caused by deficiencies of enzymes that catalyze degradation of glycosaminoglycans, such as heparan sulfate and dermatan sulfate (8). We note that the methods reported here have evolved from our previous studies of mass spectrometric methods for diagnosing enzyme deficiencies in cultured cells using affinity capture-elution ESI MS (ACESIMS) (9,10) that addressed several LSD (11,12) and congenital disorders of glycosylation (13). The advantage of MS/MS over other mass spectrometry-based approaches is that it (1) provides highly selective and efficient separation of ions from low-abundance analytes in the mass spectrometer, (2) increases overall selectivity and sensitivity, (3) works with rehydrated dried blood spots (DBS) from newborn screening cards as biological sample, and, last but not least, (4) uses simpler and less expensive substrates and procedures for routine use in clinical practice.
The use of MS/MS for enzyme assays in DBS is illustrated in Fig. 1 . The sample, which is a 2–5 mm diameter punch of a DBS on a screening card, is incubated with a buffer containing a nonendogenous substrate conjugate that incorporates a structure moiety that is similar to that in the natural substrate and is recognized by the enzyme. Action of the enzyme forms the enzymatic product (P) whose molecular mass is different from that of the substrate conjugate. ESI produces gas-phase ions (Ionized P) by protonation, alkali metal ion attachment, or deprotonation of P that are directly related to its molecular mass and can be readily separated in the mass spectrometer from those of the substrate conjugate. Internal standard (IS) is added to P that upon ESI forms gasphase ions that are chemically similar to ionized P, but differ in mass. Collisional activation in the tandem mass spectrometer produces fragment ions from ionized P and IS that are unequivocally related to P and IS and are used to monitor the ionized P and IS intensities. Because ion intensities from electrospray are proportional to analyte concentrations (4), the measured relative intensities of P and IS reporter fragment ions are proportional to P and IS concentrations. The proportionalities (response factors in ESI-MS/MS) are determined from calibration curves for P and IS. In case IS is an isotopomer of P, their ESI-MS/MS response factors are nearly identical and no external calibration is necessary.
Although ESI-MS/MS is suitable for the sensitive analysis of biomolecules in complex mixtures, ESI can be suppressed by the relatively large amounts of nonvolatile buffer and detergent components present in the DBS reaction mixtures. To remove the interfering components we developed a simple solid-phase extraction methods using silica gel or C18-coated silica gel.
The MS/MS analysis is carried out on a tandem quadrupole mass spectrometer, abbreviated as Q1-q2-Q3, which is an instrument commonly used in clinical laboratories. Q1-q2-Q3 mass spectrometers are currently available from ABI-Sciex, (Foster City, CA), ThermoElectron (Finnigan, Waltham, MA), or Waters (Micromass, Milford, MA). Precursor analyte ions that were produced by ESI are selected by the first quadrupole mass filter (Q1), allowed to dissociate in a collision multipole (q2), and their dissociation products are detected after passing through the second quadrupole mass filter (Q3). It should be noted that other types of tandem mass spectrometers could be used for MS/MS measurements, e.g., quadrupole-time of flight (Q-TOF), quadrupole-ion trap (QTrap), or TOF-TOF.
Figure 2 illustrates the principle of an MS/MS analysis of glucocerebrosidase (ABG) activity in DBS (14). ABG deficiency causes accumulation of its substrate, glucosylceramide, in macrophages (Gaucher disease). The enzyme is assayed by a glucosylceramide (ABG-substrate) containing an unnatural C12 acyl-containing ceramide. The deglucosylated C12-ceramide, ABG-P, is ionized by ESI together with an added internal standard which is a C14-ceramide, ABG-IS, giving precursor ions at m/z 482 and 510, respectively. Each of these ions is selected by Q1 and collisionally dissociated in q2 to produce a common fragment ion at m/z 264. Q3 is set to transmit m/z 264, whereas Q1 is scanned over a mass window including m/z 482 and m/z 510 to produce a precursor ion scan. The ion intensities in the detection channels corresponding to m/z 482 → m/z 264 and m/z 510 → m/z 264 are then used to quantify the ion currents carried by ionized ABG-P and ionized ABG-IS and, thus, to determine the concentration of ABG-P relative to ABG-IS.
The same method is used to monitor ceramides produced by lysozomal enzymes acid sphingomyelinase (ASM-P and ASM-IS with C6 and C4 fatty acid chains, respectively) for the detection of Niemann-Pick type A/B disease, and galactocerebroside β-galactosidase (GALC-P and GALC-IS with C8 and C10 fatty acid chains, respectively) for the detection of Krabbe disease (15). All of these ceramides give the common m/z 264 ion on ESI-MS/MS and can be monitored in one scan spanning the precursor ion m/z values, thus allowing the three enzymes to be assayed in one analysis.
Isotope labeling is used to monitor P from assays of acid-α-galactosidase (GLA) for the detection of Fabry disease, and lysosomal acid α-glucosidase (GAA) for the detection of Pompe disease, as shown in Fig. 3 . GLA-P produced by enzymatic action on GLA-substrate is ionized by ESI together with GLA-IS. The product ion intensities from GLA-P (m/z 384) and GLA-IS (m/z 389) are measured in the multiple reaction monitoring (MRM) mode (16) that alternatively records fragment ion intensities in the m/z 484 → m/z 384 and m/z 489 → m/z 389 channels. GAA is assayed in the same MRM mode by using homologous P and IS that are one CH2 group (14 Da) heavier than those for GLA. The measured activities are summarized in Table 1 (14).
MRM is also employed to assay the enzyme α-L-iduronidase (IDUA) (17) which is crucial for the degradation of glycosaminoglycans and whose deficiency causes mucopolysaccharidosis type I (Hurler disease) (8). The molecular structures and ion m/z ratios used for the ESI-MS/MS assay are summarized in Fig. 4 . The measured IDUA activities in rehydrated DBS are available as supporting information to ref. 17.

Chemical, ionization, and ion dissociation processes in assaying α-L-iduronidase activity by electrospray ionization-tandem mass spectrometry.
2 Materials
2.1 Equipment
-
1.
Pipetman (AccuTek, San Diego, CA; http://www.accuteklab.com).
-
2.
96-well microtiter plates (Greiner Bio-One, Longwood, FL; http://www.gbo.com/ bioscience; cat. no. 655001).
-
3.
Aluminum foil tape (Hillas Packaging, Inc., Fort Worth, TX; cat. no. 3M 425 3 X60).
-
4.
96-well polypropylene microtiter plate (E&K Scientific, Inc., Santa Clara, CA; cat. no. 21201).
-
5.
Megatiter 96-well polypropylene deep-well plates (2.2-mL well volume) (Continental Lab Products, San Diego, CA; cat. no. 2045-Megatiter plates).
-
6.
Vacuum manifold (Millipore, Billerica, MA; http://www.millipore.com; cat. no. MAVM0960R or MAVM0960T).
-
7.
Teflon-lined covers (Cap Mats, E&K Scientific, cat. no. EK99116).
-
8.
Well plate for IDUA assays (Innovative Microplate, Billerica, MA; http://www.innovativemicroplate.com; cat. no. F20005).
-
9.
Silicagel, 230–400 mesh (Merck Chemicals, Darmstadt, Germany).
2.2 Dried Blood Spots
-
1.
All DBS were obtained from anonymous donors through Seattle Children’s Hospital and Regional Center (Dr. C. R. Scott) or from the Laboratory for Neurochemistry, Buenos Aires, Argentina (Dr. Mariana Blanco) and handled in compliance with the Institutional Review Board review. LSD- and mucopolysacharidoses-I-affected patients had been previously diagnosed with the particular disorder using established clinical and biochemical procedures. DBS from nonaffected individuals were obtained from adults (18–55 yr of age) and infants (3rd to 15th d postpartum).
-
2.
DBS on report cards were kept at ambient temperature during shipment (less than 10 d) and then stored at −20°C in zip-lock plastic bags (one bag inside of a second bag). Zip-lock bags were kept in a sealed plastic box containing CaSO4 granules as a desiccant. DBS for assays of ABG, ASM, GALC, GAA, and GLA enzymes can be stored at 4°C for up to 70 d with loss of approx 10% of enzyme activity.
2.3 Substrate Conjugates
-
1.
All glycosylceramide substrates and ceramide IS for assaying ABG (C12 substrate, C14 IS), ASM (C6 substrate, C4 IS), and GALC (C8 substrate, C10 IS) were purchased from Avanti Polar Lipids (Alabaster, AL; http://www.avantilipids.com/ index) and used as received.
-
2.
GAA and GLA substrates and IS were synthesized as described in supporting information for ref. 14 and are available from Dr. M. H. Gelb (gelb@chem.washington.edu) on request.
-
3.
The substrate for IDUA was prepared by D. Wang on the scale of 1–2 g from commercially available heparin by a seven-step synthesis. The IDUA substrate and IS are available from M. H. Gelb on request.
2.4 Detergents, Inhibitors, Additives, and Buffers
-
1.
Sodium taurocholate, oleic acid, and Triton X-100 were purchased from Sigma-Aldrich (Milwaukee, WI; http://www.sigma-aldrich.com) and used as received.
-
2.
Acarbose was purchased from Toronto Research Chemicals, Inc. (North York, Ontario, Canada; http://www.trc-canada.com; cat. no. A123500) and used as received.
-
3.
N-acetyl-galactosamine was purchased from Sigma-Aldrich.
-
4.
DBS elution buffer for ABG, ASM, GALC, GAA, and GLA: 20 mM sodium phosphate (NaH2PO4, pH 7.0).
-
5.
DBS elution buffer for IDUA: 50 mM sodium formate and 0.04 mM D-saccharic acid-1,4-lactone (Sigma, St. Louis, MO), pH 2.8.
-
6.
ABG incubation buffer: to prepare 0.62 M citrate-phosphate buffer (pH 4.95), dissolve NaH2PO4 in water to 0.62 M and add solid trisodium citrate to 0.31 M followed by adjusting to pH 4.95 ± 0.05 with 6 M HCl.
-
7.
ASM incubation buffer: 0.92 M sodium acetate buffer, pH 5.5.
-
8.
GALC incubation buffer: to prepare 0.3 M citrate-phosphate buffer (pH 4.42), dissolve NaH2PO4 monohydrate in water to 0.3 M and add solid trisodium citrate to 0.15 M followed by adjusting to pH 4.42 with 6 M HCl.
-
9.
GAA incubation buffer: to prepare 0.3 M citrate-phosphate buffer (pH 3.9), dissolve NaH2PO4 monohydrate in water to 0.3 M and add solid trisodium citrate to 0.15 M followed by adjusting to pH 3.9 with 6 M HCl.
-
10.
GLA incubation buffer: 1.7 M sodium acetate, pH 4.6.
-
11.
85 mM Glycine carbonate buffer (pH 10.5): from 6.4 g/L glycine and 27.5 g/L sodium carbonate.
2.5 Stock Solutions
-
1.
Stock solutions (3.0 mM) of substrates for ABG, ASM, and GALC were prepared in methanol and stored in Teflon septum-lined screw cap vials at −20°C. GLA and GAA substrate stock solutions were made at 10 mM in methanol.
-
2.
Stock solutions of ceramide products and IS were prepared by weighing the lipid (typically 4.0 ± 0.1 mg), dissolving to 4 mM in methanol, and then diluting to 0.01 mM in methanol.
-
3.
Stock solutions of GLA and GAA products and IS were prepared at 10 mM in methanol and diluted to 0.1 mM with water:methanol (2∶1).
-
4.
Stock solution of IDUA substrate was made at 1 mM in water.
-
5.
All stock solutions were stored in screw-cap vials at −20°C.
-
6.
All solvent manipulations and volume measurements were carried out with Pipetman.
2.6 Assay Solutions
The substrate and IS concentrations in assay solutions were optimized for carrying out the assays either with 2-mm DBS punches for each enzyme, or with an enzyme extract from a single 5-mm DBS punch. The following solutions and procedures are for using an enzyme extract from a 5-mm DBS punch corresponding to approx 10 µL of blood that typically contains 75,000–180,000 leukocytes for adults and newborns (first day, full term), respectively (18).
2.6.1 ABG Assay Solution
-
1.
Add ABG substrate solution (3 mM in methanol, 200 µL), ABG IS stock solution (0.05 mM in methanol, 480 µL), and sodium taurocholate solution (12% w/v in water, 240 µL) to a 5-mL vial.
-
2.
Place the vial in a desiccator attached to a vacuum pump and remove the solvent to give a white residue (∼30 min at room temperature).
-
3.
Add 1.80 mL of the ABG incubation buffer.
-
4.
Vortex the vial until all residue is dissolved, and any emulsion was broken by centrifugation. The final assay solution (1.80 mL volume) contains 0.33 mM (0.6 µmol) ABG substrate, 13.3 µM (24 nmol) ABG-IS, 1.6% sodium taurocholate, and 0.62 M citrate-phosphate, pH 4.95.
2.6.2 ASM Assay Solution
-
1.
Mix ASM substrate stock solution (3 mM in methanol, 200 µL), ASM-IS solution (0.05 mMin methanol, 240 µL), and sodium taurocholate (12% w/v in water, 15 µL) in a 5-mL vial.
-
2.
Place the vial in a desiccator attached to a vacuum pump and remove the solvent to give a white residue (∼30 min at room temperature).
-
3.
Add 1.80 mL of ASM incubation buffer.
-
4.
Vortex the vial until all residue is dissolved and any emulsion was broken by centrifugation. The final assay solution (1.80 mL volume) contains 0.33 mM (0.6 µmol) ASM substrate, 6.67 µM (12 nmol) ASM-IS, 0.1% sodium taurocholate, and 0.92 M sodium acetate, pH 5.5.
2.6.3 GALC Assay Solution
-
1.
Mix GALC substrate stock solution (3 mM in methanol, 200 µL), ASM-IS solution (0.05 mM in methanol, 240 µL), 240 µL of an aqueous solution of sodium taurocholate (12% w/v), and 1.2% oleic acid in a 5-mL vial.
-
2.
Place the vial in a desiccator attached to a vacuum pump and remove the solvent to give a white residue (∼30 min at room temperature).
-
3.
Add 1.80 mL of the GALC incubation buffer.
-
4.
Vortex the vial until all residue is dissolved and any emulsion was broken by centrifugation. The final assay solution (1.80 mL volume) contains 0.33 mM (0.6 µmol) GALC substrate, 6.67 µM (12 nmol) GALC-IS, 1.6% sodium taurocholate, 0.16% oleic acid, and 0.3 M citrate-phosphate, pH 4.42.
2.6.4 GAA Assay Solution
-
1.
Mix GAA substrate stock solution (10 mM in methanol, 120 µL), GAA-IS solution (0.1 mM in methanol, 120 µL), acarbose solution (8 mM in water, 30 µL) (see Note 1), and Triton X-100 (1.8 µL) in a 5-mL vial.
-
2.
Place the vial in a desiccator attached to a vacuum pump and remove the solvent to give a white residue (∼30 min at room temperature).
-
3.
Add 1.80 mL of the GAA incubation buffer.
-
4.
Vortex the vial until the residue dissolved and any emulsion was broken by centrifugation. The final assay solution (1.80 mL volume) contains 0.33 mM (1.2 µmol) GAA substrate, 6.67 µM (12 nmol) GAA-IS, 0.13 mM acarbose, and 0.3 M citrate-phosphate, pH 3.9.
2.6.5 GLA Assay Solution
-
1.
Mix GLA substrate stock solution (10 mM in methanol, 300 µL), GLA-IS solution (0.1 mM in methanol, 120 µL), sodium taurocholate solution (12% w/v in water, 15 µL), and N-acetyl-galactosamine solution (1 M in water, 105 µL) in a 5-mL vial.
-
2.
Place the vial in a desiccator attached to a vacuum pump and remove the solvent to give a white residue (∼30 min at room temperature).
-
3.
Add the GLA incubation buffer (300 µL) and vortex the vial until all residue is dissolved and any emulsion was broken by centrifugation. The final assay solution (300 µL volume) contains 10 mM (3 µmol) GLA substrate, 40 µM (12 nmol) GLA-IS, 0.6% sodium taurocholate, 350 mM N-acetyl-galactosamine, and 1.85 M sodium acetate, pH 4.6.
3 Methods
3.1 Enzyme Assays
3.1.1 DBS Extraction
-
1.
To a single well of a 96-well microtiter plate, add a 5-mm DBS disk (containing ∼10 µL of blood) followed by 80 µL of DBS elution buffer.
-
2.
Seal the plate with aluminum foil tape.
-
3.
Incubate for 1 h at 37°C with orbital shaking (250 rpm) in a thermostated air shaker.
3.1.2 Incubation and Work Up for ABG, ASM, GALC, GAA, and GLA
-
1.
To each of 5 wells of a 96-well polypropylene microtiter plate (E&K Scientific) add 10 µL of the DBS extract solution, followed by 15 µL of ASM, GALC, ABG, GAA assay cocktails, and 2.5 µL of GLA assay cocktail, one cocktail per well.
-
2.
Seal the plate with aluminum foil tape.
-
3.
Incubate at 37°C for 24 h with orbital shaking at 150 rpm.
-
4.
Quench the reactions by addition of 100 µL of methanol:chloroform (2∶1) to each (see Note 2).
-
5.
Pump up and down five times the solution in each well with a Pipetman P200.
-
6.
Combine all five solutions into one well of a Megatiter plate.
-
7.
Add 400 µL each of chloroform (see Note 2) and water to the combined mixture.
-
8.
Place the plate in a thermostated air shaker with orbital shaking (250 rpm).
-
9.
Allow the mixture to separate into two layers (∼1 h).
-
10.
Using a plate loader, load 100 mg of silica gel to each of the wells of a 96-well filter plate (Innovative Microplate, Chicopee, MA; cat. no. F20005) (see Note 3).
-
11.
Using a Pipetman, remove 400 µL of the bottom (chloroform) layer made in step 9 and apply to a single well made in step 10.
-
12.
Place the filter plate in a Millipore vacuum manifold containing a 96-well Megatiter polypropylene deep-well plate as the filtrate receiver.
-
13.
Filter the chloroform solution through the silica gel by suction.
-
14.
Charge the well with 700 µL of methanol:chloroform (9∶1) (see Note 2).
-
15.
Elute the P and IS from silica gel with methanol:chloroform (9∶1) by suction.
-
16.
Evaporate the solvent from the receiver well in a vacuum desiccator (∼10 min at room temperature).
-
17.
Take up the resulting residue in 200 µL of 5 mM ammonium formate in methanol:chloroform (3∶1).
-
18.
Analyze the solution by tandem mass spectrometry or store at −20°C.
3.1.3 Incubation and Work Up for IDUA
-
1.
Obtain a 3-mm DBS punch by use of a standard leather punch and place it in a well of a 96-well plate (see Note 4).
-
2.
Soak the DBS in 40 µL of the IDUA elution buffer and cap the plate with a Teflon-lined cover.
-
3.
Shake the plate gently on an orbital shaker for 10 min at room temperature.
-
4.
To the same well add 20 µL of 1 mM IDUA substrate stock solution.
-
5.
Cap the plate and gently shake at 37°C for 24 h in a thermostated air shaker.
-
6.
Quench the reaction by addition of 200 µL of glycine-carbonate buffer.
-
7.
Add, 20 µL of 10 µM IDUA-IS solution in water (see Note 5).
-
8.
Mix the solution in the well by pipetting the liquid up and down a few times (a multichannel pipetor can be used when running several IDUA assays in parallel).
-
9.
Transfer the liquid to a well of a 96-well filter plate containing C18 silica (for preparation, see Note 6).
-
10.
Attach the filter plate to a vacuum manifold system that was attached to a water aspirator.
-
11.
Add 400 µL of 50 mL/L methanol in water and wash the C18 silica solid phase by suction.
-
12.
Attach the manifold to a Megatiter deep-well receiver plate and use suction to elute IDUA-P and IDUA-IS with one 400 µL portion of 500 mL/L methanol in water.
-
13.
Evaporate the solvents from the receiver under reduced pressure by use of a vacuum desiccator (∼1 h at room temperature).
-
14.
To each well add 70 µL of 5 mM ammonium formate in methanol-chloroform, and infuse the sample solutions in the mass spectrometer.
3.2 Mass Spectrometric Analysis
-
1.
ESI-MS/MS analyses were performed on a Sciex API-III tandem quadrupole tandem mass spectrometer equipped with an electrospray ion source and operated in positive ion mode (see Note 7).
-
2.
Sample solutions were loaded in a gas-tight syringe and flow-injected by a syringe pump (Harvard Apparatus, Holliston, MA) through a 100 µm-internal diameter fused silica capillary at 2–3.3 µL/min flow rates (see Note 8).
-
3.
The capillary was flushed with 4 × 50 µL of acetonitrile after each sample infusion to prevent cross-contamination.
-
4.
The ESI source was operated with the following parameters: needle voltage, 4300 V; counter electrode, 650 V; nebulizer gas pressure, 35 psi; nebulizer gas flow rate, 0.6 L/min of N2; curtain gas flow rate, 1.8 L/min of N2; skimmer voltage, 60 V; q0 rod offset voltage, 30 V; Q1 rod offset voltage, 28 V; q2 rod offset voltage, 13 V (see Note 9); Q3 rod offset voltage, 5 V; collision gas (Ar) number density, 2.25 × 10¹⁴ molecules/cm3 corresponding to 0.007 torr at 25°C.
-
5.
The data acquisition parameters in the MRM mode were as follows: dwell time, 3–100 ms and pause time, 0.05 ms. Ion intensities from 200 to 250 scans were summed in each MRM channel over approx 2 min and used for quantification.
-
6.
The molar amount of each P (mol P) is calculated from the ion abundance ratio of ionized P (I P[sample]) to ionized IS (II S) minus the same ratio for a blank, multiplied by the amount of added IS (molI S), and divided by the response factor ratio of P to IS (R P).
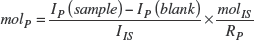
RP is determined separately by infusing a mixture of P and IS of known concentrations and measuring the ratio of the relevant peak intensities in the MS/MS mass spectrum.
-
7.
The enzyme activity is calculated from the blank-corrected amount of P from a DBS sample that was divided by the incubation time and the blood volume, and is reported as µmol/h/(L blood) (see Note 10).

4 Notes
-
1.
Acarbose is used to effectively inhibit the enzyme maltase glucoamylase (Ki = 0.14 µM) that is present in neutrophils (6) and would interfere with the determination of GAA activity in Pompe patients (14).
-
2.
Chloroform can be replaced by the less toxic ethyl acetate. An optimized procedure using ethyl acetate is expected in early 2006. Contact M. H. Gelb for more information.
-
3.
The products would be in the top layer if ethyl acetate was used.
-
4.
An F96 MaxiSorp Nunc-Immuno Plate from Nalge Nunc International, Rochester, NY (cat. no. 442404).
-
5.
All solutions were stored at −20°C and can be freeze-thawed multiple times.
-
6.
The C18-filled filter plate used C18-silica bulk media (Sigma-Aldrich; cat. no. 377635) that was slurried in 10 mL of dichloromethane, and 1 mL of slurry was added to each well. Solvent was removed by suction on a filter manifold, and the solid phase was washed with 3 mL of methanol followed by 3 mL of 50 mL/L methanol in water.
-
7.
Optimum infusion flow rates may differ and need to be optimized for the mass spectrometer being used.
-
8.
Other tandem quadrupole mass spectrometers equipped with electrospray ionizers can be used to the same end, e.g., ABI-Sciex API 2000, 3000, 4000, or 5000 series (http://www.appliedbiosystems.com), Waters Quattro Premier and LCT (http://www.waters.com/WatersDivision) Premier, or ThermoElectron TSQ Quantum (http://www.thermo.com). See http://www.directindustry.com for instrument listing.
-
9.
The difference between the q2 and Q1 voltages determines the ion collision energy in the laboratory frame of reference. Collision energies between 15 and 25 V were used for ion dissociations to optimize the yields of product ions for MRM on the Sciex API-III.
-
10.
Blank-corrected enzyme activities for ABG, ASM, GALC, GAA, and GLA in extracts from 5-mm DBS are given in Table 1 .
References
Koeberl, D. D., Young, S. P., Gregersen, N. S., et al. (2003) Rare disorders of metabolism with elevated butyryl-and isobutyryl-carnitine detected by tandem mass spectrometry. Pediatr. Res. 54, 219–223.
Stevens, R. D., Hillman, S. L., Worthy, S., Sanders, D., and Millington, D. S. (2000) Assay for free and total carnitine in human plasma using tandem mass spectrometry. Clin. Chem. 46, 727–729.
Fauler, G., Leis, H. J., Huber, E., et al. (1997) Determination of homovanillic acid and vanillylmandelic acid in neuroblastoma screening by stable isotope dilution GC-MS. J. Mass Spectrom. 32, 507–514.
Cole, R. B. (ed.) (1997) Electrospray Ionization Mass Spectrometry. Fundamentals, Instrumentation and Applications, Wiley-Interscience, New York.
Busch, K. L., Glish, G. L., and McLuckey, S. A. (eds.) (1988) Mass Spectrometry/Mass Spectrometry: Techniques and Applications of Tandem Mass Spectrometry, VCH Publishers, New York.
Scriver, C. R., Beaudet, A. L., Sly, W. S., and Valle, D. (eds.) (2001) Lysosomal Storage Disorders. In: The Metabolic & Molecular Bases of Inherited Disease, 8th Ed., McGraw-Hill, New York, Part 16, pp. 3371–3896.
Sandhoff, K., Kolter, T., and Harzer, K. (2001) Sphingolipid activator proteins. In: The Metabolic & Molecular Bases of Inherited Disease, 8th Ed., (Scriver, C. R., Beaudet, A. L., Sly, W. S., and Valle, D., eds.) McGraw-Hill, New York, pp. 3371–3375.
Neufeld, E. F. and Muenzer, J. (2001) The mucopolysaccharidoses. In: The Metabolic & Molecular Bases of Inherited Disease, 8th Ed., (Scriver, C. R., Beaudet, A. L., Sly, W. S., and Valle, D., eds.) McGraw-Hill, New York, pp. 3421–3426.
Gerber, S. A., Scott, C. R., Tureček, F., and Gelb, M. H. (1999) Analysis of rates of multiple enzymes in cell lysates by electrospray ionization mass spectrometry. J. Am. Chem. Soc. 121, 1102–1104.
Tureček, F. (2002) Mass spectrometry in coupling with affinity capture-release and isotope-coded affinity tags for quantitative protein analysis. J. Mass Spectrom. 37, 1–14.
Gerber, S.A., Scott, C. R., Tureček, F., and Gelb, M. H. (2001) Direct profiling of multiple enzyme activities in human cell lysates by affinity chromatography/electrospray ionization mass spectrometry. Anal. Chem. 73, 1651–1657.
Zhou, X.-F., Tureček, F., Scott, C. R., and Gelb, M. H. (2001) Quantitation of cellular acid sphingomyelinase and galactocerebroside-galactosidase activities by electrospray ionization mass spectrometry. Clin. Chem. 45, 874–881.
Li, Y., Ogata, Y., Freeze, H. H., Scott, C. R., Turecek, F., and Gelb, M. H. (2003) Affinity capture and elution/electrospray ionization mass spectrometry assay of phosphomannomutase and phosphomannose isomerase for the multiplex analysis of congenital disorders of glycosylation yypes Ia and Ib. Anal. Chem. 75, 42–48.
Li, Y., Scott, C. R., Chamoles, N. A., et al. (2004) Direct multiplex assay of lysosomal enzymes in dried blood spots for newborn screening. Clin. Chem. 50, 1785–1796.
Li, Y., Brockmann, K., Tureček, F., Scott, C. R., and Gelb, M. H. (2004) Tandem mass spectrometry for the direct assay of enzymes in dried blood spots: application to newborn screening for Krabbe disease. Clin. Chem. 50, 638–640.
For the nomenclature of mass spectrometric techniques, see the Mass Spectrometry Terms and Definitions Project at http://www.msterms.com/wiki/index.
Wang, D., Eadala, B., Sadilek, M., et al. (2005) Tandem mass spectrometric analysis of dried blood spots for screening of mucopolysaccharidosis I in newborns. Clin. Chem. 51, 898–900.
Dacie, J. V. and Lewis, S. M. (1984) Practical Haematology, 6th Ed., Churchill Livingstone, Edinburgh, Scotland, pp. 9.
Author information
Authors and Affiliations
Editor information
Editors and Affiliations
Rights and permissions
Copyright information
© 2007 Humana Press Inc.
About this protocol
Cite this protocol
Tureček, F., Scott, C.R., Gelb, M.H. (2007). Tandem Mass Spectrometry in the Detection of Inborn Errors of Metabolism for Newborn Screening. In: Sechi, S. (eds) Quantitative Proteomics by Mass Spectrometry. Methods in Molecular Biology, vol 359. Humana Press. https://doi.org/10.1007/978-1-59745-255-7_10
Download citation
DOI: https://doi.org/10.1007/978-1-59745-255-7_10
Publisher Name: Humana Press
Print ISBN: 978-1-58829-571-2
Online ISBN: 978-1-59745-255-7
eBook Packages: Springer Protocols