
Abstract
Observing cellular and molecular processes in living organisms is key for understanding many important biological processes. Confocal microscopy is excellently suited for this as it enables the observation of molecules and cells in tissue layers of living organisms in three dimensions over time. However, in continuously growing organs, such as plant roots, observations over extended time spans become difficult as the specimen quickly grows out the field of view. Here, we provide a protocol that allows for the acquisition of confocal microscope time-lapse images of root tips spanning many hours, as the growing root tip is tracked and the microscopy is automatized to change the position of the stage. Importantly, due to its specific setup, this protocol allows for observing the effects of chemical stimuli or for creating specific growth conditions by precisely defining the growth medium during imaging. The protocol is suitable for observing multiple fluorophores, thereby moving beyond the level of individual genes. It is also simple enough to conduct larger numbers of these assays. Here we exemplify our method by describing the observation of root growth and GFP intensity in root tips under iron depletion conditions.
1 Introduction
Biological processes happen in time and space. It is therefore crucial to measure both where these processes happen and when. For instance, a notable proportion of genes of multicellular organisms are not expressed in all tissues at all times. To study the spatiotemporal aspects of gene and protein expression, it is necessary to observe them in intact organs, since single-cell cultures cannot reproduce the three-dimensional properties of a living organism. A well-established method to observe gene and protein activity in multilayer tissues is confocal microscopy in conjunction with fluorescent proteins that are either driven by endogenous gene promoters or fused to the protein of interest. In particular, the root of Arabidopsis thaliana has proven to be a useful system for live imaging, as it is relatively thin and optically transparent [1]. Moreover, its cell types are arranged in concentric cylinders around the central vascular tissue displaying radial symmetry, and there is no cell migration as cells divide only in the tip of the root and maintain their relative position later on during elongation and differentiation. However, a major constraint is that a living root is constantly growing and cells leave the field of view within minutes or hours (depending on the magnification). Here we provide a protocol for automatically imaging growing root tips using a confocal microscope under defined conditions. In particular, we describe the observation of a fluorescent reporter gene under control and reduced iron levels. Importantly, this method can be utilized using different growth conditions or chemical stimuli.
2 Materials
2.1 Plant Growth Media [3]
-
1.
100× MS stock solution: 2.062 M NH4NO3, 1.879 M KNO3, 125 mM KPO4H2, 0.5 mM KI, 150.1 mM (MgSO4)7H20, 10 mM (MnSO4)H20, 2.99 mM (ZnSO4)7H20, 10.027 mM H3BO3, 10 mM (Na2EDTA2)H20, 0.01 mM (CuSO4)5H20, 0.103 mM (Na2MoO4)2H20, 0.0105 mM (CoCl2)6H20, NH4NO3. KNO3 requires heat to dissolve. Start with ~350 mL deionized water and bring up to 0.5 L. Then pass through a sterile filter.
-
2.
100× CaCl2 stock solution: 299 mM CaCl2 in deionized water. Sterile filtered.
-
3.
MES buffer: 235 mM MES.
-
4.
1 M potassium hydroxide.
-
5.
Agar.
-
6.
30× sucrose solution: 876 mM sucrose. Sterile filtered.
-
7.
Iron–EDTA solution: 0.1 M iron stock solution—ethylenediaminetetraacetic acid iron(III) sodium salt in deionized water. Sterile filtered.
-
8.
Ferrozine stock solution: 77 mM ferrozine–3-(2-pyridyl)-5,6-diphenyl-1,2,4-triazine-p,p′-disulfonic acid monosodium salt hydrate in deionized water . Sterile filtered.
-
9.
Pipetman, 5 mL and 25 mL glass pipettes.
-
10.
Plastic Pasteur pipette.
-
11.
1000 μL micropipette and 1000 μL tips.
-
12.
2 L plastic beaker.
-
13.
2× 1 L glass bottles.
-
14.
pH meter.
-
15.
Metal spoon.
-
16.
Magnetic stir bars and magnetic stirrer.
-
17.
Autoclave.
-
18.
Water bath.
-
19.
Leveling table and level.
-
20.
Square petri dishes, 12 × 12 × 1.7 cm in their original plastic bags.
-
21.
Sealing tape.
-
22.
500 mL glass bottles.
-
23.
5 L plastic beaker.
-
24.
Sucrose.
-
25.
4 M sodium hydroxide solution.
2.2 Gas Sterilization of Seeds [4]
-
1.
Arabidopsis thaliana seeds of a line expressing a fluorescent protein.
-
2.
2 mL microcentrifuge tubes.
-
3.
Tube rack for 2 mL microcentrifuge tubes.
-
4.
Permanent marker and transparent tape.
-
5.
15 mL plastic falcon tube.
-
6.
Polycarbonate lockable airtight box, e.g., 36.8 × 18.4 ×17.1 cm, Nalgene.
-
7.
250 mL glass beaker.
-
8.
Stir bar and magnetic stirrer.
-
9.
10% sodium hypochloride.
-
10.
37% hydrochloric acid.
-
11.
Pipetman and tips (0.5–10 μL).
-
12.
Adhesive ventilating tape.
-
13.
Support rack to hold square petri dishes vertically.
2.3 Ferrozine Infiltration
-
1.
5 mL microcentrifuge tubes.
-
2.
Plastic forceps.
-
3.
5 mL glass pipette.
-
4.
20 μL micropipette with appropriate tips.
-
5.
77 mM ferrozine stock solution.
-
6.
Liquid ½ MS medium: 50 g sucrose, 11.05 g MS salts in 5 L deionized water. pH adjusted to 5.6–5.7 using 4 M sodium hydroxide solution. Autoclave in 500 mL bottles for 15 min, 125 °C. Store at 4 °C.
-
7.
Desiccator attached to a vacuum peristaltic pump.
2.4 Confocal Imaging
-
1.
Microscopy chambers: Chambered 1.0. borosilicate coverglass system (Lab Tech/Nunc).
-
2.
Plastic forceps.
-
3.
Propidium iodide solution: 0.15 mM PI solution in deionized water.
-
4.
Microscope: LSM 700, Zeiss.
-
5.
Zeiss Zen 2010.
-
6.
Zen controller: https://code.google.com/archive/p/zen-controller/.
-
7.
Fiji [2]: https://fiji.sc/.
-
8.
Confocal_Tracking Tool plug-in: https://gitlab.com/buschlab/Confocal-Tracking.
-
9.
Confocal Stitching plug-in: https://gitlab.com/buschlab/Confocal_Tracking.
3 Methods
3.1 Plant growth medium preparation
-
1.
Mix 21 mL of 100× MS stock solution with 21 mL of 100× CaCl2 stock solution and add 1958 mL deionized water to obtain a 2 L final volume.
-
2.
Transfer 1931.34 mL of the MS solution to a 2 L plastic beaker and add 20 mL of MES buffer solution to maintain the pH value of the 1× MS base solution after pH adjustment.
-
3.
Adjust pH to 5.75 using 1 M potassium hydroxide ( see Note 1 ).
-
4.
Weigh 10 g agar into two 1 L glass bottles and add in one bottle 955.65 mL 1× MS base solution for control medium and in the other bottle 952.65 mL 1× MS base solution for ferrozine medium. Add stir bars to bottles.
-
5.
Mix using magnetic stirrer , so that the agar does not clump on the bottom.
-
6.
Autoclave for 15 min, 125 °C. Take the bottle out after the temperature drops to 70 °C and put in into a water bath until it cools down to 55–60 °C.
-
7.
In a sterile hood, place the bottle onto a magnetic stirrer with temperature set to 55–60 °C.
-
8.
Add 33.33 mL of the 30× sucrose solution to medium.
-
9.
Add 1 mL of sterile iron–EDTA solution for control plates or 4 mL of sterile 77 mM ferrozine solution for iron deficiency plates. After adding iron–EDTA or ferrozine, place the bottle in the water bath for at least 30 min to allow efficient distribution of the chemical in the liquid.
-
10.
Use a leveling table with a level to create an even surface in the hood.
-
11.
Distribute 53 mL of medium to each square petri dish and leave the plates with lids half-open for 2 h, or overnight with closed lids, to allow the medium to polymerize.
-
12.
Put the plates in their original plastic bag, seal it with tape, and store with the lids facing down at 4 °C. The ferrozine containing plates must be stored protected from light.
3.2 Seed Gas Sterilization
-
1.
For seed sterilization, put dry A. thaliana seeds in a 2 mL (see Note 2 ) microcentrifuge tube on a tube rack in the polycarbonate lockable airtight box. Label the tubes with a permanent marker and seal with a piece of transparent tape to protect the writing. Place a 250 mL beaker containing a magnetic stir bar and 130 mL of 10% sodium hypochlorite next to the rack in the box.
-
2.
Aliquot 3.5 mL 37% hydrochloric acid into the 15 mL falcon tube.
-
3.
Place the box on a magnetic stirrer in a chemical hood.
-
4.
Slowly add the hydrochloric acid to the sodium hypochlorite and quickly close the box with the lid.
-
5.
Turn on the stirrer at 200 rpm.
-
6.
Incubate for 1 h (see Note 3 ).
-
7.
Keep in the chemical hood and open the lid slightly to let the gas vent for 30 min.
-
8.
Under sterile conditions, add 500 μL sterile deionized water to each tube.
-
9.
Vortex the tubes and spin down shortly.
-
10.
Wrap the tubes in aluminum foil and stratify at 4 °C for a minimum of 2 days.
-
11.
Under a sterile hood and using a pipette, distribute 24 stratified seeds in a regular pattern in two rows on the MS agar plates.
-
12.
Close plates with ventilating tape and place them vertically on a support rack in a long day (16 h light, 21 °C) plant growth chamber for 4–7 days.
3.3 Ferrozine Infiltration
-
1.
Pipette 4 mL 1/2MS medium into a 5 mL tube and add 16 μL of the ferrozine solution. Use this as ferrozine treatment.
-
2.
Pipette 4 mL 1/2MS medium into a 5 mL tube. Use this as control treatment.
-
3.
Using forceps, transfer the 4–7-day-old seedlings into the liquid so that they are fully submerged or floating on the surface of the solution.
-
4.
Place the tube into a desiccator attached to a vacuum peristaltic pump and turn on the vacuum for a maximum of 10 min.
3.4 Confocal Imaging: Sample Preparation
These steps illustrate how seedlings are transferred to a growth chamber (Fig. 1) that allows them to grow for long time periods while being imaged. In this growth chamber, chemical stimuli can be performed, e.g., by the addition of hormones or chemicals or by changing the nutrient composition that the roots encounter. As fluorescence, cellular properties, and root growth rate can be measured simultaneously over time, this setup also allows for correlations between gene expression and cellular and root growth rate.
-
1.
Slowly press the lid from the microscopy chamber against a fresh plate for either 1× MS medium (control treatment) or ferrozine medium (iron deficiency treatment) (Fig. 2a).
Fig. 1 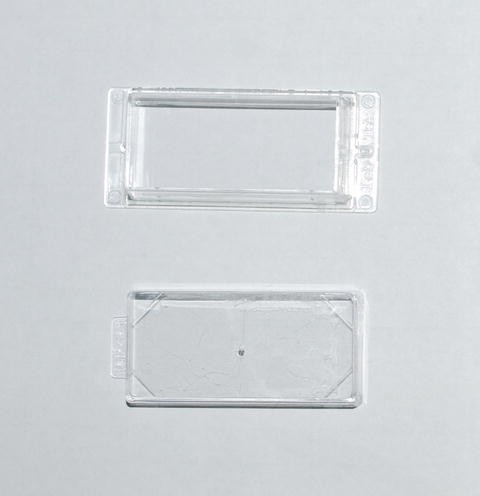
Empty chamber and its lid
Fig. 2 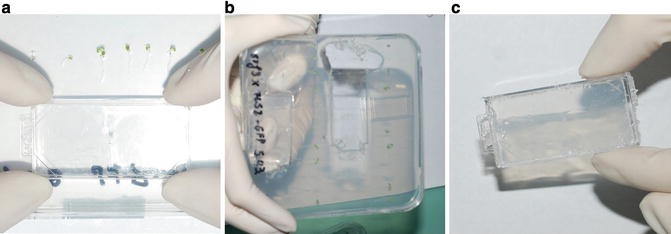
Cutting out a gel block for the chamber. (a) Placement of the microscopy chamber to cut out gel block. (b) The original plate after cutting out the gel block. (c) Cut out gel block in the microscopy chamber
-
2.
Turn the plate upside-down so that the microscopy chamber lid with the gel still attached points down. Carefully move the lid first up and down and then to the left or right until the gel detaches from the plate surface (Fig. 2b).
-
3.
Carefully pull the lid of the microscopy chamber out of the agar plate, until the gel block falls into it (Fig. 2c). For the testing of two conditions simultaneously, e.g., ferrozine treatment and control, a layer of ferrozine containing gel and a layer of a control iron-containing gel is cut in half with a scalpel after being placed in the lid. Then, each block is separately transferred to the chamber.
-
4.
Using forceps, transfer seedlings (Fig. 3a) infiltrated in control or ferrozine containing liquid ½ MS to the control or ferrozine gel block, respectively, in the lid of the microscopy chamber in a way that allows the root to still grow (see Note 4 ) and with sufficient distance between the individual plants (Fig. 3b).
Fig. 3 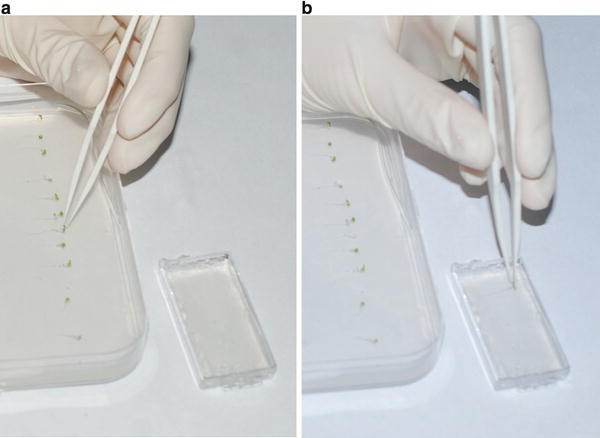
Placing seedlings on the gel block. (a) Grasping of a seedling for transfer onto the gel block. (b) Placement of seedlings on the gel block
-
5.
Place the confocal chamber, facing downward, onto the lid. Press slowly until the edges of the confocal chamber sink down into the gel.
-
6.
Now turn the chamber with the lid assembled, so that the lid is facing up. Slowly remove the lid—the gel should now detach and slide into the chamber (Fig. 4) (see Note 5 ).
Fig. 4 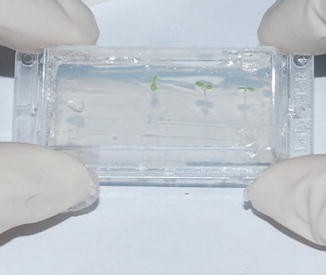
Transferring the gel block with seedlings into the chamber
-
7.
Use the short smooth side of the lid to gently press the gel down and thereby remove the remaining air between the bottom side of the chamber and the gel (Fig. 5). For imaging under ferrozine treatment and control conditions, the gel layers are pressed down one after another in the same chamber (Fig. 6).
Fig. 5 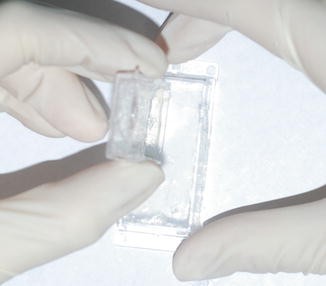
Moving the gel block with seedlings to the bottom of the chamber
Fig. 6 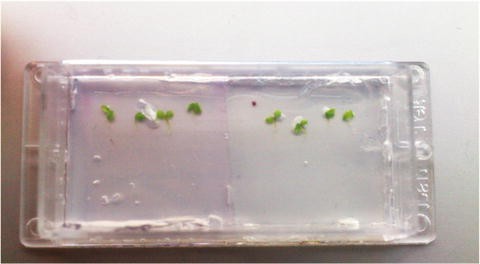
Placing seedlings in ferrozine and control treatments in the same chamber
-
8.
Put the lid onto the chamber to cover it and place it on the microscope .


3.5 Image Acquisition
-
1.
Open the “Zen” software on the microscope-controlling computer and select “Start system” in the first dialogue.
-
2.
Switch to “Ocular” mode and find the first root (Fig. 7).
Fig. 7 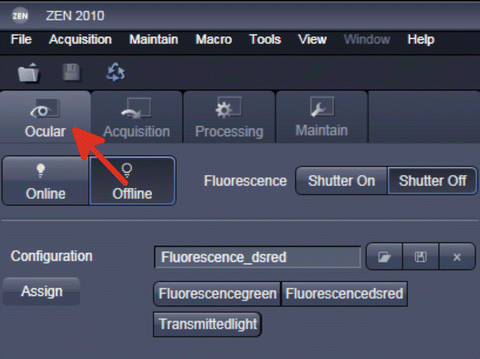
Switching to “Ocular” mode
-
3.
In “Acquisition” mode click on the “open” symbol to load a preexisting setting (Fig. 8). If no setting has been saved, a new setting must be configured. This setting should contain at least one channel that can be used for tracking. If the fluorescent signal is expressed throughout the root, this channel suffices for tracking . If not, a separate PI channel should be acquired.
Fig. 8 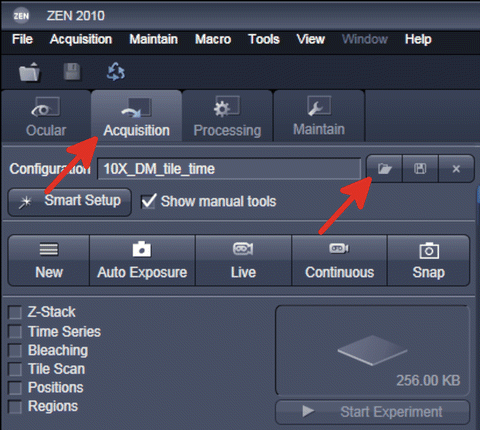
Switching to “Acquisition” mode
-
4.
Run “Zen Controller” from the Tools—Macro menu in the ZEN software (Fig. 9).
Fig. 9 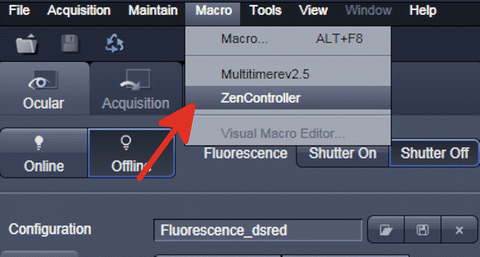
Opening “Zen controller”
-
5.
Run “Fiji” on the microscope-controlling computer.
-
6.
In “Fiji,” choose “Confocal Tracking” from the “Plug-ins” menu (Fig. 10).
Fig. 10 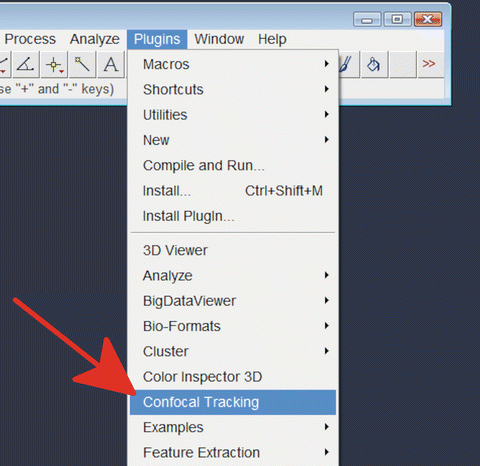
Starting “Confocal tracking ” plug-in
-
7.
Press “Start” at Zen Controller (Fig. 11) on the microscope-controlling computer.
Fig. 11 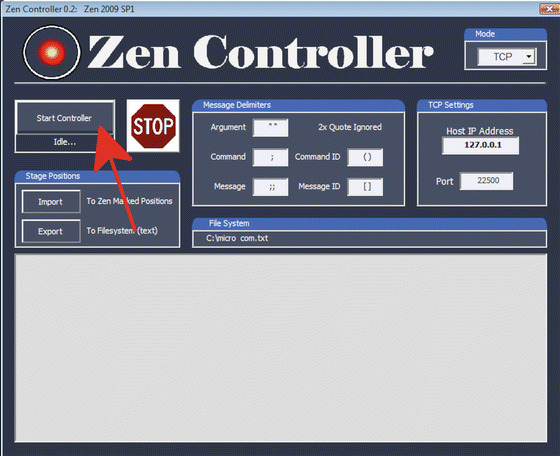
Starting Zen controller
-
8.
In the “General” tab of the “Confocal tracking” Fiji plug-in, select the “Tcp” button, create an output folder in which the resulting images will be stored, and set overlap percentage to 15 (Fig. 12).
Fig. 12 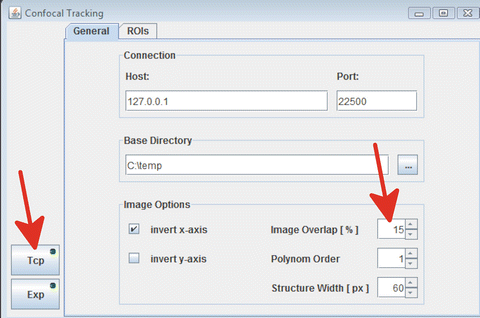
Confocal tracking , general set up
-
9.
In the “ROIs” tab of the “Confocal tracking” Fiji plug-in, give a prefix name that is used to denote the files of the experiment (Fig. 13).
Fig. 13 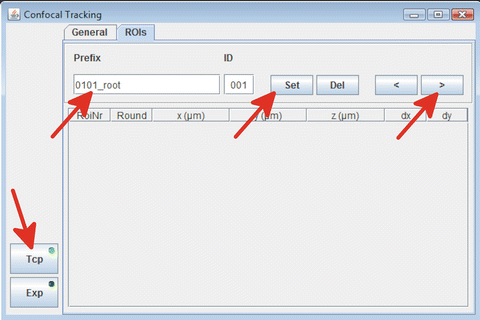
Setting up positions for imaging
-
10.
In the Zen software, use the “live” image acquisition and operate the microscope to focus on the center of the first root tip.
-
11.
In the “ROIs” tab of the “Confocal tracking” Fiji plug-in, press the “set” button to save the position.
-
12.
Move to the center of the next root tip using Zen and the microscope .
-
13.
In the “ROIs” tab of the “Confocal tracking ” Fiji plug-in, press the arrow pointing to the right and then press “set” button to save the position of the current root.
-
14.
Repeat steps 12 and 13 until all positions have been defined and then press the “Exp” button to start the experiment.
-
15.
For stopping the experiment, press the “Exp” button and wait until the acquisition of the last image has finished. Save the automatically generated log.txt file into the output folder. The images will be saved in the “Output” folder in a TIFF format.
-
16.
To assemble the time-lapse images from the individual images, start the “Confocal stitching” plug-in in Fiji (Fig. 14).
Fig. 14 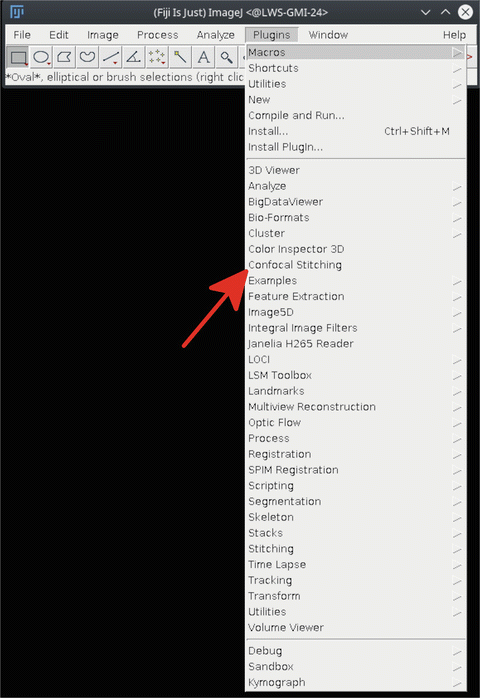
Starting the “Confocal stitching” plug-in
-
17.
Open the output files in the plug-in by clicking on “Select image directories” and the log.txt file by clicking on the “Select” button. Press “Stitch” to stitch the images (Fig. 15) and generate a “movie” from the stitched images, which will be saved in the output folder in TIFF format and can be opened with Fiji for further analysis.
Fig. 15 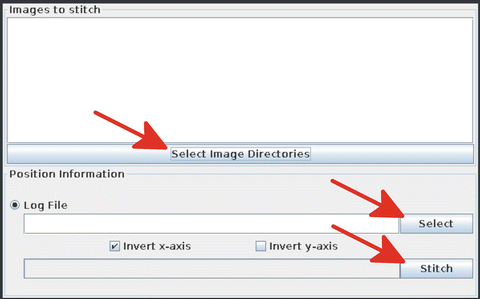
Selecting image directories


4 Notes
-
1.
The pH value can decrease by 0.5 after autoclaving.
-
2.
It is important that all seeds are exposed to the gas. That is why 2 mL tubes are better that 1.5 mL, since the round bottom allows better exposure. For the same reason, the seed number must not exceed 300 seeds.
-
3.
For Arabidopsis thaliana seeds, the sterilization time can be from several hours to overnight.
-
4.
Roots can be stained for 30 s with 0.15 mM (0.1 mg/mL) PI and washed in tap water before transfer to the gel for better visualization of root cells. However, this will not improve tracking efficiency if the signal of interest is too weak.
-
5.
Plastic forceps can be used as additional aid for detaching the gel.
References
Busch W et al (2012) A microfluidic device and computational platform for high-throughput live imaging of gene expression. Nat Methods 9(11):1101–1106
Schindelin J et al (2012) Fiji: an open-source platform for biological image-analysis. Nat Methods 9(7):676–682
Murashige T, Skoog F (1962) A revised medium for rapid growth and bioassays with tobacco tissue cultures. Physiol Plant 15:473–449
Miché L, Balandreau J (2001) Effects of rice seed surface sterilization with hypochlorite on inoculated Burkholderia vietnamiensis. Appl Environ Microbiol 67(7):3046–3052
Acknowledgment
We wish to thank all Busch lab members for support and helpful discussions, especially Ceren Tabak for taking pictures of the confocal chamber preparation. We thank Matt Watson for manuscript editing. This work was supported by funds from the Austrian Academy of Sciences through the Gregor Mendel Institute and an FWF stand-alone project (P27163-B22).
Author information
Authors and Affiliations
Corresponding author
Editor information
Editors and Affiliations
Rights and permissions
Copyright information
© 2017 Springer Science+Business Media LLC
About this protocol
Cite this protocol
Stoeva, D., Göschl, C., Corliss, B., Busch, W. (2017). Long-Term Confocal Imaging of Arabidopsis thaliana Roots for Simultaneous Quantification of Root Growth and Fluorescent Signals. In: Busch, W. (eds) Plant Genomics. Methods in Molecular Biology, vol 1610. Humana Press, New York, NY. https://doi.org/10.1007/978-1-4939-7003-2_12
Download citation
DOI: https://doi.org/10.1007/978-1-4939-7003-2_12
Published:
Publisher Name: Humana Press, New York, NY
Print ISBN: 978-1-4939-7001-8
Online ISBN: 978-1-4939-7003-2
eBook Packages: Springer Protocols