
Abstract
Foodborne pathogens are responsible of foodborne diseases and food poisoning and thus pose a great threat to food safety. These microorganisms can adhere to surface and form a biofilm composed of an extracellular matrix. This extracellular matrix protects bacterial cells from industrial environmental stress factors such as cleaning and disinfection operations. Moreover, during these environmental stresses, many bacterial species can enter a viable but nonculturable (VBNC) state. VBNC cells are characterized by a loss of cultivability on conventional bacteriological agar. This leads to an underestimation of total viable cells in environmental samples, and thus poses a risk for public health. In this chapter, we present a method to detect viable population of foodborne pathogens in industrial environmental samples using a molecular method with a combination of propidium monoazide (PMA) and quantitative PCR (qPCR) and a fluorescence microscopic method associated with the LIVE/DEAD BacLight™ viability stain.
1 Introduction
To reduce and prevent the presence of pathogen bacteria in the processing environment and in the food products, it is important to determine the main source of contamination and to use the best methods to detect and quantify potential viable pathogen bacteria present in food and environment samples. Among these methods, the microbiological methods are often limited by the culture media, which are specific neither to the analyzed products nor to the bacterial species. The current detection methods include conventional culturing and biochemical analysis and take at least from 2 to 10 days for result delivery according to the bacteria species. For example, Midelet-Bourdin et al. [1] compared the international reference microbiological method EN ISO 11290-1 and 11290-2 and internal microbiological methods for detection and enumeration of viable cultivable (VC) L. monocytogenes in seafood products. They showed that the reference method detected more positive samples for Listeria monocytogenes from smoked salmon and herb-flavored slices of smoked salmon than did the intern method. Furthermore, the pathogen bacteria can enter in a viable but nonculturable state (VBNC) under certain stress or environmental conditions (temperature, pH, salt, cleaning–disinfection procedures, …) that can be encountered during manufacturing processes [2]. Currently, these VBNC bacteria cause a significant issue for human health because they can be potentially pathogenic when environmental conditions became favorable and cannot be detected by conventional microbiological techniques [3]. In addition, according to Fricker et al. [4], the sensitivity of these methods would be lower than that of DNA-based methods, resulting in a high rate of false negative results. Therefore, there is a need to develop rapid, sensitive, and specific methodologies to quantify viable pathogen bacteria cells in food environment samples. The development of the PCR based quantitative (qPCR) method has reduced the analysis time of foodborne bacterial pathogens detection in food samples compared to conventional microbiological methods. Recently, qPCR techniques have been developed by designing of TaqMan® probes and using SYBR Green I that binds to DNA. However, the use of this molecular method is hampered by its inability to distinguish DNA signals coming from viable population (VC and VBNC) or from dead population resulting in a high rate of false positive results. To differentiate between viable and dead populations, several strategies have been used in molecular quantification methods. Recent development of photoreactive binding dyes, ethidium monoazide (EMA) or propidium monoazide (PMA) offers a promising alternative way to differentiate dead from viable populations [5, 6]. When a EMA or PMA solution is added to a mixture of intact and membrane-compromised bacterial cells, the chemical dye can selectively enter only the damaged cell membrane and bind to DNA while the DNA from intact cells is unstained. The unstained DNA from viable bacteria is amplified by PCR while the DNA from dead bacteria cannot be amplified. It has been successfully used, for instance, for selective quantification of viable L. monocytogenes population in biofilm after mechanical and chemical treatments applied in industrial environment [7]. PMA-PCR is unable to detect bacteria inactivated by conditions that do not directly target the cell membrane, like UV light irradiation and low pasteurizing milk treatment [8]. Besides PMA-qPCR methods, another common method based on the differential staining and direct microscopy can be used. The staining can be performed with the Live/Dead BactLight™ kit containing a green fluorescent dye (SYTO-9) that penetrates all cells and a red fluorescent dye (propidium iodide) that penetrates damaged membrane bacteria. As a result, dead and damaged cells appear green while cultivable and VBNC cells appear red by fluorescence microscopy observations. This chapter presents the use of the bacterial cell Live/Dead staining and PMA-qPCR assay with SYBR Green I technology to detect the viable foodborne bacterial pathogens in industrial environment samples with a special regard to L. monocytogenes as an illustrative example.
2 Materials
2.1 Industrial Environment Sampling
-
1.
Sterile gloves.
-
2.
Stick-mounted sponge supplied in sterile bag (see Note 1).
2.2 PMA Treatment and DNA Extraction
-
1.
Gloves .
-
2.
50 mL centrifuge tubes.
-
3.
DNA Lobind DNA/RNA/Protein tubes 1.5 mL.
-
4.
Ethidium monoazide (EMA) or propidium monoazide (PMA) stock solution (see Note 2).
-
5.
Light source (see Note 3).
-
6.
DNA extraction kit (see Note 4).
-
7.
Centrifuge.
-
8.
Vortex.
2.3 Quantitative PCR
-
1.
Gloves.
-
2.
Pipette tips.
-
3.
DNA Lobind DNA/RNA/Protein tubes 1.5 mL.
-
4.
Forward and reverse primers (see Notes 5 and 6). NovF (5′-TGC AAG TCC TAA GAC GCC A-3′) and NovR (5′-CAC TGC ATC TCC GTG GTA TAC TAA-3′) were used for L. monocytogenes.
-
5.
Ultrapure DNase/RNase-free distilled water.
-
6.
Mastermix solutions (see Note 7).
-
7.
Template DNA (see Note 8).
-
8.
Centrifuge for PCR microtubes (1.5–2 mL) or 96-well polypropylene plates.
-
9.
PCR Lobind DNA/RNA/Protein microtubes or 96-well polypropylene plates.
-
10.
Quantitative PCR instruments with integrated analysis software from Cq extraction from fluorescence qPCR curves (see Note 9).
2.4 Microscopy Observations
-
1.
LIVE/DEAD® BacLight™ bacterial viability kits (Invitrogen).
-
2.
Borosilicate glass tubes 16 × 150 mm (15 mL).
-
3.
Aluminum paper.
-
4.
Sterile distilled water.
-
5.
Fluorescence microscope (here, Imager.Z1, Zeiss connected with ApoTome and CCD camera Axiocam MRm, Zeiss) with suitable excitation source and emission filters for LIVE/DEAD® BacLight™ observations of bacteria.
3 Methods
3.1 Industrial Environment Sampling
-
1.
Remove aseptically the stick-mounted sponge of the bag with sterile gloves and swab the surface sampling (see Note 1).
-
2.
Turn sponge over and change direction at 90° to swab the same surface sampling.
-
3.
Place the sponge into bag up, bend stick to break, and discard it.
-
4.
Stomacher (1 min).
-
5.
Press the bag with the sponge and collect the supernatant in 50 mL centrifuge tube (volume of about 10 mL).
3.2 PMA Treatment and DNA Extraction
-
1.
Centrifuge the supernatant in 50 mL centrifuge tube at 5000 × g for 5 min at room temperature.
-
2.
Resuspend the pellet (cell fraction) in 495 μL of sterilized saline water in DNA Lobind DNA/RNA/Protein tubes 1.5 mL.
-
3.
Centrifuge the tube of PMA stock solution at 8000 × g for 10 s (see Note 2).
-
4.
Add to the 495 μL cell fraction, the appropriate volume of PMA stock solution (e.g., for 50 μM of final concentration, 5 μL of 5 mM stock solution in 495 μL).
-
5.
Vortex for 10 s.
-
6.
Incubate for 5 min at room temperature in the dark.
-
7.
Vortex for 10 s.
-
8.
Subject the cell fraction to light exposure using a light source during 10 min (see Note 3).
-
9.
Centrifuge cell fraction at 5000 × g for 10 min. If no pellet is visible, centrifuge again at maximum speed for 5 min.
-
10.
Extract genomic DNA with the DNA extraction kit according to the recommendations provided by the supplier (see Note 4).
-
11.
Store the template DNA for short time at +4 °C and for long time at −20 °C or −80 °C to maintain DNA integrity. Avoid multiple freeze-thaw cycles to reduce loss of DNA template.
3.3 Quantitative PCR
-
1.
Place all solutions of mastermix, primers, and template DNA on ice (see Notes 5–7).
-
2.
Mix gently and then briefly centrifuge all solutions after thawing if needed.
-
3.
Prepare a reaction mastermix by adding the different solutions in Lobind DNA/RNA/Protein tubes 1.5 mL (see Table 1).
Table 1 qPCR mix preparation for one sample -
4.
Mix and dispense appropriate volumes of mastermix into qPCR Lobind DNA/RNA/Protein microtubes or 96-well polypropylene plates.
-
5.
Add template DNA in qPCR Lobind DNA/RNA/Protein microtubes or per well of plate. For each qPCR assay, include a positive control tube or well (template DNA targeted) and a negative control (no template DNA) (see Note 8).
-
6.
Cap the qPCR Lobind DNA/RNA/Protein microtubes or seal the well of the 96-well polypropylene plates according to instrument requirements.
-
7.
Mix gently the qPCR Lobind DNA/RNA/Protein microtubes or the 96-well polypropylene plates and centrifuge 10 s if needed to concentrate drops in the bottom of the tube.
-
8.
Place the qPCR Lobind DNA/RNA/Protein microtubes or the 96-well polypropylene plates in the qPCR instrument, program the thermal cycler according instrument manufacturer recommendations and start the program (see Note 9, Table 2).
Table 2 Thermal cycler qPCR program in three-steps for L. monocytogenes
3.4 qPCR Data Interpretation
-
1.
Cycle threshold (Cq) values were automatically calculated using integrated software of the PCR cycler by the second derivative method from qPCR fluorescence curves (Fig. 1a).
Fig. 1 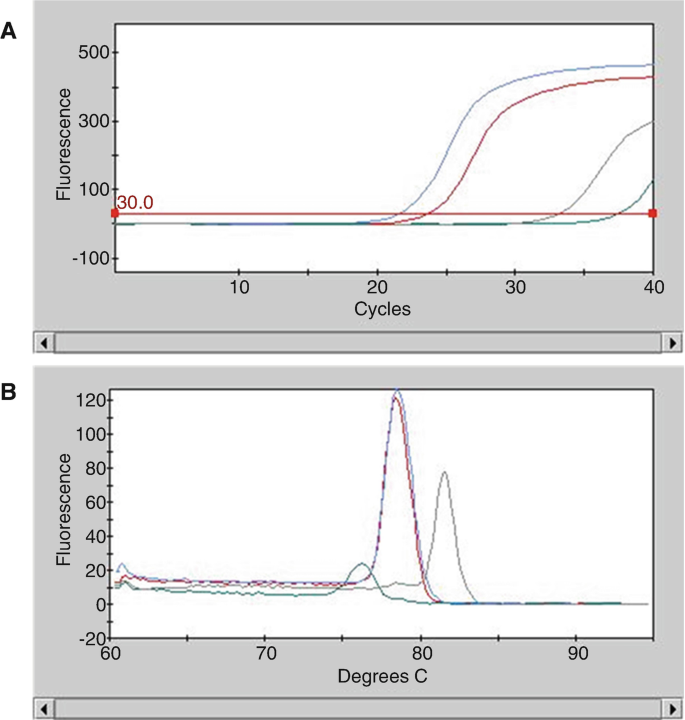
Examples of qPCR results with a negative control (green curve), a positive control (red curve), a positive sample (blue curve), and a negative sample (grey curve). (a) Quantification cycles from qPCR assay (Cq) and (b) Melting curves (Tm) from qPCR assay
-
2.
Check the absence of a Cq signal (or a late Cq signal, i.e., usually beyond 35 cycles) in the negative control (Fig. 1 a, b, green curve) (see Note 10).
-
3.
Verify the correct amplification of the positive control at the expected melting temperature (Tm) (red curve).
-
4.
For samples with a Cq value (blue curve and grey curve), these samples should generate a similar Tm compare to the positive control (blue curve) to be considered positive, if the Tm is different (grey curve), the sample is considered negative (see Note 11) as the product PCR is not considered specific (Fig. 1).

3.5 Microscopy Observations
-
1.
Prepare a 2× working solution of the LIVE/DEAD® BacLight™ staining reagent mixture by dissolving the contents of one Component A pipet (containing yellow-orange solids) and one Component B pipet (containing red solids) in 5 mL of sterile distilled water in borosilicate glass tubes.
-
2.
Protected from light the borosilicate glass tubes by wrapping the tube in aluminum paper or a commercially available light-retardant wrap.
-
3.
Placed 1 mL of the 2× working solution of the LIVE/DEAD® Bac Light™ staining reagent mixture on the contaminated surface.
-
4.
Incubate the sample at room temperature in the dark for 15 min.
-
5.
Rinse the surface with sterile distilled water to remove excess dye.
-
6.
Observe in a fluorescence microscope equipped with any of the filter sets recommanded by the supplier (see Note 12).
-
7.
Cross-analyze results obtained from PMA-qPCR and microscopic observations to get a representative view of cell viability in studied samples (see Fig. 2).
Fig. 2 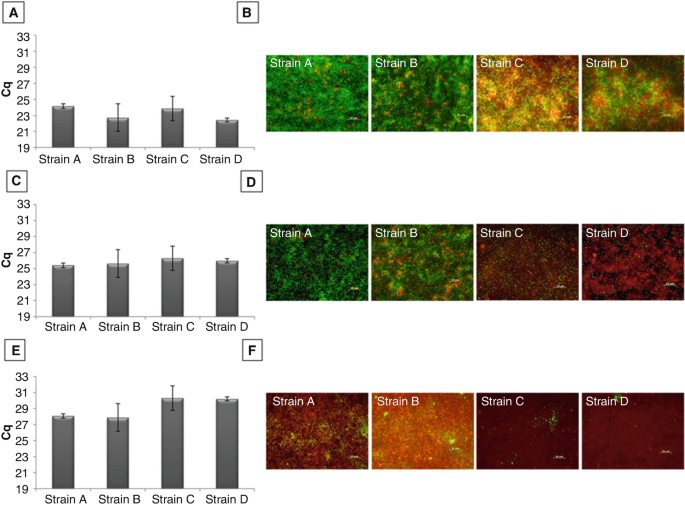
Detection and microscopic observations of viable population from 48 h biofilm of L. monocytogenes cultivated on stainless steel during 48 h (a, b), after treatment with a water flow water flow (c, d), and NaOH flow (e, f). The amount of adherent bacteria was detected by PMA-qPCR (Fig. 2a, c and e) and by epifluorescence microscopy associated to LIVE/DEAD staining (Fig. 2b, d, and f). Cq value varied between studied strains (from 22.44 for D strain to 24.17 for A strain). These differences in Cq indicated a variable quantity of viable cells in 48 h biofilm. The microscopic observations confirmed the presence of viable bacteria stained in green (Fig. 2b). There were dead cells stained in red which were in greater number for C and D strains than for A and B strains. After the application of water flow on the 48 h biofilm, we observed that the viable population of all strains were not detached (Cq around 25.5) (Fig. 2c). However, the microscopic observations indicated an important difference between strains with much more residual viable cells for A and B strains than for C and D strains. After the application of the NaOH flow, the Cq values increased that indicated the detachment of the bacterial cells but also the resistance of a part of the viable population with a difference between the strains studied (Fig. 2e). These differences are found in the microscopic observations as well (Fig. 2f)

4 Notes
-
1.
The stick-mounted sponge, described in this chapter, is an arbitrary choice among the recovering methods recommended by the international standard ISO 18593:2004 that recommends also the gauze pad, the swab or the contact agar as bacterial recovering methods. Stick-mounted sponges are usually contained in a bag with 10 mL of Buffered Peptone Water Broth and Neutralizing Buffer. For sampling of surfaces after cleaning and disinfection operations, the addition of the neutralizing buffer allows to stop the bactericidal activity of residual concentrations of biocides that could be remained on these surfaces, even after a rinsing step of surface, and avoid an overestimation of biocide efficacy.
-
2.
PMA use is preferred because EMA is capable of penetrating membrane intact viable cells leading to false negative results and is much more toxic for many bacterial species. PMA is commercially available either in powder or directly dissolved in ultrapure DNase/RNase-free distilled water. PMA in powder should be stored at 4 °C or −20 °C and protected from light. When stored as recommended, the dye is stable for at least 1 year from the date of receipt. To prepare a stock solution, dissolve PMA powder in ultrapure DNase/RNase-free distilled water by respecting the safety instructions of handling. When the PMA is in solution, it can be stored at −20 °C for at least 6 months without modifying the final concentration of PMA solution. PMA binds to DNA and covalently cross-links to the DNA upon light exposure. The best PMA concentration found in several publications is 50 μM but PCR efficiency depends on different other factors like bacteria concentration, food or environmental samples, length of PCR product, light exposure conditions, and ratio between viable and dead bacteria [7, 9,10,11]. Therefore, PMA concentration has to be optimized for each project.
-
3.
For DNA light exposure, you could use a halogen light source: lay tubes on a block of ice and set them at 20 cm from the light source. Set the lamp so that the light source is pointing directly downward onto the samples (up to 45° downward slant is OK). Put a piece of aluminum sheet under the tube to reflect the light. For blue LED photoactivation commercial systems, such as the PhASt Blue system (GenIUL), follow the manufacturer’s instructions for light exposure of samples. For optimization, time of exposure between 2 and 10 min has to be optimized. Operating conditions are more easily standardized with LED photoactivation than halogen light exposure.
-
4.
A phenol-chloroform extraction was the first method to isolate RNA, DNA or proteins but the products are both toxic and therefore has to be handled with collective or individual security protection. The current commercial extraction kits including a step of DNA purification were less toxic products and easy to use. For example, there are DNA extraction methods consist of binding of DNA by silica beads and resin, washing steps and a final elution steps to have purified DNA. Other DNA extraction techniques were physically or mechanically [12] but the extracted DNA was not purified and may contain PCR inhibitors or PMA residues. PMA has a power of inhibition since it can bind to Taq polymerase and block PCR amplification
-
5.
Designing high-quality primers is one of the most crucial factors to obtain efficient amplification with high efficiency rate (classically, between 85 and 105%). Perform the qPCR assay using primers against an appropriate genomic DNA target for your organism of interest. Specific primers can be designed using primer design software which also allows limiting the formations of primer-dimers and secondary structures. High concentrations of primers increase the risk of primer-dimer formations and nonspecific product formations, which are critical in using SYBR Green I dye in qPCR. On the contrary, lower primer concentrations decrease qPCR sensibility. It is therefore important to optimize the concentration of primers used [13].
-
6.
Primers can be dissolved in TRIS-EDTA 1 mM pH 7 (optimal) buffer or ultrapure DNase/RNase-free distilled water. They are stable for several years if stored at −20 °C. A tip is use to dissolve directly the lyophilized primer at the working concentration and aliquot them into several microtubes in a small volume (e.g., 50 nM distributed by 200 μL). Avoid freeze/thaw cycles that can cause mechanical breakage of primers and thus damage them leading to reduction of sensitivity and efficiency of PCR assay. The aliquot in use should not be refrozen, just store it not more than 1 month at 4 °C. The primers NovR and NovF used for L. monocytogenes detection are previously published [14].
-
7.
Mastermixes typically contain dNTPs, a Taq DNA polymerase, MgCl2, and stabilizers. SYBR Green I, ROX™, fluorescein, and inert loading dyes may also be included, depending on the detection chemistry, instrument, and reaction requirements. The PCR buffer components and stabilizers are typically proprietary to the manufacturer. If purchased separately, maximum flexibility is possible, since each ingredient can be individually optimized in the reaction [13]. SYBR Green I is a DNA intercalant agent considered potentially mutagenic and therefore dangerous for health. It has to be handled by respecting safety instructions recommended by the manufacturer.
-
8.
It is interesting to dilute DNA in function of the DNA extraction methods used to decrease or eliminate the presence of inhibitors of PCR reactions.
-
9.
Many qPCR instruments are commercially available. Each instrument has different technical specifications and performance.
-
10.
Sometimes, positive samples may be counted as negative due to too many inhibitors in the sample or a defect in PMA-qPCR assay. To answer this problem, it is possible to integrate in your PCR reactions an internal amplification control (IAC) which will avoid to find false-negative results and to confirm that negative results are true negative results.
-
11.
For this, it is necessary to use a standard curve which will represent the Cq values obtained experimentally as a function of the log of the concentrations in target pathogens DNA, resulting from series of dilutions of a standard sample. The value of Cq is inversely proportional to the log of the initial concentration of target pathogens DNA. The Cq obtained from a sample of unknown concentration will thus be translated into a concentration of target pathogens DNA using the standard straight line. During qPCR technique optimization, you could confirm the results by verifying the PCR products in an electrophoresis gel or directly by sequencing the PCR products.
-
12.
After staining, do not place slide glass on the contaminated surface as you may unstructured the biofilm and observe architectural artifacts. Similarly, the dehydration of the contaminated surface can change the biofilm architecture. Be sure to make your observations on hydrated regions of the contaminated surface.
References
Midelet-Bourdin G, Leleu G, Malle P (2007) Evaluation of the international reference methods NF EN ISO 11290-1 and 11290-2 and an in-house method for the isolation of Listeria monocytogenes from retail seafood products in France. J Food Prot 70:891–900
Besnard V, Federighi M, Declerq E, Jugiau F, Cappelier JM (2002) Environmental and physico-chemical factors induce VBNC state in Listeria monocytogenes. Vet Res 33(4):359–370
Besnard V, Federighi M, Cappelier JM (2000) Evidence of viable but non-culturable state in Listeria monocytogenes by direct viable count and CTC-DAPI double staining. Food Microbiol 17(6):697–704
Fricker M, Messelhausser U, Busch U, Scherer S, Ehling-Schulz M (2007) Diagnostic real-time PCR assays for the detection of emetic Bacillus cereus strains in foods and recent food-borne outbreaks. Appl Environ Microbiol 73(6):1892–1898
Nocker A, Camper AK (2009) Novel approaches toward preferential detection of viable cells using nucleic acid amplification techniques. FEMS Microbiol Lett 291(2):137–142
Fittipaldi M, Codony F, Adrados B, Camper AK, Morato J (2011) Viable real-time PCR in environmental samples: can all data be interpreted directly? Microb Ecol 61(1):7–12
Brauge T, Faille C, Sadovskaya I, Charbit A, Benezech T, Shen Y, Loessner MJ, Bautista JR, Midelet-Bourdin G (2018) The absence of N-acetylglucosamine in wall teichoic acids of Listeria monocytogenes modifies biofilm architecture and tolerance to rinsing and cleaning procedures. PLoS One 13(1):e0190879. https://doi.org/10.1371/journal.pone.0190879
Yang X, Badoni M, Gill CO (2011) Use of propidium monoazide and quantitative PCR for differentiation of viable Escherichia coli from E. coli killed by mild or pasteurizing heat treatments. Food Microbiol 28(8):1478–1482. https://doi.org/10.1016/j.fm.2011.08.013
Li B, Chen JQ (2013) Development of a sensitive and specific qPCR assay in conjunction with propidium monoazide for enhanced detection of live Salmonella spp. in food. BMC Microbiol 13:273. https://doi.org/10.1186/1471-2180-13-273
Scariot MC, Venturelli GL, Prudencio ES, Arisi ACM (2018) Quantification of Lactobacillus paracasei viable cells in probiotic yoghurt by propidium monoazide combined with quantitative PCR. Int J Food Microbiol 264:1–7. https://doi.org/10.1016/j.ijfoodmicro.2017.10.021
Pan Y, Breidt F (2007) Enumeration of viable Listeria monocytogenes cells by real-time PCR with propidium monoazide and ethidium monoazide in the presence of dead cells. Appl Environ Microbiol 73(24):8028–8031
Brauge T, Faille C, Inglebert G, Dubois T, Morieux P, Slomianny C, Midelet-Bourdin G (2018) Comparative evaluation of DNA extraction methods for amplification by qPCR of superficial vs intracellular DNA from Bacillus spores. Int J Food Microbiol 266:289–294. https://doi.org/10.1016/j.ijfoodmicro.2017.12.012
Bustin SA, Benes V, Garson JA, Hellemans J, Huggett J, Kubista M, Mueller R, Nolan T, Pfaffl MW, Shipley GL, Vandesompele J, Wittwer CT (2009) The MIQE guidelines: minimum information for publication of quantitative real-time PCR experiments. Clin Chem 55(4):611–622. https://doi.org/10.1373/clinchem.2008.112797
Nogva HK, Rudi K, Naterstad K, Holck A, Lillehaug D (2000) Application of 5′-nuclease PCR for quantitative detection of Listeria monocytogenes in pure cultures, water, skim milk, and unpasteurized whole milk. Appl Environ Microbiol 66(10):4266–4271
Acknowledgments
Part of this work was supported by a grant from the CPER (Contrat de Plan Etat Région Nord-Pas de Calais, axe qualité et sécurité des ressources aquatiques).
Author information
Authors and Affiliations
Corresponding author
Editor information
Editors and Affiliations
Rights and permissions
Copyright information
© 2019 Springer Science+Business Media, LLC, part of Springer Nature
About this protocol

Cite this protocol
Brauge, T., Midelet-Bourdin, G., Soumet, C. (2019). Viability Detection of Foodborne Bacterial Pathogens in Food Environment by PMA-qPCR and by Microscopic Observation. In: Bridier, A. (eds) Foodborne Bacterial Pathogens. Methods in Molecular Biology, vol 1918. Humana, New York, NY. https://doi.org/10.1007/978-1-4939-9000-9_9
Download citation
DOI: https://doi.org/10.1007/978-1-4939-9000-9_9
Published:
Publisher Name: Humana, New York, NY
Print ISBN: 978-1-4939-8999-7
Online ISBN: 978-1-4939-9000-9
eBook Packages: Springer Protocols