
Abstract
In recent years, various isothermal amplification techniques have been developed as alternatives to polymerase chain reaction (PCR). The integration of isothermal amplification with electrical or electrochemical devices has enabled high-throughput nucleic acid-based assays with high sensitivity. We performed solid-phase rolling circle amplification (RCA) on the surface of a Au electrode, and detected RCA products in situ using chronocoulometry (CC) with [Ru (NH3)6]3+ as the signaling molecule. Detection sensitivity for DNA and a microRNA (miR-143) was 100 fM and 1 pM, respectively. Furthermore, we conducted potentiometric DNA detection using an ethidium ion (Et+)-selective electrode (Et+ISE) for real-time monitoring of isothermal DNA amplification by primer-generation RCA (PG-RCA). The Et+ISE potential enabled real-time monitoring of the PG-RCA reaction in the range of 10 nM–1 μM of initial target DNA. Devices based on these electrochemical techniques represent a new strategy for replacing conventional PCR for on-site detection of nucleic acids of viruses or microorganisms.
You have full access to this open access chapter, Download protocol PDF
1 Introduction
Nucleic acid amplification for detection of DNA or RNA is an indispensable technique in many fields of life science, with applications ranging from molecular diagnosis of bacterial or viral species in blood or food to clinical studies on tumors or other diseases in the context of personalized medicine. The development of real-time monitoring of the polymerase chain reaction (PCR) represented a major breakthrough in quantitative detection of nucleic acids. Most current real-time PCR systems employ fluorescence-based detection using intercalating reagents (e.g., SYBR Green) or sequence-specific reporter probes to quantitate amplified PCR products. The resulting curve of fluorescence intensity enables measurement of nucleic acid concentration over a wide range (8 orders of magnitude) with high sensitivity (<5 copies) and high precision (<2% standard deviation). Over the last few decades, several infectious diseases have emerged, including AIDS, SARS, influenza, and Ebola; these illnesses threaten the lives and health of people around the world. Consequently, global efforts are being made to control and monitor these emerging infectious diseases. In one approach within this broad strategy, miniaturized nucleic acid amplification systems have been intensively studied as alternatives for point-of-care testing. However, optical detection schemes limit the miniaturization of the total PCR system , and the addition of exogenous fluorescent reagents sometimes inhibits the DNA polymerase. Because they require minimal instrumentation and low electrical power, however, electrical/electrochemical detection methods provide promising alternative detection schemes that could overcome these issues in the context of point-of-care testing devices [1, 2]. Furthermore, non-optical sensing devices can be easily fabricated using fine processing technology, and highly integrated sensor arrays can be realized using the advanced complementary metal-oxide-semiconductor (CMOS) process .
P. Bergveld created the first ion-sensitive field-effect transistor (ISFET) -based biosensor in 1970 [3]. ISFET (ion-sensitive field-effect transistor) biosensors are composed of sensor surfaces functionalized by immobilization of probe biomolecules used as transducers/detectors. Various types of bioanalytes can be coupled with ISFETs such as genetic ISFETs, cell-ISFETs, or immuno-ISFETs. ISFETs take advantage of the fact that field effect transistors (FETs ) change their source-drain “channel” conductivity depending on the electric field of their environment. Essentially, the output signal is a gate voltage or drain current that changes charge density on the gate surface before/after the molecular recognition event. One of the most successful examples of commercialized products exploiting these technologies is the Ion Torrent (Thermo Fisher Scientific) semiconductor chip-based DNA sequencer, launched in 2012 [4–6]. As shown in Fig. 1, millions of ion-sensitive field-effect transistors (ISFETs), which detect released protons during PCR, are integrated in a chip with a well structure. Template DNA strands are immobilized on the surface of microbeads, which are captured into the well structures. After single-base synthesis by DNA polymerase, the resulting pH change is detected by pH-sensitive ISFET to confirm the extension reaction. ISFETs have also been used as detectors for real-time PCR, replacing fluorescence detection. However, the electrical properties of ISFETs change significantly during PCR thermal cycles . To overcome this problem, current work has focused on combining of isothermal nucleic acid amplification (rather than PCR) with electrical/electrochemical devices [7, 8]. There are several electrochemical nucleic acid detection methods employing amperometry, voltammetry, and AC-impedance. Solid-phase and solution-phase nucleic acid amplifications combined with electrochemical methods are summarized in the Ref. [9]. Intercalator- or redox marker-mediated electron transfer on the sensor surface is employed as a manner of electrochemical signal readout. For isothermal nucleic acid amplification combined with electrochemical measurement, loop-mediated isothermal amplification (LAMP) and rolling circle amplification (RCA ) are often used. Because these amplification processes are conducted by a strand-displacing DNA polymerase at a constant temperature, their performance is comparable to that of PCR. Thus, simpler, miniaturized high-throughput measurements for point-of-care testing devices could be realized by combining electro/electrochemical devices and isothermal nucleic acid amplification methods.

Commercially available transistor-based DNA sequencer. For sequencing on transistors, templates immobilized on the beads are amplified by emulsion PCR. One of the beads is captured in a well formed on the gate of a transistor, and then the proton released during the PCR is detected at the surface of the transistor (at the bottom of the well). (a) Schematic illustration of the sequencing mechanism and electron micrograph showing wells. (b) Ion chip on wafer, die, and chip packaging. Reproduced with permission from [5]
In this chapter, we describe quantitative detection of nucleic acids by monitoring the products of isothermal amplification using electrochemical devices, including our own research on this topic [10, 11].
2 Materials
2.1 Chronocoulometric microRNA Detection Combined with Rolling Circle Amplification (RCA)
-
1.
Ethylenediamine, N-(3-dimethylaminopropyl)-N′-ethylcarbodiimide hydrochloride, and 6-mercapto-1-hexanol (MCH) were purchased from Sigma-Aldrich Corp. (Shanghai, China).
-
2.
HAuCl4 and Na2SO3 were purchased from Sinopharm (Beijing, China).
-
3.
Na3Au(SO3)2 was purchase from Changzhou Institute of Chemical Research (Changzhou, China).
-
4.
Bovine serum albumin (BSA ) was purchased from Sangon (Shanghai, China).
-
5.
Exonuclease I and Exonuclease III were purchased from New England Biolabs (Beijing, China).
-
6.
TIANquick oligo DNA purification kit was purchased from Tiangen (Beijing, China).
-
7.
A chromium quartz mask photomask substrate was purchased from Changsha Shaoguang Inc. (Changsha, China).
-
8.
The circular probe was circularized using a commercially available ligation kit (CircLigase II ssDNA Ligase, Epicentre, China). MicroRNAs and DNA probes were purchased from Sangong (Shanghai, China); sequences are listed in Table 1.
Table 1 Sequences of DNA oligomers and microRNAs designed for RCA-CC device -
9.
NanoDrop 2000 spectrophotometer (Thermo Fisher Scientific Inc., Kanagawa, Japan) was employed for determination of nucleic acids concentration. CC was measured using AutoLab (PGSTAT302, Eco Chemie, Netherlands).
2.2 Real-Time DNA Amplification Monitoring Using Micro Et+sensor and Primer-Generation RCA (PG-RCA)
-
1.
Silicon tube (1.0 mm, inner diameter; 1.5 mm, outer diameter) purchased from Sanplatec Co., Ltd. (Osaka, Japan).
-
2.
Ag wire (0.5 mm diameter) from Nilaco Corporation (Tokyo, Japan) were used to fabricate Et+ISEs.
-
3.
A capillary tube (1.0 mm, inner diameter; 1.5 mm, outer diameter) for the small reference electrode was purchased from Sanyo Rikagaku Co., Ltd. (Tokyo, Japan).
-
4.
Ag/AgCl ink for the reference electrode was purchased from BAS Inc. (Tokyo, Japan).
-
5.
Potassium-tetrakis (4-chlorophenyl) borate (KTpClPB), Siloprene K1000, and Siloprene cross-linking agent K-11 were obtained from Sigma-Aldrich (St. Louis, MO).
-
6.
Tris–HCl buffer (pH 7.0) was purchased from Kanto Chemical (Tokyo, Japan).
-
7.
Ethidium bromide (EtBr), NaCl, MgCl2, Na2HPO4, citric acid, tetrahydrofuran super dehydrated stabilizer free (THF), and KCl (saturated solution) for electrodes were purchased from Wako Pure Chemical Industries Ltd. (Osaka, Japan).
-
8.
Agarose S tablet, 50× TAE (Tris acetate EDTA) and Gene Ladder Wide 1 were purchased from Nippon gene Co., Ltd. (Tokyo, Japan).
-
9.
CircLigase II 10× reaction buffer, 50 mM MnCl2, CircLigase II ssDNA ligase, and exonuclease I were purchased from Epicentre Biotechnologies (Madison, USA).
-
10.
10× NE buffer 2 (50 mM NaCl, 10 mM Tris–HCl, 10 mM MgCl2, 1 mM DTT (dithiothreitol)), phi29 DNA polymerase, and Nb.BbvCI nicking endonuclease were purchased from New England Biolabs Japan Inc. (Tokyo, Japan).
-
11.
6× Loading buffer and dNTP mixture (2.5 mM each) were bought from Takara Bio Inc. (Shiga, Tokyo).
-
12.
The circular probe was purified using the QIAquick Nucleotide Removal Kit (Qiagen, Tokyo, Japan).
-
13.
Oligo DNA for circular probe (PAGE-purified) was obtained from Nippon Gene Co., Ltd. (Tokyo, Japan).
-
14.
Target DNA (PAGE-purified) was obtained from Gene Design Inc. (Osaka, Japan). Sequences are listed in Table 2.
Table 2 Sequences of DNA oligomers used in PG-RCA -
15.
Potential measurements were performed using the open-circuit potential-time mode of the electrochemical analyzer, Model 660A (BAS Inc., Tokyo, Japan).
-
16.
The Ag/AgCl saturated KCl reference electrode and the Faraday cage were purchased from BAS Inc. (Tokyo, Japan).
-
17.
Thermal incubation was done in a mini dry bath incubator (Hangzhou Allsheng Instruments Co., Ltd., Zhejiang Province, China).
-
18.
The DNA concentration was determined using a NanoDrop 2000/2000c (Thermo Fisher Scientific Inc., Kanagawa, Japan) instrument.
-
19.
Agarose gel electrophoresis was performed using a Mupid®-exU (Takara Bio Inc., Shiga, Japan) system.
-
20.
The EtBr fluorescence on gels was measured with a 2UV transilluminator (BM Equipment Co., Ltd., Tokyo, Japan).
3 Methods
3.1 Chronocoulometric microRNA Detection Combined with Rolling Circle Amplification (RCA)
-
1.
Mask fabrication .
-
(a)
A chromium quartz mask was fabricated from a commercially available photomask substrate consisting of three layers (1 μm photoresist, 0.1 μm Cr, and 1.6 mm quartz, respectively) by photo lithography. Micro-patterns on the quartz substrate were formed by using standard photolithography previously reported [12]. The photo image was shown in Fig. 2.
Fig. 2 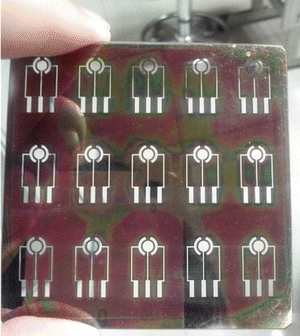
Picture of a chromium quartz mask
-
(a)
-
2.
Fabrication of three-gold electrode biosensors .
-
(a)
After a 63 × 63 × 1.6 mm polystyrene (PS) sheet was exposed to UV light (254 nm) for 6 h, the sheet was immersed for 3 h at room temperature in 100 mM phosphate buffer (pH 7.0) containing 360 mM ethylenediamine and 50 mM N-(3-dimethylaminopropyl)-N′-ethylcarbodiimide hydrochloride. The PS sheet was then rinsed with deionized water.
-
(b)
Subsequently, the partially aminated sheet was treated with 1 mM HAuCl4 solution for 2.5 h, and then with 0.1 M NaBH4 solution for 20 min. The gold–nanoparticle catalysts formed on the area exposed to UV light. To remove nonspecifically adsorbed gold species, the sheet was sonicated in 0.5 M KSCN solution for 20 min.
-
(c)
The activated PS sheet was submerged for 3 h in a gold-plating bath containing 0.125 M Na2SO3 and 8 mM Na3Au(SO3)2. After the sheet was rinsed with deionized water, the gold electrode formed on the PS sheet was baked at 80 °C for 1 h.
-
(a)
-
3.
Functionalization of gold electrode .
-
(a)
Before use, gold electrodes were subjected to electrochemical cleaning by cyclic voltammetry in 100 μL of 0.1 M H2SO4 using the following parameters: potential range, −0.5 to 1.0 V; scan rate, 1 V/s, 100 cycles.
-
(b)
The clean and dry gold substrate was immersed in 1 μM thiolated DNA probe 1 in I-Buffer (10 mM Tris–HCl, 1 mM EDTA, 0.1 M NaCl, 10 mM TCEP, pH 7.4) for 3 h at room temperature. After rinsing with Milli-Q water, the electrodes were immersed in 1 mM MCH for at least 2 h. Next, the electrodes were immersed in 1 mg/mL bovine BSA for 1 h to cover the active groups on the gold surface. Finally, the electrodes were rinsed with Milli-Q water and dried under nitrogen flow.
-
(c)
The surface density of DNA probe 1 was characterized using CC and calculated from Eqs. (1) and (2). The value was determined in the range 1 × 10¹²–6 × 10¹² molecules per cm2.
-
(a)
-
4.
Circular probe preparation .
-
(a)
A mixture containing 1 μM circular probe, reaction buffer, 205 mM MnCl2, and 5 U/μL CircLigase II ssDNA Ligase was incubated at 60 °C for 1 h. To inactivate the ligase, the mixture was subsequently incubated at 80 °C for 20 min.
-
(b)
To remove the remaining linear sequence, 10 U Exonuclease I and 100 U Exonuclease III were added to the mixture, which was incubated at 37 °C for 2 h. To inactivate the exonucleases, the mixture was subsequently incubated 80 °C for 20 min.
-
(c)
The ligated circular probe was purified using the TIANquick oligo DNA purification kit and quantified using a NanoDrop 2000 spectrophotometer.
-
(a)
-
5.
microRNA detection by CC and solid-phase RCA.
-
(a)
CC measurement was performed using two step potential method (from 500 to 0 mV at 50 mV/s) at room temperature. The measurement buffer was 10 mM Tris–HCl (pH 7.4) containing 50 μM RuHex.
-
(b)
In CC measurement, the Cottrell equation can be adapted when the fast electrode reaction is diffusion-limited. The charge Q, as a function of time t, can be expressed by the integrated Cottrell equation (Eq. (1)).
$$ Q=2\mathrm{F} nA{C}^{\mathrm{b}}{\left(\raisebox{1ex}{$ Dt$}\!\left/ \!\raisebox{-1ex}{$\pi $}\right.\right)}^{\raisebox{1ex}{$1$}\!\left/ \!\raisebox{-1ex}{$2$}\right.}+{Q}_{\mathrm{c}}+{Q}_{\mathrm{ads}} $$(1)where F is the Faraday constant, n the number of electrons involved in electrode reaction, A the electrode area (cm2), C b the bulk concentration (mol/cm3), D the diffusion coefficient (cm2/s), t the time (s), Q c the capacitive charge (coulomb), and Q ads the charge produced by the adsorbed reactant. From Faraday’s law, Q ads can be expressed by Eq. (2).
$$ {Q}_{\mathrm{ads}}= nFA\varGamma $$(2)where Γ is quantity of adsorbed reactant (mol/cm2). One mole of ruthenium (III) hexammine (RuHex), a cationic redox marker, can electrostatically trap three moles of nucleic acid phosphate groups. In the presence of RuHex, CC gives a direct signal proportional to the number of nucleic acid phosphate groups at the electrode surface. Typical CC data was shown in Fig. 3.
Fig. 3 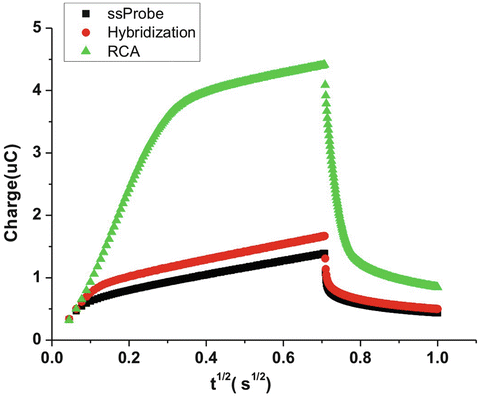
Typical chronocoulometry plot of immobilization of a single stranded DNA probe on gold electrodes (black plots), hybridization with 10 nM of target molecules (red plots) and 4-h RCA amplification (green plots)
-
(c)
A mixture containing 1 μM circular probe, reaction buffer, 205 mM MnCl2, and 5 U/μL CircLigase II ssDNA Ligase was incubated at 60 °C for 1 h. To inactivate the ligase, the mixture was subsequently incubated at 80 °C for 20 min.
-
(d)
To remove the remaining linear sequence, 10 U Exonuclease I and 100 U Exonuclease III were added to the mixture, which was incubated at 37 °C for 2 h. To inactivate the exonucleases, the mixture was subsequently incubated 80 °C for 20 min.
-
(e)
The ligated circular probe was purified using the TIANquick oligo DNA purification kit and quantified using a NanoDrop 2000 spectrophotometer.
-
(f)
As shown in Fig. 4, solid-phase RCA was performed on the gold electrode surface on which DNA probe 1 was immobilized.
Fig. 4 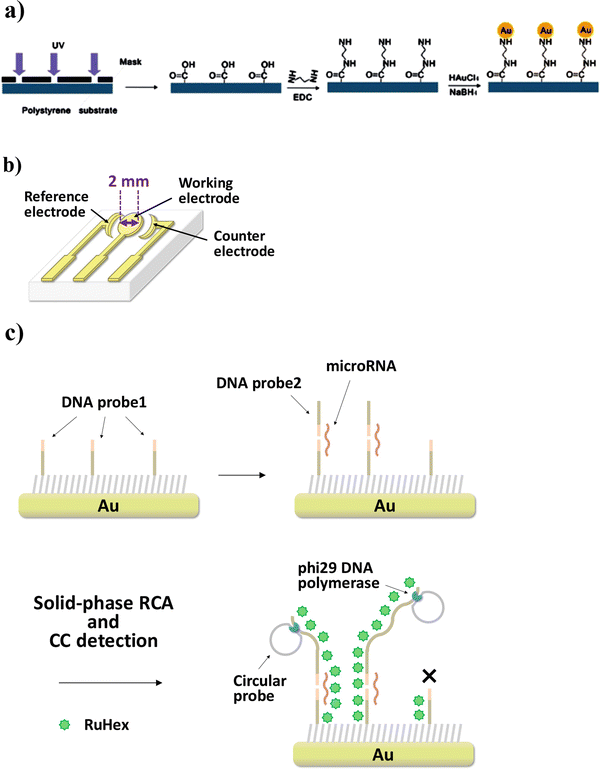
RCA-CC biosensor for microRNA detection. (a) Integrated gold electrodes were fabricated on polystyrene substrate by chemical plating. (b) Schematic illustration of three-gold electrode substrate. (c) After immobilization of DNA probe 1 on the working electrode, microRNA and DNA probe 2, which are partly complementary, hybridize to it, and then solid-phase RCA is initiated by phi29 DNA polymerase at 30 °C. If no hybridization takes place, the RCA reaction does not proceed
-
(g)
The gold electrode bearing immobilized DNA probe 1 was immersed in hybridization buffer containing 10 mM Tris–HCl, 50 μM ruthenium (III) hexammine (RuHex, Aldrich, China), and microRNA 143 (miR-143) see Note 1 , and DNA probe 2 at room temperature for 1 h. After this hybridization process, the electrode was rinsed three times with Milli-Q water and 10 mM Tris–HCl buffer.
-
(h)
Based on the CC measurement, about 10% of probe 1 was consumed by hybridization with target microRNAs in the presence of 10 nM miR-143 and probe 2.
-
(i)
RCA reaction mixture containing 50 mM Tris–HCl (pH 7.5), 10 mM MgCl2, 10 mM (NH4)2SO4, 200 μg/mL BSA, 400 μM dNTP, 3 U of phi 29 DNA polymerase (New England BioLabs, China), and 15 nM circular probe was placed onto the electrode and incubated at 30 °C for 10 min–16 h. RCA reaction time was optimized at 2 h because the reaction rate did not change after 4 h (Fig. 5a).
Fig. 5 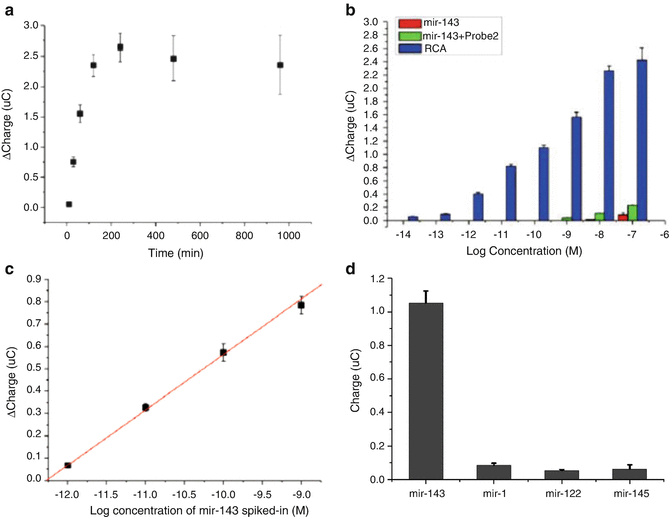
Optimized condition and detection performance for RCA-CC system . (a) Effect of RCA reaction time on CC signal. The data were acquired at 10, 30, 60, 120, 240, 480, and 960 min. (b) Detection sensitivity of miR-143, varying concentration from 10 fM to 100 nM. Solid-phase RCA reaction was performed at 30 °C for 2 h. (c) Confirmation of detection limit of miR-143 in human blood samples. Delta charge shows the difference in the CC signal before and after RCA. (d) Selectivity assay in the presence of contaminating microRNAs
-
(j)
Sensitivity of the RCA-CC assay was examined using stepwise diluted target miR-143 (concentration range, 10 fM–10 nM), and the RCA reaction was performed at 30 °C for 2 h. As shown in Fig. 5b, the detection limit was 100 fM, and was improved by RCA (detection limit of hybridization was 10 nM).
-
(k)
Figure 5c shows the detection of miR-143 spiked in human blood samples (see Notes 1 and 2 ); the RCA reaction was performed at 30 °C for 2 h. The detection threshold of miR-143 in blood samples was 1 pM, with a dynamic range from 1 pM to 1 nM.
-
(l)
Selectivity of the RCA-CC assay was also confirmed at 100 pM miR-143 and equal amounts of other microRNAs, including miR-1, miR-122, and miR-145. The concentration of DNA probe 2 added was 10 nM, and the RCA reaction was performed at 30 °C for 2 h. The delta charge value of miR-143 obtained by the RCA-CC assay was significantly higher than those of miR-1, miR-122, and miR-145 (Fig. 5d).
-
(a)


3.2 Real-Time DNA Amplification Monitoring Using Micro Et+ Sensor and Primer-Generation RCA (PG-RCA)
-
1.
Preparation of ethidium ion selective electrode (Et+ISE ).
-
(a)
A silicone-based Et+-selective membrane was prepared by dissolving 14 mg of KTpClPB, 302.4 mg Siloprene K1000, and 33.6 mg Siloprene cross-linking agent K-11 in 1.0 mL THF. The end of a silicon tube (3.0 cm) was dipped in the membrane solution, removed, and allowed to dry.
-
(b)
The tube covered with the resultant membrane was filled with internal solution consisting of 10 mM KCl and 10 mM phosphate buffer (pH 7.0). Ag/AgCl ink was applied to half of length of a Ag wire (7.0 cm). The Ag/AgCl wire was inserted, and the top of the tube was sealed with Parafilm. Finally, the Et+ISE was conditioned by soaking overnight in conditioning solution. The fabricated Et+ISE system is shown in Fig. 6.
Fig. 6 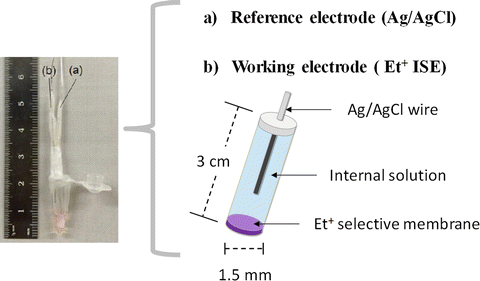
Photo image of Et+ISE combined with Ag/AgCl reference electrode
-
(c)
The electrical properties of Et+ISE exhibit Nernstian behavior. According to the Nernst equation (Eq. ((3)), the linear dependence of electrode potential on log [Et+] can be obtained.
$$ E={E}_0+\left(2.303\raisebox{1ex}{$\mathrm{R} T$}\!\left/ \!\raisebox{-1ex}{$ z\mathrm{F}$}\right.\right) \log a $$(3)where E 0 is the standard electrode potential, R the ideal gas constant, T the temperature in Kelvin, z the number of moles of electrons, F the Faraday constant, and a the ion activity.
-
(a)
-
2.
PG-RCA.
-
(a)
The circular probe was prepared as described by Murakami et al. [13]. Briefly, 20 μL of mixture containing 1.0 μM circular probe, reaction buffer, 2.5 mM MnCl2, and 5.0 U/μL CircLigase II ssDNA Ligase were incubated at 60 °C for 2 h. The mixture was incubated at 80 °C for 10 min to inactivate CircLigase II ssDNA Ligase. Subsequently, the unligated linear sequence was digested by addition of Exonuclease I (10 U/μL) and incubation at 37 °C for 2 h, followed by incubation at 80 °C for 5 min to inactivate the exonuclease I. The ligated circular probe was purified using the QIAquick Nucleotide Removal Kit. On average, the concentration of circular probes was 300–800 nM in 40 μL.
-
(b)
A schematic illustration of PG-RCA is shown in Fig. 7. PG-RCA reaction solution (30 μL) contained NE buffer, 500 μM dNTP mix, 50 nM ligated circular probe, 0.04 U/μL phi29 DNA polymerase, 0.4 U/μL Nb.BbvCI nicking endonuclease, 50 μM EtBr, and various concentrations of target DNA. Potential change was monitored at 37 °C for 2 h, and the reaction was terminated by incubation at 80 °C for 20 min.
Fig. 7 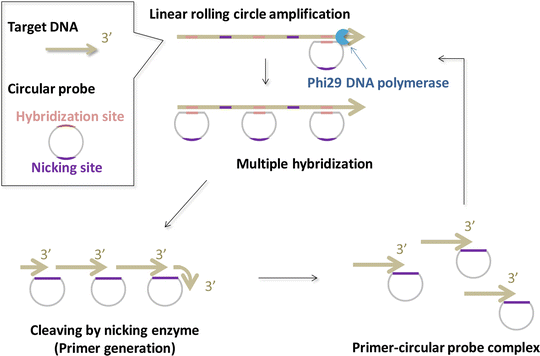
Schematic illustration of PG-RCA on gold electrode. When the circular probes hybridize to the target DNA, linear RCA reactions occur by strand displacement by phi29DNA polymerases. Subsequently, multiple primers are produced by nicking enzymes. Exponential amplification proceeds at a constant temperature (around 30 °C)
-
(a)
-
3.
Electrical properties of Et+ISE.
-
(a)
To evaluate the different membrane composition of Et+ISE, potential changes at various EtBr concentrations (10−7–10−3 M) were measured. The ratio of Siloprene K1000 and Siloprene cross-linking agent K-11 was fixed at 5, 7, or 9:1 with constant weight of 4% KTpClPB in 30 μL of 10 mM Tris–HCl buffer (pH 7.0) containing EtBr.
-
(b)
At ratios of 5:1 and 7:1, the potential traces were not sufficiently reproducible (Fig. 8a). On the other hand, at a ratio of 9:1, the traces were close to the Nernstian slopes (61.5 mV/activity decade at 37 °C). The response time (t 95%) was within 5 s, and the potential almost completely stabilized within 30 s.
Fig. 8 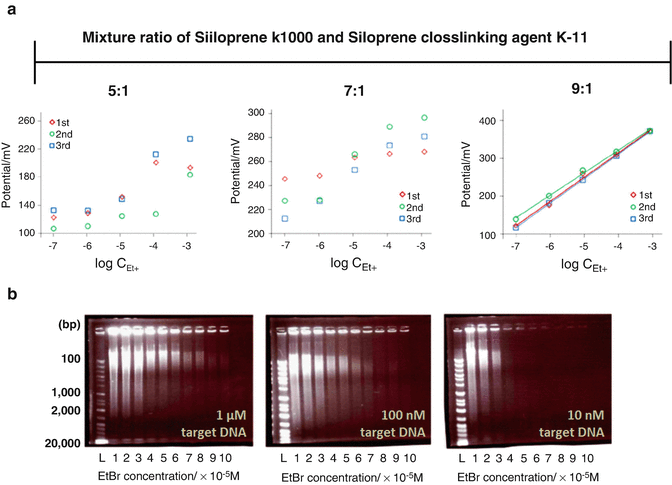
Fabrication of proper Et+ISE-PG-RCA system. (a) Comparison of electrical property caused by the difference of the Et+ selective membrane composition. (b) Electrophoresis images of PG-RCA amplicons in the presence of different EtBr concentrations
-
(a)
-
4.
Optimization of EtBr concentration for PG-RCA monitoring .
-
(a)
At high concentrations, DNA intercalators such as EtBr can inhibit DNA amplification. To examine the influence of the inhibitory effect of EtBr on DNA amplification efficiency, PG-RCA (target DNA: 1 μM, 100 nM, 10 nM) was performed at various concentrations of EtBr (10−5–10−4 M) (Fig. 8b).
-
(b)
In order to measure a high potential response, the initial EtBr concentration must be high. After considering the DNA amplification efficiency, 50 μM EtBr was chosen for potentiometric measurements.
-
(a)
-
5.
Real-time PG-RCA detection using micro Et+ISE.
-
(a)
The Et+ISE system for potentiometric measurement on PG-RCA is shown in Fig. 9a. From Eq. ((3), the potential that develops in this Et+ISE is proportional to the log of the Et+ ion activity in the PG-RCA solution. The real-time potential shift during PG-RCA was measured by an electrometer as difference between reference electrode (Ag/AgCl) and Et+ISE.
Fig. 9 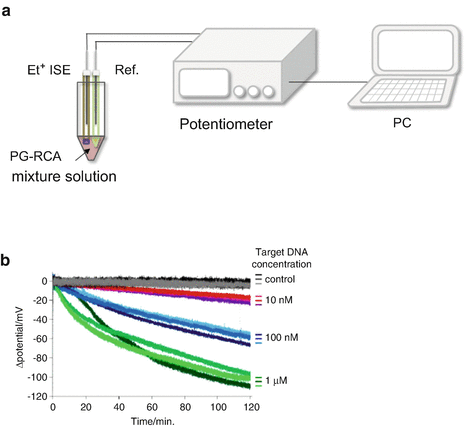
Real-time PG-RCA monitoring using Et+ISE. (a) Setup for potentiometric measurement. (b) Monitoring of potential decrease caused by Et+ binding to amplified DNA during PG-RCA
-
(b)
As PG-RCA progresses under isothermal conditions at 37 °C, EtBr is bound to the newly formed DNA, reducing the free EtBr concentration in the sample solution. In this potentiometric measurement, the Et+ISE potential signal decreases during PG-RCA.
-
(c)
As shown in Fig. 9b, the potential signal decreased over time, and the decrease in the rate and range depended on the initial target DNA concentration. Furthermore, a constant potential was observed in the target DNA-free control sample. When the PG-RCA condition was 1 μM initial target DNA and the initial concentration ratio of target DNA to EtBr was 1:50, the Et+ISE potential signal rapidly over the first 40 min. The decrease in potential value was 60 mV. This result corresponds to a 90% reduction in the free EtBr concentration in the PG-RCA bulk solution.
-
(d)
To confirm the role of PG-RCA monitoring using EtBr, a similar experiment was performed using SYBR Green I. Because of the strong affinity of SYBR Green for DNA, the PG-RCA reaction was inhibited in the presence of 50 μM SYBR Green instead of EtBr (data not shown). Furthermore, because DNA amplification can be performed at EtBr concentrations above the detection limit of ISEs, EtBr is suitable as an electrochemical signal reporter.
-
(a)


4 Notes
-
1.
Specified amounts of synthesized miR-143 were spiked into human blood containing anticoagulant (miRNA concentration, 10 fM–10 nM).
-
2.
Total RNA from human blood was extracted using the TIANprep Pure Blood Kit (Tiangen, China) and quantitated using a NanoDrop 2000 spectrophotometer.
References
Wang J (2006) Electrochemical biosensors: towards point-of-care cancer diagnostics. Biosens Bioelectron 21(10):1887–1892
Foudeh AM, Didar TF, Veres T, Tabrizian M (2012) Microfluidic designs and techniques using lab-on-a-chip devices for pathogen detection for point-of-care diagnostics. Lab Chip 12(18):3249–3266
Bergveld P (1970) Development of an ion-sensitive solid-state device for neurophysiological measurements. IEEE Trans Biomed Eng 17(1):70–71
Toumazou C, Shepherd LM, Reed SC, Chen GI, Patel A, Garner DM et al (2013) Simultaneous DNA amplification and detection using a pH-sensing semiconductor system. Nat Methods 10(7):641–646
Merriman B, Ion Torrent R&D Team, Rothberg JM (2012) Progress in Ion Torrent semiconductor chip based sequencing. Electrophoresis 33:3397–3417
Rothberg J, Hinz W, Rearick T, Schultz J, Mileski W, Davey M et al (2011) An integrated semiconductor device enabling non-optical genome sequencing. Nature 475(7356):348–352
Hsieh KW, Patterson AS, Ferguson BS, Plaxco KW, Soh HT (2012) Rapid, sensitive, and quantitative detection of pathogenic DNA at the point of care through microfluidic electrochemical quantitative loop-mediated isothermal amplification. Angew Chem Int Ed Engl 51(20):4896–4900
Ren Y, Deng H, Shen W, Gao Z (2013) A highly sensitive and selective electrochemical biosensor for direct detection of microRNAs in serum. Anal Chem 85(9):4784–4789
Goda T, Tabata M, Miyahara Y (2015) Electrical and electrochemical monitoring of nucleic acid amplification. Front Bioeng Biotechnol 3:29
Yao B, Liu Y, Tabata M, Zhu H, Miyahara Y (2014) Sensitive detection of microRNA by chronocoulometry and rolling circle amplification on a gold electrode. Chem Commun 50(68):9704–9706
Seichi A, Kozuka N, Kashima Y, Tabata M, Goda T, Matsumoto A et al (2016) Real-time monitoring and detection of primer generation-rolling circle amplification of DNA using an ethidium ion-selective electrode. Anal Sci 32(5):505–510
Lee GB, Chen SH, Huang GR, Sung WC, Lin YH (2001) Microfabricated plastic chips by hot embossing methods and their applications for DNA separation and detection. Sens Actuat B-Chem 75(1–2):142–148
Murakami T, Sumaoka J, Komiyama M (2009) Sensitive isothermal detection of nucleic-acid sequence by primer generation-rolling circle amplification. Nucleic Acids Res 37(3):e19
Acknowledgments
This study was supported in part by the Center of Innovation (COI) Program from the Japan Science and Technology Agency (JST), Core Research of Evolutional Science & Technology (CREST), Japan Society for the Promotion of Science (JSPS), through the “Funding Program for World-Leading Innovative R&D on Science and Technology (FIRST Program)” initiated by the Council for Science and Technology Policy (CSTP); and by a JSPS Postdoctoral Fellowship for Foreign Researchers (No. P11355). Human blood samples were provided by Dr. Xuan Mu at the Institute of Basic Medical Sciences Chinese Academy of Medical Sciences (School of Basic Medical Science Peking Union Medical College), and this study was approved by the Chinese Academy of Medical Sciences Review Board on Human Rights Related to Human Experimentation (No. 001 2014).
Author information
Authors and Affiliations
Corresponding author
Editor information
Editors and Affiliations
Rights and permissions
Copyright information
© 2017 Springer Science+Business Media LLC
About this protocol
Cite this protocol
Tabata, M., Yao, B., Seichi, A., Suzuki, K., Miyahara, Y. (2017). Electrochemical Biosensors Combined with Isothermal Amplification for Quantitative Detection of Nucleic Acids. In: Prickril, B., Rasooly, A. (eds) Biosensors and Biodetection. Methods in Molecular Biology, vol 1572. Humana Press, New York, NY. https://doi.org/10.1007/978-1-4939-6911-1_10
Download citation
DOI: https://doi.org/10.1007/978-1-4939-6911-1_10
Published:
Publisher Name: Humana Press, New York, NY
Print ISBN: 978-1-4939-6910-4
Online ISBN: 978-1-4939-6911-1
eBook Packages: Springer Protocols