
Abstract
Monitoring water bodies by extraction using water indexes from remotely sensed images has proven to be effective in delineating surface water against its surrounding. This study tested and assessed the Normalized Difference Water Index, Modified Normalized Difference Water Index, Automated Water Extraction Index, and near infrared (NIR) band using Landsat 8 imagery acquired on September 3, 2016. The threshold method was adapted for surface water extraction. To avoid over and under-estimation of threshold values, the optimum threshold value of each of the water indexes was obtained by implementing a geoprocessing model. Examining images of Landsat 8, NIR band has the largest difference in reflectance values between water and non-water bodies. Thus, NIR band exhibits the highest contrast between water and non-water bodies. An optimum threshold value of 0.128 for NIR band achieved an overall accuracy (OA) and kappa hat (Khat) coefficient of 99.3% and 0.986, respectively. NIR band of Landsat 8 as water index was found more satisfactory in extracting water bodies compared to the multi-band water indexes. This study shows that the optimum threshold values of each of the water indexes considered in this study were determined conveniently, where highest value of OA and Khat coefficient were obtained by creating and implementing a graphical modeler in Quantum Geographic Information System that automates from setting threshold value to accuracy assessment. This study confirms that remote sensing can extract or delineate water bodies rapidly, repeatedly and accurately.
Introduction
Remote sensing is an observation method in obtaining information about several objects on Earth’s surface (that generally includes water, vegetation, built-up, and bare soil), without having contact with the use of sensors [1]. Optical remote sensing sensors are the vital devices that measure distinct spectral signatures, concerning wavelengths, that each sensor measures reflected or emitted energy [2,3,4]. However, clouds or haze and cloud shadows affect optical remote sensing images [5,6,7,8] which makes it challenging to discriminate them from dark objects like water and shadows [5, 7, 8]. Thus, cloud and haze-free images were used for this study. Recent surface water mapping methods using optical imagery are generally categorized as supervised classification [9,10,11], unsupervised classification [11, 12], and water spectral indexes [13,14,15,16,17].
Remote sensing is essential in several studies on surface water mapping including but not limited to water bodies extraction [13,14,15,16, 18], flood management [19, 20], and water quality [21,22,23]. Delineation of water bodies from remotely sensed imagery by extraction techniques has long been applied [13,14,15,16, 18]. The methods involved comfort with the number of bands used mainly single-band and multi-band [18, 24]. Water body extraction by multi-band water index threshold methods was introduced by McFeeters [13] from Landsat 4 Multispectral Scanner using green and near-infrared (NIR) bands, by Rogers and Kearney [14] from Landsat Thematic Mapper (TM) using red and green and shortwave infrared (SWIR) bands, by Xu [15] from Landsat 5 TM and Landsat 7 Enhanced TM using SWIR bands, and by Feyisa et al. [16] from Landsat 5 TM using green, blue, NIR, and SWIR bands. Such methods examine comprehensively the bands considered [24] in order to determine the threshold that categorizes water from non-water bodies [15]. Threshold values both in single-band and multi-band water indexes are determined based on surface reflectance between water and non-water bodies [11]. However, Xu [15] emphasized that the subjective threshold value determination could lead to under- or over-estimation of open water areas. Additionally, determination of threshold value that is producing optimum accuracy is perplexing, time-consuming, and image dependent [16, 25]. Furthermore, Feyisa et al. [16] made a comparison of optimum thresholds and found variations at different test sites.
Knowing that Landsat missions have been implemented for the past four decades, Landsat satellites performances improve a great deal. In fact, Landsat 8 is considered “robust, high performing, and of extremely high data quality” [26]. Similarly, Landsat 8 has a different position of central wavelength with narrower bandwidth particularly bands 5 and 7 [25, 27].
Water absorbs more energy (low reflectance) in NIR and SWIR wavelengths, while non-water reflects more energy (high reflectance) [11, 16, 25, 28]. Considering that the narrower bandwidth has the advantage of effectively discriminating specific objects [29], NIR as single-band water index and multi-band water indexes of McFeeters [13], Rogers and Kearney [14], Xu [15], Feyisa et al. [16] using Landsat 8 was investigated in the present study. It is worth noting that single-band water index using NIR band was probably last investigated by Work and Gilmer [28] in 1976. Hence, this study focuses on extracting water bodies applying both the single-band and multi-band water indexes by threshold method using Landsat 8 operational land imager (OLI). The study also aims at avoiding under- or over-estimation of extracted water bodies by obtaining an optimum threshold value where the highest values for overall accuracy (OA) and Kappa hat (Khat) coefficient were reached by creating and implementing a graphical modeler in Quantum Geographic Information System (QGIS) that automates the workflow from setting threshold value to accuracy assessment.
Materials and methods
Study area and data description
Located southeast of Cebu City and southwest of Lapu-Lapu City, Philippines, the study area encompasses the Municipality of Cordova and some part of Lapu-Lapu City. The study area extends between 601,605–606,555 Easting (123°55′39.864″-123°58′23.052″ Longitude) and 1,132,215–1,137,015 Northing (10°14′27.924″-10°17′3.732″ Latitude) with a total area of 23.76 km2 as shown in Fig. 1. The study area was selected considering that it is surrounded with water bodies. The extent of the study area also covers both shallow water on wetlands and deep water beyond wetland as revealed on the lower right corner of the image. It is an important place for urban development that will hopefully link Cebu and Bohol Provinces in the future. It is relatively flat with elevation from sea level to 7 m. Landsat 8 OLI image acquired on September 3, 2016, with no clouds on the study area, contains the 30-m resolution of band 2 to band 7 and a 15-m resolution of panchromatic band (Table 1).

The extent of the study area
Workflow for water extraction from images without clouds
Given the availability of data from Landsat 8, Fig. 2 outlines the processes employed in water bodies extraction with the use of an open source QGIS.
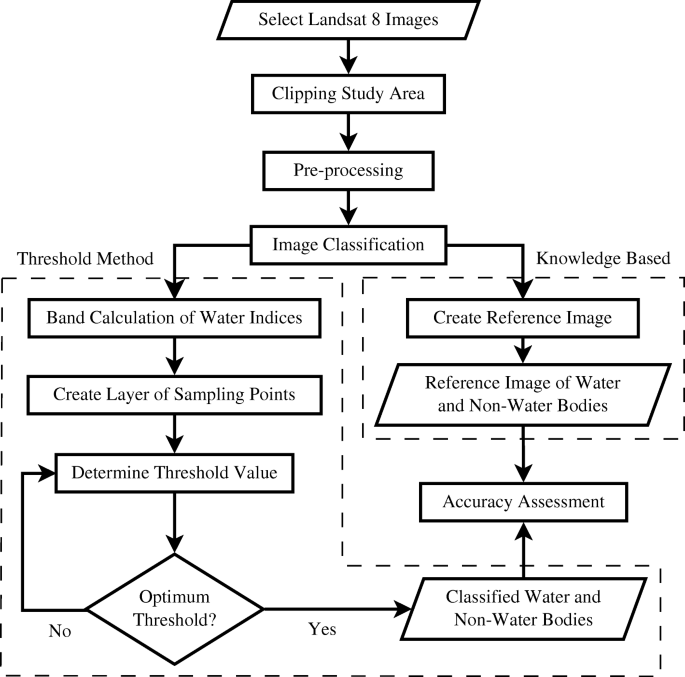
Workflow of water bodies extraction
Selection of Landsat 8 OLI imagery
Landsat 8 image was selected and downloaded from the USGS data archive (https://earthexplorer.usgs.gov/). A cloud free image of September 3, 2016 at the study area was selected and downloaded.
Clipping of study area
Before implementing pre-processing of the selected image, clipping bands 2 to 8 to the extent of the study area was applied. Clipping of band 8 was included for pan-sharpening purposes. This step was necessary to reduce memory requirement and speed up further processes like classification, band calculation, accuracy assessment, and building of virtual raster that were implemented in this study.
Image pre-processing
The Semi-Automatic Classification Plugin (SCP) for QGIS bands 2 to 8 were pre-processed. SCP is an open source plugin for supervised classification with tools for downloading free images, pre-processing, post-processing, and raster calculation [30]. Multispectral image analysis requires conversion of its “quantized and calibrated scaled digital numbers (DNs)” [26] to top of atmosphere (TOA) reflectance in order to achieve clear Landsat scenes [31] which is packaged in SCP as shown in Fig. 3. Likewise, the reflectance at the surface is obtained after atmospheric correction applying dark object subtraction 1 (DOS1) correction [32]. Furthermore, to enhance image visualization, pan-sharpening was adapted transforming 30 m resolution to 15 m.

Landsat conversion of DN to TOA reflectance and pan-sharpening with DOS1 atmospheric correction
Spectral radiance at the sensor’s aperture
Calculation of spectral radiance at the sensor’s aperture is a basic procedure in converting image calibrated DNs into meaningful spectral units [30, 33, 34]. Landsat 8 image data were converted into spectral radiance at the sensor’s aperture using radiance scaling factor [26, 30]:
where Lλ is the spectral radiance (W sr− 1 m− 2 μm− 1); ML is the radiance multiplicative scaling factor for the band (Radiance_Multi_Band_n from the metadata, where n is the band number); AL is the radiance additive scaling factor for the band (Radiance_Add_Band_n from the metadata); and Qcal is the quantized and calibrated standard product pixel value (DN).
TOA reflectance
Similarly, DN values in the Level-1 product were also converted to TOA reflectance as the following equation [30, 34, 35]:
where d is the Earth-Sun distance in astronomical units (provided in Landsat 8 metadata file); Esunλ is the mean solar exo-atmospheric irradiances; θs is the solar zenith angle in degrees which is expressed as θs = 900 − θe where θe is the Sun elevation angle (provided in Landsat 8 metadata file); and Lλ is the spectral radiance at the sensor’s aperture.
Atmospheric correction using DOS1 method
Lλ does not consider the effects of the atmosphere; thus, spectral radiance was translated into surface reflectance where atmospheric correction method was further applied [30, 34]. To maximize the use and achieve the full potential of optical satellite data, an accurate, cost-effective and easy to apply atmospheric correction method, that does not require in-situ field measurements particularly of historical image or image that have been collected before its examination, is necessary [32, 33, 36]. Thus, an image based DOS radiometric calibration and correction method is applicable for historical data. The DOS method was confirmed effective and accurate where it is successfully applied among several Landsat studies regardless of location in cases when atmospheric measurements are unavailable [33, 35, 37, 39,40,41,42].
In this study, a straightforward DOS1 with the assumption that “very few targets on the Earth’s surface are absolute black, so an assumed one-percent minimum reflectance is better than zero percent” [32] is applied. The path radiance Lp was calculated as [30, 43].
where Lmin is the “radiance that corresponds to a digital count value for which the sum of all the pixels with digital counts lower or equal to this value is equal to the 0.01% of all the pixels from the image considered” [43] of which the corresponding DNmin was obtained; LDO1% is the radiance of dark object.
For Landsat images [30]:
For DOS1 technique, the LDOI% was calculated as [30, 32, 39]:
Thus, the LP was computed as:
Hence, the land surface reflectance ρ was calculated as:
where Esunλ = πd2 (Radiance_maxiumu/Relectance_maximum) [30, 44] and Radiance_maximum and Reflectance_maximum are provided in Landsat 8 metadata file.
Panchromatic sharpening
Panchromatic sharpening or pan-sharpening is a process of merging or fusing low or coarser resolution multispectral bands (30 m) with higher resolution panchromatic band (15 m) to generate new dataset having the spectral properties of the multispectral bands with a higher resolution of the panchromatic band [30, 45, 46]. In SCP, Brovey transform algorithm is applied of which each of the pan-sharpened multispectral bands is computed as [30, 45]:
where MSP is the pan-sharpened multispectral band; MS is the multispectral band with lower resolution; P is the panchromatic band with higher resolution; I is the intensity as a function of the MS bands.
For Landsat 8, using SCP, the intensity is calculated as [30]:
Water indexes from Landsat images
A number of water indexes have been introduced in the literature. Five multi-band water indexes were considered in this study as shown in Table 2. Each of the five multi-band water indexes differs on the bands being considered. For normalized difference water index (NDWI), McFeeters [13] considered green and NIR bands while Rogers and Kearney [14] considered red and SWIR1 bands. Xu [15] introduced a modified normalized difference water index (MNDWI) considering green and SWIR1 bands. Feyisa et al. [16] introduced two automated water extraction indexes (AWEI) that considered blue, green, NIR, SWIR1, and SWIR2 bands. AWEInsh was developed to efficiently delineate non-water pixels from an image where shadows are less problematic, while AWEIsh was formulated with improved accuracy that AWEInsh might not efficiently discriminate shadow pixels [16].
Analyzing spectral characteristics of water
Landsat 8 has 11 spectral bands that comprise instruments OLI and Thermal Infrared Sensor. However, only bands 2 to 8 of OLI were considered in this study. Figure 4 shows the spectral signatures of non-water and water bodies. Bands 2 to 4 are the visible spectrum of blue, green and red, respectively, that ranges from 0.45 to 0.68 μm. On the other hand, bands 5 to 7 are invisible spectrum of NIR, SWIR1 and SWIR2 that ranges from 0.845 to 2.3 μm. As shown in Fig. 4, water absorbs more energy in NIR (band 5) and SWIR (bands 6 & 7) wavelengths, while non-water reflects more energy [8, 11, 16, 25]. Thus, single-band method chooses between NIR and mid infrared bands [11]. Examining closely Fig. 4, from left to right, reflectance difference or gap between water and non-water bodies is increasing from band 2 to band 5 and decreasing thereafter. In other words, band 5 has the largest difference in reflectance values between water and non-water bodies. Thus, NIR band was chosen to be an effective single band water index that can efficiently delineate water from non-water bodies.

Spectral signature plot of water and non-water bodies. Verticals lines are central values of spectral ranges of bands 2 to 7 from left to right. Dashed (− − −) and dotted (···) lines represent the 95% confidence intervals of water and non-water bodies, respectively
Threshold method of classification
To acquire all pixel values, a layer of points exactly at the center of the pixels was created. Generation of this point-layer was achieved by creating a Microsoft Excel Visual Basic for Applications (VBA) code that will automate the generation of latitude and longitude coordinates. The VBA code only requires one lower left center of pixel coordinates, intervals along latitude and longitude, and number of columns and rows of pixels to be filled. The generated coordinates were saved as comma separated values (comma delimited) and imported to QGIS. In this way, a credible number of sample points can be generated. Consequently, point sampling tool in QGIS is used to obtain values of pixels for several layers of water indexes under investigation. As the optimum threshold value is estimated visually while aided with its histogram [24, 47], the generated layer of sample points made it more convenient to obtain optimum threshold value.
Furthermore, QGIS has a built-in graphical modeler that can set up or automate a workflow consisting of several steps [48], which can combine algorithms coming from several libraries that can enable repetitive execution of such algorithms with varying parameters [49]. To avoid over- and under-estimation of threshold values for the different water indexes, a geoprocessing model was created, as shown in Fig. 5, to achieve an optimum threshold value for each of the water indexes considered in this study. Achieving the optimum threshold value of each of the water indexes involves a considerable repetitive process where prior steps generate output that is utilized by the proceeding step. The considered optimum threshold value is with the highest OA.

Setting threshold value to accuracy assessment graphical modeler
Knowledge based or supervised classification to generate a reference image
In this study, land covers are simply classified as water bodies and non-water bodies. With the use of the SCP ROI (region of interest) pointer using the region growing algorithm, reference image was created with a considerable number of pixels as presented in Fig. 6. The reference image was adapted for accuracy assessment. In this paper, the same image is used both for classifying image by threshold method and in generating reference data. This approach is applicable to the condition that the obtained reference image is more accurate than the classified image [50]. The generated reference image was polygonised and saved as shapefile. The polygonised reference image was rasterized with parameters: macro class ID as attribute field, output resolution in map units per pixel, 15 m horizontal and 15 m vertical resolution. Eventually, the rasterized image was translated (convert format) setting “no data” value to zero (Fig. 6).

Reference image for water (black) and non-water bodies (gray), no data (white)
Since reference image was created conveniently using SCP ROI pointer, with only two classes (water and non-water bodies), a large number of samples were considered with 24,422 and 31,803 pixels for water and non-water bodies, respectively, or a total of 56,225 pixels out of 105,600 pixels of the study area. Such number of samples is large enough compared to the suggestion of Congalton and Green [51] of 50 samples per class or 100 samples if area exceeds 500 km2. If sample size is determined by binomial distribution by N = Z2(p)(q)/E2 [37], where Z = 2, p is the expected percent accuracy, q = 100 − p and E is the allowable error. Thus, if p = 99%, E = 1%, then N = 22(99)(1)/12 = 396 samples only. Likewise, considering a sampling ratio of 2% for each land use class as applied by Heydari and Mountrakis [52], it requires only a total of 21,120 pixels. Hence, the sample size of 24,422 and 31,803 pixels for water and non-water bodies, respectively, will most likely achieve a higher probability of getting correct accuracy estimation.
Accuracy assessment
To quantitatively assess accuracy of classified image, user’s accuracy (UA), producer’s accuracy (PA), OA, and Khat coefficient were adapted for evaluation applying “r.kappa” algorithm in QGIS [53]. The following widely adapted equations were used [37, 46, 47, 53, 54]:
UA is the complimentary measure to commission error that denotes the proportion of a classified spatial unit in a class represents that class in the reference data.
where nii is the total number of correctly classified pixels in a particular category or class in i-th row and i-th column, and ni+ is the total number of pixels of i-th row i classified for a particular category.
PA is the complimentary measure to omission error that indicates the proportion of a classified spatial unit in a class in the reference data being correctly classified in the map.
where n+i is the total number of pixels of i-th column classified for a particular category of the reference data.
OA is the proportion of the total number of pixels that are correctly classified against the total number of testing pixels in the reference data.
where ∑nii is the summation of the correctly classified pixels and n is the total number of testing pixels in the error matrix.
Khat is a measure of “agreement based on the difference between the actual agreement in the error matrix and the chance agreement” [54]. Its value lies between 0 and 1, where 0 represents agreement due to chance only and 1 represents complete agreement between the two data sets [55].
Results and discussion
Images of colour composites
The surrounding water bodies of the Municipality of Cordova and southwestern part of Lapu-Lapu City were selected from Landsat 8 OLI imagery for surface water extraction. To interpret remotely sensed images, different colour composites were explored as presented in Fig. 7. The natural or true colour composite is a combination of the visible spectrum of red, green and blue bands (Fig. 7a). Natural colour composite of bands 4–3-2 resemble closely what the naked eyes can recognize as true colour or photo-liked image [56] where water in dark blue to black, white surfaces in white, vegetation in green, bare soil in brown, and built-up in gray. Natural colour image is somehow low in contrast (Fig. 7a). The false colour composite of bands 3–5-7 (Fig. 7b) displays enhanced vegetation in bright green, underwater vegetation in red, and built-up in shades of violet. On the other hand, bands 5–6-7 (Fig. 7c) of false colour composite represents an elaborated presence of water in black (dark), vegetation in red, and built-up in shades of cyan. Bands 3–5-7 composite also distinguishes the presence of shallow water on wetland (red) and deep water (black) beyond wetland as indicated on the lower right corner of the study area. Furthermore, bands 5–6-7 of NIR, SWIR1 and SWIR2 composite indicates that water absorbs more energy in NIR and SWIR wavelengths, while non-water reflects more energy [11, 16, 25].

Colour composites: (a) Natural colour composite (bands 4–3-2), (b) Bands 3–5-7 composite, and (c) Bands 5–6-7 composite
Water indexes
Contrasting and delineating different types of land use can be facilitated by visual inspection based on their spectral reflectance [18]. The water indexes images of others [13,14,15,16] and the NIR band derived from Landsat 8 OLI show contrast between water and non-water features differently as shown in Fig. 8. Water indexes in Fig. 8 were enhanced by contrast stretching to improve visual interpretation as well as to minimize effect of noise [57]. In this case, each of the water index in Fig. 8 was stretched to its corresponding one standard deviation both ends (right and left) of its histogram. Generally, NDWI of McFeeters [13], NDWI of Rogers and Kearney [14], and MNDWI of Xu [15] show similarity of contrast between water and non-water bodies. Visual inspection of Fig. 8 indicates that NDWI of McFeeters [13] has the least contrast between water and non-water bodies particularly on areas where depth of water is shallow on wetlands. As the study area covers deep water beyond wetland as shown on the lower right corner, NDWI of McFeeters [13], NDWI of Rogers and Kearney [14], MNDWI of and Xu [15] reveal less contrast on this area to non-water bodies such that deep water appeared gray instead of black as revealed in AWEInsh and AWEIsh of Feyisa et al. [16] and NIR band (Fig. 8). However, this has somehow delineates shallow water bodies on wetlands and deep water beyond wetlands.

Images produced by different Water Indexes using Landsat 8 OLI. Contrast enhancement was stretched to one standard deviation both sides. (a) NDWI of McFeeters [13], (b) NDWI of Rogers and Kearney [14], (c) MNDWI of Xu [15], (d) AWEInsh of Feyisa et al. [16], (e) AWEIsh of Feyisa et al. [16], (f) NIR band. White to black for all multi-band water indexes (a to e) is low to high index values as pixels with values greater than their respective threshold values are water bodies. White to black for NIR band (f) is high to low index values as pixels of NIR band with values less than its threshold value are water bodies
Water absorbs more energy (less reflective) at visible red (band 4), NIR (band 5) and short wave infrared (band 6 & 7) wavelengths [11, 16, 25]. In other words, water has “strong absorption in the near-infrared and mid-infrared spectral ranges” [24]. Spectral difference between water and non-water bodies decreases at short wave infrared as presented in Fig. 4. Consequently, contrast between water and non-water bodies narrows down at bands SWIR1 and SWIR2. Hence, NIR band is a better choice over SWIR1 and SWIR2 for water extraction. NIR band spectral image of Landsat 8 reveals large contrast between water and non-water bodies.
A noticeable contrast between shallow and deep water was manifested among NDWI of McFeeters [13], NDWI of Rogers and Kearney [14], and MNDWI of Xu [15], indicating that deep and shallow water absorb energy differently. Furthermore, water index AWEInsh of Feyisa et al. [16] shows less contrast between water and tidal wetland vegetation (particularly mangroves). Likewise, NDWI of McFeeters [13], NDWI of Rogers and Kearney [14], MNDWI of Xu [15] and AWEIsh of Feyisa et al. [16] have less contrast between water and built-up white roof or white surfaces as observed in the natural colour composite (Fig. 7a). Similarly, AWEInsh and AWEIsh of Feyisa et al. [16] and NIR band are having comparable contrast between water and non-water bodies. However, NIR band shows better contrast between water and non-water bodies having no problem with tidal wetland vegetation (particularly mangroves) and built-up white roof or white surfaces.
Obtaining an optimum water index threshold values
Optimum threshold values of each of the water indexes in this study were determined by creating and implementing a graphical modeler in QGIS that automates the process from setting threshold value to accuracy assessment (Fig. 5). Optimum threshold values were determined with the highest value of OA and Khat coefficient. Figure 9 reveals interesting characteristics such as: (a) NIR band having the highest OA and Khat coefficient has the narrowest distance between its OA and Khat; (b) the lowest OA and Khat in McFeeters [13] have the widest distance between its OA and Khat; (c) NIR band has the steepest curve; and (d) all multi-band water indexes considered in this study have negative optimum threshold values, while NIR band has a positive optimum threshold. Furthermore, steepness of curve of NIR band indicates a high contrast between water and non-water bodies compared to all multi-band water indexes considered in this study. For all multi-band water indexes in this study, pixels with values greater than their respective threshold values are water bodies, while less than their threshold values are non-water bodies. On the other hand, pixels of NIR band with values less than its threshold value are water bodies, while greater than its threshold value are non-water bodies.

Optimum Threshold values (the corresponding vertical dotted points) is where the highest values for overall accuracy (OA) and Kappa hat coefficient (Khat) were reached
Extracted water bodies based on optimum threshold value
Figure 10 shows the different results of extracted water bodies based on optimum threshold value. All six water indexes applied in this study performed well in delineating surface water against its surroundings. The NDWI of McFeeters [13], NDWI of Rogers and Kearney [14], and MNDWI of Xu [15] revealed similar trend of misclassifying white roof or white surfaces as water, while this is not observed in AWEInsh of Feyisa et al. [16] and NIR band (Fig. 11). The AWEInsh of Feyisa et al. [16], MNDWI of Xu [15], NDWI of Rogers and Kearney [14], and AWEIsh of Feyisa et al. [16] misclassified tidal vegetation as water in decreasing magnitude, while NDWI of McFeeters [13] and NIR band overcome this problem (Fig. 12). The large tidal vegetation (mangroves) misclassification as water in AWEInsh is an indication that AWEInsh of Feyisa et al. [16] has the least contrast between water and tidal vegetation (mangroves). Although NDWI of McFeeters [13] has no problem of misclassifying mangroves as water, it fails to delineate the presence of shallow water (Fig. 12f). However, AWEIsh has minor misclassification on white surfaces, as observed already by Feyisa et al. [16], while NIR band has slight misclassification on dark non-water surfaces.


Misclassification as water of tidal vegetation (mangroves, enclosed in green) as observed in a false colour composite of bands 5–6-7 in the water indexes of the b AWEInshof Feyisa et al. [16], c MNDWI of Xu [15], d NDWI of Rogers and Kearney [14], e AWEIsh of Feyisa et al. [16], f NDWI of McFeeters [13], and g NIR band based on optimum threshold value
Confusion matrix
Large parts of the study area were classified as reference image for validation (Fig. 6). Such reference image was used for accuracy assessment. Table 3 shows the confusion matrix of different water indexes that reveals their performances in classifying water and non-water bodies. Water index performance is revealed by its water extraction result where optimum threshold value is considered [25]. The NDWI of McFeeters [13] performs the least accurate with OA and Khat of 89.3% and 0.779, respectively. This performance of the NDWI of McFeeters [13] was also observed being the least accurate in the findings of others [58]. McFeeters [13] stressed out that NDWI values equal to or lesser than zero are non-water bodies, while NDWI values greater than zero are water bodies. However, NDWI of McFeeters [13] was unable to obtain its highest accuracy, obtaining only 80.3% OA and 0.576 Khat, applying a threshold value of zero. Thus, NDWI of McFeeters [13] will be unable to obtain its highest accuracy by considering theoretical threshold of zero (Fig. 9) [25].
The NDWI of Rogers and Kearney [14], MNDWI of Xu [15], and AWEInsh of Feyisa et al. [16] indicated a narrow range of OA and Khat from 93.0 to 95.1% and 0.857 to 0.900, respectively, indicating that water indexes of those investigators are comparable. Among the multi-band water indexes investigated in this study, AWEIsh of Feyisa et al. [16] exhibited the highest overall accuracy and kappa hat coefficient of 98.3% and 0.966, respectively. However, single-band water index of NIR band unveiled the highest overall accuracy and kappa hat coefficient of 99.3% and 0.9858, respectively, compared to any multi-band water index applied in this study. Having accounted all accuracy statistics, NIR band performed the best followed closely by the AWEIsh water index of Feyisa et al. [16], thus, these two water indexes are very comparable.
Conclusions
The non-normalized AWEIsh of Feyisa et al. [16] adapted 5 out of 6 bands whereby maximizing usage of the different spectral information of Landsat 8 OLI. With this, it performs better than the normalized water indexes. However, results of this study have also indicated that NIR band of Landsat 8 OLI can be adapted more efficiently as a single-band water index compared to the multi-band water index introduced earlier by others [13,14,15,16]. The superior performance of NIR band of Landsat 8 OLI as water index can be attributed as having the narrowest bandwidth compared to bands 2, 3, 4, 6 &7 (Table 1). This feature of NIR band contributed to its largest difference in reflectance values between water and non-water bodies making it effective to discriminate non-water to water bodies as revealed in Fig. 8. Furthermore, NIR band is more suitable for elaborating water with considerable vegetation both on coastal and inland areas. The threshold value for NIR band in extracting water bodies is conveniently distinguishable since there is only minimal existence of non-water noise. Thus, a narrower NIR band as a single-band water index has the advantage of effectively discriminating water from non-water bodies. Hence, applying the previous multi-band water indexes of others [13,14,15,16] in extracting a water body using Landsat 8 OLI added some noise or that reduces contrast between water and non-water bodies. Additionally, single-band water index using NIR band of Landsat 8 OLI is simpler or less complicated, without requiring raster calculation, compared to the multi-band water indexes introduced by those investigators [13,14,15,16]. Moreover, this study shows that an optimum threshold value of the water index, where highest value of OA and Khat coefficient were obtained, is conveniently attainable by creating and implementing a geoprocessing modeler in QGIS that automates the process from setting of threshold value to accuracy assessment. This study likewise confirms that remote sensing can extract or delineate water bodies from non-water bodies rapidly, repeatedly and accurately.
References
Zhong YF, Ma AL, Ong YS, Zhu ZX, Zhang LP. Computational intelligence in optical remote sensing image processing. Appl Soft Comput. 2018;64:75–93.
Xie YC, Sha ZY, Yu M. Remote sensing imagery in vegetation mapping: a review. J Plant Ecol-UK. 2008;1:9–23.
Joshi N, Baumann M, Ehammer A, Fensholt R, Grogan K, Hostert P, et al. A review of the application of optical and radar remote sensing data fusion to land use mapping and monitoring. Remote Sens-Basel. 2016;8:70.
Shah AK. “Remote sensing” - a part of an applied physics. Himal Phys. 2014;5:102–8.
Zhu Z, Woodcock CE. Object-based cloud and cloud shadow detection in Landsat imagery. Remote Sens Environ. 2012;118:83–94.
Wu T, Hu XY, Zhang Y, Zhang LL, Tao PJ, Lu LP. Automatic cloud detection for high resolution satellite stereo images and its application in terrain extraction. ISPRS J Photogramm. 2016;121:143–56.
Sun L, Liu XY, Yang YK, Chen TT, Wang Q, Zhou XY. A cloud shadow detection method combined with cloud height iteration and spectral analysis for Landsat 8 OLI data. ISPRS J Photogramm. 2018;138:193–207.
Zhai H, Zhang HY, Zhang LP, Li PX. Cloud/shadow detection based on spectral indices for multi/hyperspectral optical remote sensing imagery. ISPRS J Photogramm. 2018;144:235–53.
Gautam VK, Gaurav PK, Murugan P, Annadurai M. Assessment of surface water dynamics in Bangalore using WRI, NDWI, MNDWI, supervised classification and K-T transformation. Aquat Pr. 2015;4:739–46.
Sun FD, Zhao YY, Gong P, Ma RH, Dai YJ. Monitoring dynamic changes of global land cover types: fluctuations of major lakes in China every 8 days during 2000–2010. Chin Sci Bull. 2014;59:171–89.
Yang H, Wang Z, Zhao H, Guo Y. Water body extraction methods study based on RS and GIS. Procedia Environ Sci. 2011;10:2619–24.
Sivanpillai R, Miller SN. Improvements in mapping water bodies using ASTER data. Ecol Inform. 2010;5:73–8.
McFeeters SK. The use of the normalized difference water index (NDWI) in the delineation of open water features. Int J Remote Sens. 1996;17:1425–32.
Rogers AS, Kearney MS. Reducing signature variability in unmixing coastal marsh thematic mapper scenes using spectral indices. Int J Remote Sens. 2004;25:2317–35.
Xu HQ. Modification of normalised difference water index (NDWI) to enhance open water features in remotely sensed imagery. Int J Remote Sens. 2006;27:3025–33.
Feyisa GL, Meilby H, Fensholt R, Proud SR. Automated water extraction index: a new technique for surface water mapping using Landsat imagery. Remote Sens Environ. 2014;140:23–35.
Ji LY, Geng XR, Sun K, Zhao YC, Gong P. Target detection method for water mapping using Landsat 8 OLI/TIRS imagery. Water-Sui. 2015;7:794–817.
Xie H, Luo X, Xu X, Pan HY, Tong XH. Automated subpixel surface water mapping from heterogeneous urban environments using Landsat 8 OLI imagery. Remote Sens-Basel. 2016;8:584.
Haq M, Akhtar M, Muhammad S, Paras S, Rahmatullah J. Techniques of remote sensing and GIS for flood monitoring and damage assessment: a case study of Sindh province, Pakistan. Egypt J Remote Sens Sp Sci. 2012;15:135–41.
Santillan JR, Marqueso JT, Makinano-Santillan M, Serviano JL. Beyond flood hazard maps: detailed flood characterization with remote sensing, GIS and 2D modelling. Int Arch Photogramm Remote Sens Spat Inf Sci. 2016;XLII-4-W1:315–23.
Urbanski JA, Wochna A, Bubak I, Grzybowski W, Lukawska-Matuszewska K, Łącka M, et al. Application of Landsat 8 imagery to regional-scale assessment of lake water quality. Int J Appl Earth Obs. 2016;51:28–36.
Devlin MJ, Petus C, da Silva E, Tracey D, Wolff NH, Waterhouse J, et al. Water quality and river plume monitoring in the great barrier reef: an overview of methods based on ocean colour satellite data. Remote Sens-Basel. 2015;7:12909–41.
Pahlevan N, Schott JR, Franz BA, Zibordi G, Markham B, Bailey S, et al. Landsat 8 remote sensing reflectance (Rrs) products: evaluations, intercomparisons, and enhancements. Remote Sens Environ. 2017;190:289–301.
Gao H, Wang L, Jing L, Xu J. An effective modified water extraction method for Landsat-8 OLI imagery of mountainous plateau regions. IOP C Ser Earth Env. 2016;34:012010.
Xie H, Luo X, Xu X, Pan HY, Tong XH. Evaluation of Landsat 8 OLI imagery for unsupervised inland water extraction. Int J Remote Sens. 2016;37:1826–44.
USGS. Landsat 8 (L8) data users handbook. Version 2.0. Reston: U.S. Geological Survey; 2016.
Knight EJ, Kvaran G. Landsat-8 operational land imager design, characterization and performance. Remote Sens-Basel. 2014;6:10286–305.
Work EA, Gilmer DS. Utilization of satellite data for inventorying prairie ponds and lakes. Photogramm Eng Rem S. 1976;42:685–94.
Adam E, Mutanga O, Rugege D. Multispectral and hyperspectral remote sensing for identification and mapping of wetland vegetation: a review. Wetl Ecol Manag. 2010;18:281–96.
Congedo L. Semi-automatic classification plugin documentation. Release 5.0.0.1; 2016.
USGS and NASA. Landsat 7 (L7) data users handbook. Sioux Falls and Greenbelt: U.S. Geological Survey and National Aeronautics and Space Administration; 2018.
Chavez PS. Image-based atmospheric corrections - revisited and improved. Photogramm Eng Rem S. 1996;62:1025–36.
Cui LL, Li GS, Ren HR, He L, Liao HJ, Ouyang NL, et al. Assessment of atmospheric correction methods for historical Landsat TM images in the coastal zone: a case study in Jiangsu, China. Eur J Remote Sens. 2014;47:701–16.
Giannini MB, Belfiore OR, Parente C, Santamaria R. Land surface temperature from Landsat 5 TM images: comparison of different methods using airborne thermal data. J Eng Sci Technol Rev. 2015;8:83–90.
Singh K, Ghosh M, Sharma SR. WSB-DA: water surface boundary detection algorithm using Landsat 8 OLI data. IEEE J-Stars. 2016;9:363–8.
Chavez PS. An improved dark-object subtraction technique for atmospheric scattering correction of multispectral data. Remote Sens Environ. 1988;24:459–79.
Gilmore S, Saleem A, Dewan A. Effectiveness of DOS (Dark-Object Subtraction) method and water index techniques to map wetlands in a rapidly urbanising megacity with Landsat 8 data. In: Research@Locate’15. Brisbane; 2015 March 10-12.
Ke YH, Im J, Lee J, Gong HL, Ryu Y. Characteristics of Landsat 8 OLI-derived NDVI by comparison with multiple satellite sensors and in-situ observations. Remote Sens Environ. 2015;164:298–313.
Nazeer M, Nichol JE, Yung YK. Evaluation of atmospheric correction models and Landsat surface reflectance product in an urban coastal environment. Int J Remote Sens. 2014;35:6271–91.
Song C, Woodcock CE, Seto KC, Lenney MP, Macomber SA. Classification and change detection using Landsat TM data: when and how to correct atmospheric effects? Remote Sens Environ. 2001;75:230–44.
Yanti A, Susilo B, Wicaksono P. The aplication of Landsat 8 OLI for total suspended solid (TSS) mapping in Gajahmungkur reservoir Wonogiri regency 2016. IOP C Ser Earth Env. 2016;47:012028.
Yepez S, Laraque A, Martinez JM, De Sa J, Carrera JM, Castellanos B, et al. Retrieval of suspended sediment concentrations using Landsat-8 OLI satellite images in the Orinoco River (Venezuela). Compt Rendus Geosci. 2018;350:20–30.
Sobrino JA, Jiménez-Muñoz JC, Paolini L. Land surface temperature retrieval from LANDSAT TM 5. Remote Sens Environ. 2004;90:434–40.
Tizado EJ. i.landsat.toar - calculates top-of-atmosphere radiance or reflectance and temperature for Landsat MSS/TM/ETM+/OLI. Bonn: GRASS Development Team; 2017.
Johnson BA, Tateishi R, Hoan NT. Satellite image pansharpening using a hybrid approach for object-based image analysis. ISPRS Int J Geo-Inf. 2012;1:228–41.
Phiri D, Morgenroth J, Xu C, Hermosilla T. Effects of pre-processing methods on Landsat OLI-8 land cover classification using OBIA and random forests classifier. Int J Appl Earth Obs. 2018;73:170–8.
Verpoorter C, Kutser T, Tranvik L. Automated mapping of water bodies using landsat multispectral data. Limnol Oceanogr-Meth. 2012;10:1037–50.
Gandhi U. Automating complex workflows using processing modeler; 2016.
Graser A, Olaya V. Processing: a python framework for the seamless integration of geoprocessing tools in QGIS. ISPRS Int J Geo-Inf. 2015;4:2219–45.
Finegold Y, Ortmann A, Lindquist E, d’Annunzio R, Sandker M. Map accuracy assessment and area estimation: a practical guide. Rome: Food and Agriculture Organization of the United Nations; 2016.
Congalton RG, Green K. Assessing the accuracy of remotely sensed data: principles and practices. 2nd ed. Boca Raton: CRC Press; 2008.
Heydari SS, Mountrakis G. Effect of classifier selection, reference sample size, reference class distribution and scene heterogeneity in per-pixel classification accuracy using 26 Landsat sites. Remote Sens Environ. 2018;204:648–58.
Wen T. r.kappa - calculates error matrix and kappa parameter for accuracy assessment of classification result. Bonn: GRASS Development Team; 2012.
Acharya TD, Lee DH, Yang IT, Lee JK. Identification of water bodies in a landsat 8 OLI image using a J48 decision tree. Sensors-Basel (Switzerland). 2016;16:1075.
Mohd Hasmadi I, Pakhriazad HZ, Shahrin MF. Evaluating supervised and unsupervised techniques for land cover mapping using remote sensing data. Geografia Malays J Soc Sp. 2009;5:1–10.
Ashraf MA, Maah MJ, Yusoff I. Introduction to remote sensing of biomass. In: Atazadeh I, editor. Biomass and remote sensing of biomass. London: IntechOpen; 2011. p. 129–70.
Mwaniki MW, Kuria DN, Boitt MK, Ngigi TG. Image enhancements of Landsat 8 (OLI) and SAR data for preliminary landslide identification and mapping applied to the central region of Kenya. Geomorphology. 2017;282:162–75.
Fisher A, Flood N, Danaher T. Comparing Landsat water index methods for automated water classification in eastern Australia. Remote Sens Environ. 2016;175:167–82.
Acknowledgements
The authors are grateful to the U.S. Geological Survey (USGS) Earth Resources Observation and Science (EROS) Center (https://earthexplorer.usgs.gov) for providing free images. The authors also acknowledge the graduate scholarship funding from Department of Science and Technology – Engineering Research and Development Technology (DOST-ERDT), Philippines that have made this research endeavour possible.
Author information
Authors and Affiliations
Contributions
JPM conceived the idea of investigating water index using the latest Landsat 8. JPM and AFT conceptualized the research, coordinated in downloading appropriate Landsat 8 image for the study and agreed on the use of an open-source QGIS. AFT initiated image processing and building of a graphical modeler. JPM conducted the image classification by threshold and knowledge based methods. The authors analyzed the spectral signatures of water and non-water bodies. JPM performed the analysis of obtaining threshold values and conducted accuracy assessment. JPM wrote the paper. AFT contributed to the paper revisions. All authors read and approved the final manuscript.
Corresponding author
Ethics declarations
Competing interests
The authors declare that they have no competing interests.
Publisher’s Note
Springer Nature remains neutral with regard to jurisdictional claims in published maps and institutional affiliations.
Rights and permissions
Open Access This article is distributed under the terms of the Creative Commons Attribution 4.0 International License (http://creativecommons.org/licenses/by/4.0/), which permits unrestricted use, distribution, and reproduction in any medium, provided you give appropriate credit to the original author(s) and the source, provide a link to the Creative Commons license, and indicate if changes were made. The Creative Commons Public Domain Dedication waiver (http://creativecommons.org/publicdomain/zero/1.0/) applies to the data made available in this article, unless otherwise stated.
About this article

Cite this article
Mondejar, J.P., Tongco, A.F. Near infrared band of Landsat 8 as water index: a case study around Cordova and Lapu-Lapu City, Cebu, Philippines. Sustain Environ Res 29, 16 (2019). https://doi.org/10.1186/s42834-019-0016-5
Received:
Accepted:
Published:
DOI: https://doi.org/10.1186/s42834-019-0016-5