
Abstract
This paper investigates the effect of clay content on the shear strength of clay–sand mixtures. Bentonite and Jumunjin sand were mixed to prepare clay–sand mixtures with varying clay contents of 5, 10, 15, 20, 25 and 30%. The shear strength of clay–sand mixture was measured using direct shear tests and angle of repose tests in dry condition. The angle of repose of the clay–sand mixture was measured to be greater than that of pure sand for the studied range of clay contents. Likewise, the internal friction angle of the clay–sand mixture was measured to be higher than that of pure sand, reaching a peak at the clay content of 10%. Theoretically, the behavior of the clay–sand mixtures was to be governed by large size particles at clay contents smaller than 23.5%, which agrees well with the visual inspection on the mixtures. At clay content of 25.1% or greater, where the contribution of large particle was theoretically assumed to be none, the results from the angle of repose tests were significantly scattered, indicating that the clay started playing a key role in the behavior of mixtures.
Introduction
While soil mechanics have been developed chiefly based on the test results of pure sand or pure clay, the soils encountered in the field are mostly mixtures of various soils. The mechanical behavior of such soil mixtures is very difficult to define in a few parameters as the fraction of fine and coarse grains can be infinite. Nevertheless, the behavior of soil mixtures has been investigated with different combination of different soil types.
Numerous researches have been conducted on clay-silt-sand mixtures [1,2,3,4,5,6,7,8]. Karim et al. [1] defined the limit fine content where the behavior of the mixtures changed, which was determined to be 30% of fine content. Nagaraj [2] conducted unconfined compressive tests using the clay–sand mixtures of sand, bentonite, kaolinite and two natural soils. It was discovered that the mixtures had the highest unconfined compressive strength at 40 to 60% of sand fractions regardless of clay type. Vallejo et al. [3] measured the shear strength and the porosity of the kaolinite clay–sand mixtures with various clay content. The shear strength of the mixtures was governed by sand at clay content lower than 25%, while governed by clay at clay content higher than 60%. Chang et al. [4] conducted a cyclic simple shear test on the kaolinite clay–sand mixtures, and discovered that cyclic resistance and clay content were in a linear relationship at the same void ratio. Simpson et al. [5] used kaolinite clay–sand mixture for oedometer test, fall cone test, triaxial test, and adopted thermal needle probes to investigate the mechanical characteristics such as consistency, critical state strength, and compressibility. From the test results, the clay content of determining the transition from “sand-like” to “clay-like” behavior was obtained. The result showed that the “limit clay content” at which behavior changed from “sand-like” to “clay-like” differed depending on the measured properties.
Mollins et al. [6] studied the properties of clay–sand mixtures (Wyoming bentonite and Knapton Quarry sand) using swelling tests and hydraulic conductivity tests. The swelling test results showed that the bentonite reached a void ratio of specific confining stress, and this void ratio and the logarithm of vertical effective stress was in a linear relationship. Correlation of the permeability with the void ratio of bentonite was expressed by a power law. Later, Mollins et al. [7] measured the drained strength of bentonite clay–sand mixtures with different clay contents and relative density. The relative density and friction angle of sand at a critical state affected the ultimate shear strength of clay–sand mixtures. Dafalla [8] investigated the effects of clay content and moisture content on shear strength of clay–sand mixtures. As the water content increased, the cohesion and internal friction angle of clay–sand mixtures decreased. Moreover, at higher clay contents, the increase in water content sharply reduced the cohesion and internal friction angle. The increasing clay content resulted in an increase in cohesion for low clay content such as 5 and 10%; however, at clay content as high as 20%, cohesion could decrease.
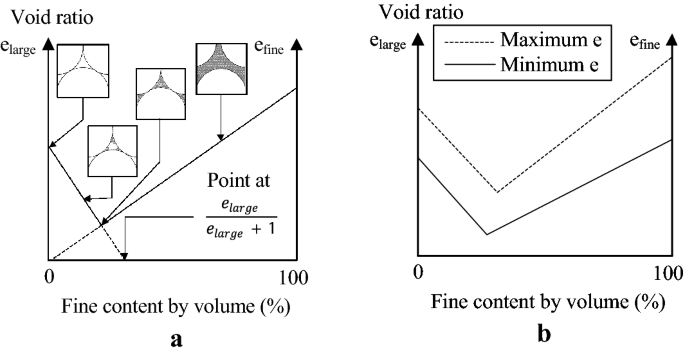
The variation of material properties with void ratio may be attributed to many factors such as void, relative density, compressibility, and permeability. The void variation with volumetric fine content was theoretically derived by Lade et al. [9]. In their paper, soil grains were assumed to be non-plastic complete sphere with an identical size. Figure 1a illustrates the theoretical variation of void ratio with fine contents in volume along with conceptual void filling figures. The variation of void ratio was expressed for both maximum and minimum in Fig. 1b.
(modified from Lade et al. [9])
a Theoritical variation of void ratio and void filling with fine contents, and b variation of maximum and minimum void ratio with fine contents
Ueda et al. [10] evaluated the theoretical contribution of large and small particles on the mechanical properties of the mixtures of the two-sized particles. The 2-dimensional discrete element methods and experiments were adopted. The contribution of large particle to shear strength changed from one at small clay content to zero at large clay content as shown in Fig. 2. The clay content where the contribution of large particle started diminishing was defined as the lower limit (W as ), and the clay content where the contribution of large particle become zero was defined as higher limit (W bs ). The contribution of large particle kept varying between the two limits. The shear strength of clay–sand mixture with low fine content depended on the properties of large size particle, and the void of such mixture appeared to be partially filled with fines. As the fine contents increased, the void was completely filled and the large size particles would be surrounded by fines. Subsequently, as shown in the Fig. 2, the shear zone was likely to occur within the zone of small particles and the behavior of clay–sand mixture started being governed by the property of small particles.
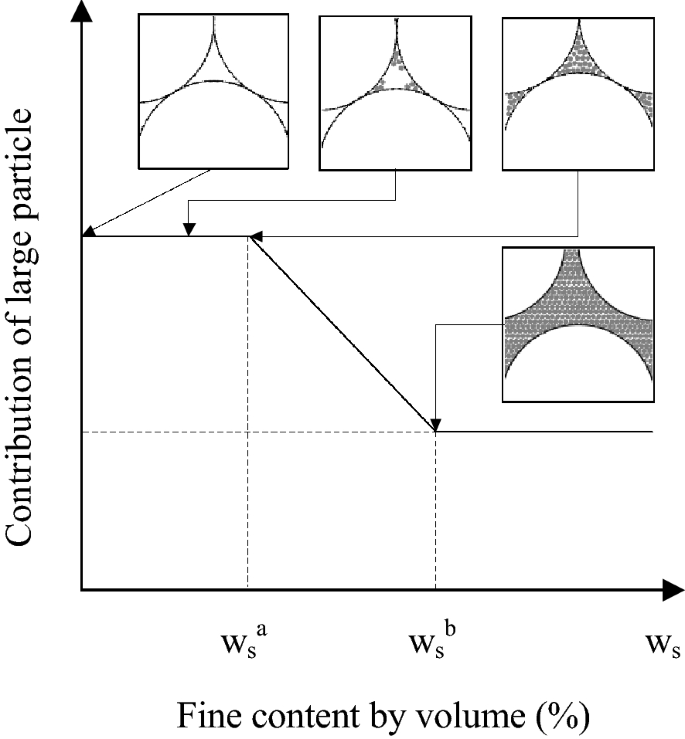
The theoritical variation of contribution of large particle to shear strength with varying fine content
In this study, the shear strengths of clay–sand mixtures were measured using the direct shear test and the angle of repose test. The bentonite and Jumunjin sand were adopted for clay and sand, respectively, and the clay content ranges from 0 to 30% in weight. The shear strength with different clay contents was measured, and results obtained from the tests were compared with respect to dry unit weight. In addition, the effect of void ratio on the shear strength was discussed based on theoretically derived chart and graphical comparisons.
Materials and testing methods
Sample preparation
The sand used for clay–sand mixture was the Jumunjin sand, and the properties are tabulated in Table 1. The specific gravity of sand is 2.65, and the minimum and maximum dry unit weight are, 13.43 kN/m3 and 15.62 kN/m3, respectively, indicating that the sand is very hard to compact. The grain size distribution is presented in Fig. 3; the sand was classified into SP (poorly graded sand) [11]. The sand mainly is comprised of quartz (60.1%), microcline (25.3%), and albite (14.6%), and slight inclusion of muscovite [12]. The used clay was powder bentonite (Samchun Chemical Co., Ltd., Korea). The specific gravity of the bentonite is 2.6, and Plastic Limit and Liquid Limit are 116.7 and 291.7, respectively. The reported median diameter of bentonite was about 5.4 μm [13].
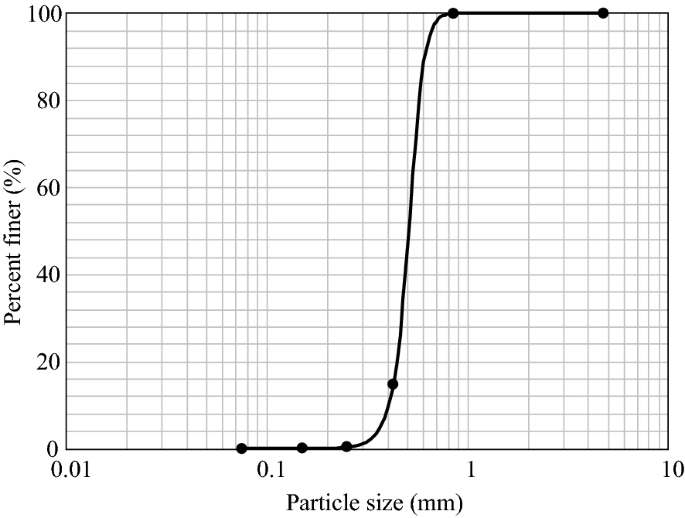
Grain size distribution of Jumunjin sand
The clay contents of the mixture were 0, 5, 10, 15, 20, 25, and 30% in weight. Table 2 tabulates the dry unit weight of mixtures in “loose state” for the range of clay contents and the soil classification of the specimens using the Unified Soil Classification System (USCS) [11]. The loose state indicated that the mixture was deposited as loose as possible. In this test, the mixtures were pluviated into the test box using a funnel from the drop height less than 13 mm, and the minimum dry unit weight was defined as the dry unit weight in loose state. Thus, the dry unit weight in loose state for clay content of 0% was identical to the minimum dry unit weight shown in the Table 1. Following experiments were conducted using the mixtures in dry and loose state as described here. The dry unit weight was measured using the funnel and the mold with a specific volume according to ASTM D 4254 [14].
Shear strength tests
Two tests were adopted to investigate the effect of clay contents on the shear strength: the direct shear test and the angle of repose test. The direct shear test was performed in accordance with ASTM D 3080 [15]. The clay–sand mixture was pluviated into the shear box of 6 cm in radius and 2 cm in height as was described in the foregoing section. After the specimen preparation, the bottom shear box was displaced with the strain rate of 1.2 mm per minute. In addition, relatively low normal stresses of 10.3, 20.0, and 29.8 kPa were used for comparison with angle of repose test.
The angle of repose is defined as the largest slope angle of a pile of cohesionless soils slowly forming by pouring materials [16]. Factors affecting the angle of repose include the drop height, particle size, grain shape, friction between sand and plate, and pouring method. Miura et al. [17] investigated the factors affecting the angle of repose. It was found that the angle of repose varied with the varying size of the sand heaps. In addition, decreasing pouring rate as well as the rough plate resulted in the increase in angle of repose. They developed the new device for angle of repose test to remove such defects, and the device was used in this study.
Figure 4 presents the device for the angle of repose and the testing procedures. The test device consists of the pedestal for holding soil heaps, the outer ring for the collapse of outer layer of sand by moving the ring down, and the spacer for gradual downward movement of the ring (Fig. 4a). The testing procedure is shown in Fig. 4b, c. The clay–sand mixture at the desired clay content was pluviated into the pedestal to form a conical heap in loose state (Fig. 4b). Then the spacer supporting the outer ring was slowly pulled out such that the perimetric mixtures on the ring could collapse and new conical heap shaped (Fig. 4c). The angle of repose was measured using the conical apex and the start of conical heap at lower left or right hand side (point A and B in Fig. 4c). Figure 5 provides the testing device and the measurement of angle of repose for pure sand.

Testing procedure using the angle of repose testing device. a The schematic view of a test device, b original soil heap before collapse, and c soil heap after collapse and the angle of repose measurement

Angle of repose test for Jumunjin sand at 0% clay content
Results and discussion
Experimental results
Figure 6 shows the test results obtained from direct shear tests with the applied normal stress and clay contents. As was expected, the shear strength of the mixtures increased with normal stress, while it might either increase or decrease with clay content. Using the test results, the failure envelopes of clay–sand mixtures were created for different clay contents as shown in Fig. 7. The cohesion of the mixture was assumed to be zero because comparison was made based on the internal friction angle only and because the apparent cohesion was sufficiently small. The failure envelopes were divided into two different ranges of clay contents: envelopes with clay contents of 10% and lower, and those with clay contents of 10% and greater. The internal friction angle was measured to be 35.7° for pure sand (CC = 0%), and inclined to peak value (38.7°) at clay content of 10%. At higher clay contents, the internal friction angle gradually decreased to 34.0° at clay content of 30%.
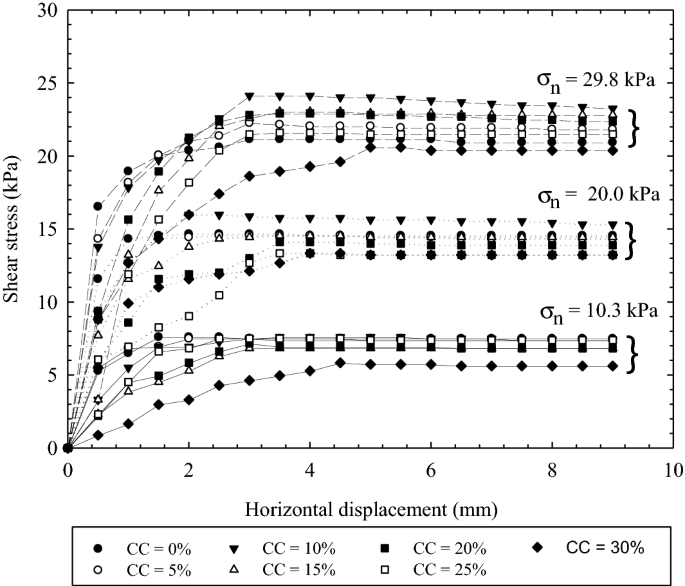
Horizontal displacement versus shear stress according to clay content and normal stress (*CC denotes clay content)
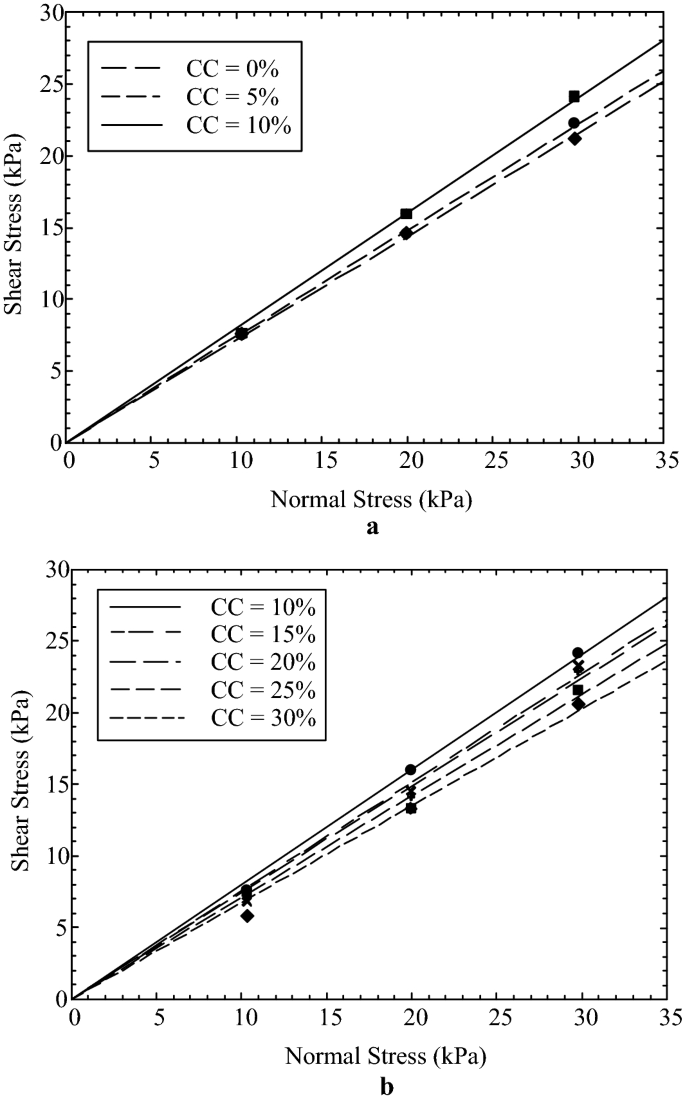
Failure envelopes of clay–sand mixtures from direct shear tests for clay content ranges of a 0–10%, and b 10–30%
The friction angles measured from the two different tests are summarized along with the dry unit weight in Table 2. The shear strength measured from both tests increased with the increase in the clay content at clay contents of low range, which was likely because the void of “loose state” sand was filled with clays. This could be inferred from the increase in the dry unit weight of clay–sand mixtures up to the clay content of 20%, and the dry unit weight slightly decreased at clay contents of 25 and 30%. Interestingly, the angle of repose started being scattered at large clay contents. Figure 8 compares the internal friction angle from direct shear test with the angle of repose with different clay contents. The angle of repose of granular soil might approximate the internal friction angle in loose state [18], and it was likely in linear relationship at same relative density [19]. Similar behavior was observed in this study. The angle of repose appeared to be proportional to the internal friction angle at clay contents of 0% to 10%, but they were not correlated at high clay contents. In addition, angle of repose was always measured higher than internal friction angle as in the literature [20].
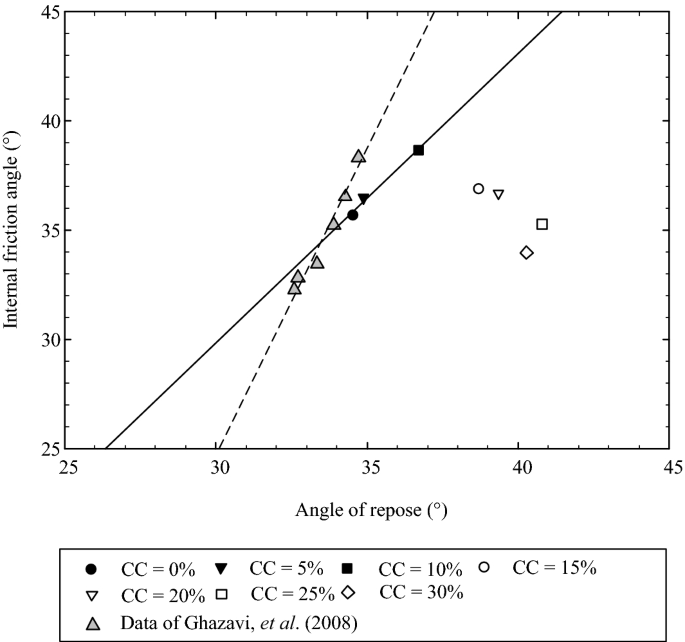
Relationship between angle of repose and internal friction angle
Contribution of clay contents
The variation of void in clay–sand mixtures can be derived using the theoretical model by Lade et al. [9] and Ueda et al. [10]. Figure 9 shows the variation of void with clay content in volume, and the back-calculated voids of clay–sand mixtures with seven different clay contents. The solid line is the maximum void ratio (corresponding to loose state in this study) of clay–sand mixture calculated based on the theory by Lade et al. [9]. The theoretical maximum void ratio was calculated to be lowest (0.835) at clay content of 23.4% in weight, corresponding to the theoretical maximum dry unit weight (14.38 kN/m3). The back-calculated voids indicated that the maximum void ratio occurred between 20 and 25% of clay contents. This finding agreed well with the variation of dry unit weight as shown in Table 1. At greater clay contents, sand grains would be surrounded by clay particles rather than void filled with clays (see Fig. 1a). Thus, the dry unit weight appeared to decrease with further addition of clays. This was qualitatively confirmed using the photomicrographs as shown in Fig. 10. At clay contents from 0% (pure sand) to 15%, the clay filled into the voids and sand grains were in contact; on the other hand, the sand grains were covered by clays for the clay contents of 25 and 30%. The mixture at 20% clay content seemed to be in transition phase. For this reason, at high clay contents, the effect of the clay between particles increased, and the strength of the clay–sand mixtures become closer to that of the clay. Hence, the internal friction angle declined as clay content increased after a certain clay content.
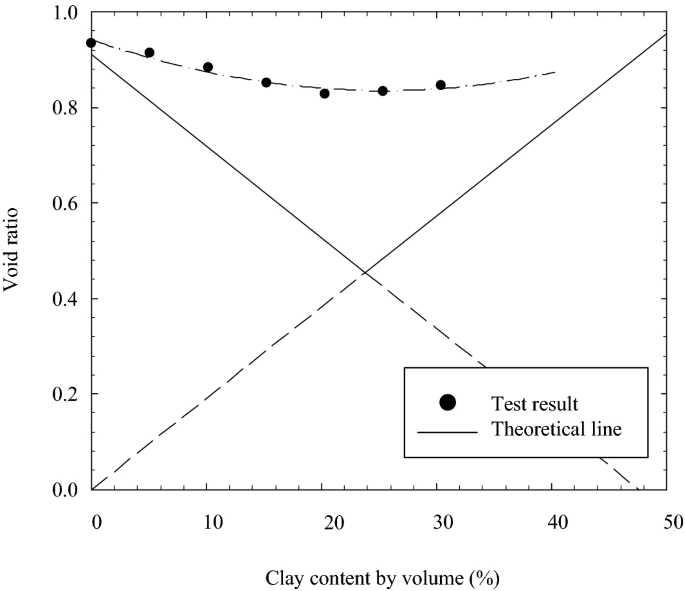
Changes of void ratio with clay content

Microscopic photos of clay–sand mixtures for clay content of a 0%, b 5%, c 10%, d 15%, e 20%, f 25%, and g 30%
The variation of clay contents also affected the mechanical behavior of the mixture. As was introduced in the foregoing literature review, there were low and high limit of clay contents where the contribution of large and small size particles changed. Figure 11 shows the variation of W as and W bs of clay–sand mixture for the different particle size ratio (α). The particle size ratio was defined by the median diameter of sand and clay, and it was calculated to be 92.6. Subsequently, the low and high limit clay contents (W as and W bs ) were calculated to be 24.0 and 25.1%, respectively.
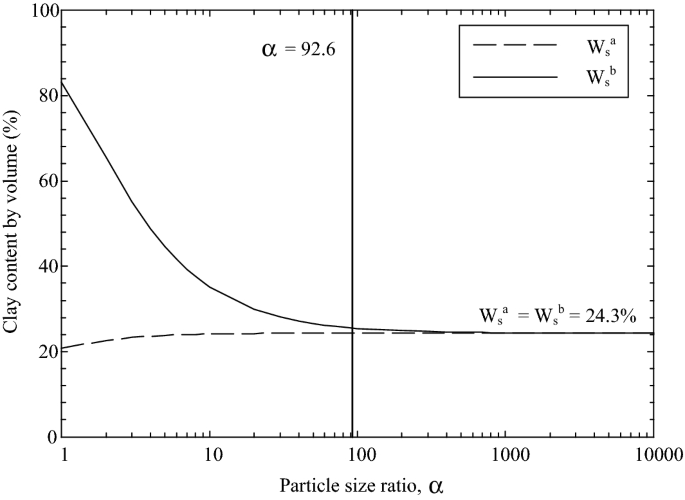
(modified from Ueda et al. [10])
The variation of W as and W bs with particle size ratio
Although large particle size was theoretically believed to govern the behavior of mixture at low clay content, the internal friction angle from direct shear tests varied for different clay contents. The internal friction angle of pure sand was 35.7°, which increased to peak value 38.7° at clay content of 10% and returned to 35.3° for 25%. As was commented by Ueda et al. [10], the contribution of small particles should not be neglected even at low clay contents. Likewise, the angle of repose varied with clay contents, showing gradual increase up to the clay content of 30% (the maximum in this study). It is worthy of noting that the scattering of angle of repose becomes significant at around 25%, where the clay content is believed to start governing the behavior. Indeed, the heap of mixtures with high clay content did not form a conical shape as pure sand during angle of repose test, making the measurement of angle difficult and uncertain. This difficulty also arose in measuring the angle of repose of pure bentonites since the measurements differed at every measurements. At low clay content, the angle of repose appeared to be related with the dry unit weight of the mixtures so that the void filling significantly increased the value until the clay become dominant.
Conclusions
The shear strength of clay–sand mixtures was measured using both direct shear test and angle of repose test. The test specimens of clay–sand mixtures were prepared with commercially available bentonite and Jumunjin sand with different clay contents ranging from 0 to 30%. The specimens were prepared in loose state such that the dry unit weight was the minimum for each mixture. The measured internal friction angle, angle of repose, and the dry unit weight were compared and analyzed in order to investigate the effect of clay contents on the mechanical behavior of mixtures. From the test results and observations, following conclusions were drawn:
-
(1)
The internal friction angle of clay–sand mixture was 35.7° for pure sand, which increased to peak value (38.7°) up to the clay content of 10%; it gradually decreased to 34.0° at clay content of 30%. However, the angle of repose was found to increase up to the higher clay content (25%) with significant scatters of test results which was likely due to the dominance of clay content in the mixtures.
-
(2)
The angle of repose was in linear relationship with internal friction angle at low clay contents (up to 10%) where the contribution of large size particles was significant, while they were not correlated at higher clay contents.
-
(3)
The back-calculated voids in loose state lie between the clay contents of 20 and 25%, and this finding agrees well with the variation of dry unit weight. According to the photomicrographs, sand grains was surrounded by clay particles at higher clay contents and the void was filled with clays with clay particles at lower clay contents.
References
Karim ME, Alam MJ (2017) Effect of nonplastic silt content on undrained shear strength of sand–silt mixtures. Int J Geo Eng 8(1):14
Nagaraj H (2016) Influence of gradation and proportion of sand on stress–strain behavior of clay–sand mixtures. Int J Geo Eng 7(1):19
Vallejo LE, Mawby R (2000) Porosity influence on the shear strength of granular material–clay mixtures. Eng Geol 58(2):125–136
Chang WJ, Hong ML (2008) Effects of clay content on liquefaction characteristics of gap-graded clayey sands. Soils Found 48(1):101–114
Simpson D, Evans T (2016) Behavioral thresholds in mixtures of sand and kaolinite clay. J Geotech Geoenviron Eng 142(2):04015073
Mollins L, Stewart D, Cousens T (1996) Predicting the properties of bentonite-sand mixtures. Clay Miner 31(2):243–252
Mollins L, Stewart D, Cousens T (1999) The drained strength of bentonite enhanced sand. Geotechnique 49(4):523–528
Dafalla MA (2013) Effects of clay and moisture content on direct shear tests for clay–sand mixtures. Adv Mater Sci Eng 2013:562726
Lade PV, Liggio C, Yamamuro JA (1998) Effects of non-plastic fines on minimum and maximum void ratios of sand. Geotech Test J 21(4):336–347
Ueda T, Matsushima T, Yamada Y (2011) Effect of particle size ratio and volume fraction on shear strength of binary granular mixture. Granul Matter 13(6):731–742
ASTM (2017) Standard practice for classification of soils for engineering purposes (Unified Soil Classification System). American Society for Testing and Materials, West Conshohocken
Lee T, Lee S, Ryu D, Youn H (2018) Wear resistance of four rocks using rotary abrasion test in dry and wet conditions. J Test Eval 46(6):2389–2398
Kiviranta L, Kumpulainen S (2011) Quality control and characterization of bentonite materials. Posiva working report 2011-84. Posiva Oy, Helsinki
ASTM (2016) Standard test methods for minimum index density and unit weight of soils and calculation of relative density. American Society for Testing and Materials, West Conshohocken
ASTM (2011) Standard test method for direct shear test of soils under consolidated drained conditions. American Society for Testing and Materials, West Conshohocken
Taylor D (1948) Fundamentals of soil mechanics. Chapman and Hall Limited, New York
Miura K, Maeda K, Toki S (1997) Method of measurement for the angle of repose of sands. Soils Found 37(2):89–96
Ranjan G, Rao A (2007) Basic and applied soil mechanics. New Age International, New Delhi
Ghazavi M, Hosseini M, Mollanouri M (2008) A comparison between angle of repose and friction angle of sand. In: Proceedings of the 12th international conference of international association for computer methods and advances in geomechanics, Goa, India, pp 1272–1275
Kajuna S, Rugenga E (1998) Relationship between the angle of repose and angle of internal friction for agricultural granular materials. Tanz J Agric Sci 1(2):187–194
Authors’ contributions
DK carried out the laboratory experiments and prepared for the manuscript, BHN participated in the result analysis, and HY conceived and designed the study. All authors read and approved the final manuscript.
Acknowledgements
This work was supported by National Research Foundation of Korea (NRF) funded by Ministry of Science, ICT & Future Planning (NRF-2016R1C1B2013478).
Competing interests
The author declares that he has no competing interests.
Publisher’s Note
Springer Nature remains neutral with regard to jurisdictional claims in published maps and institutional affiliations.
Author information
Authors and Affiliations
Corresponding author
Rights and permissions
Open Access This article is distributed under the terms of the Creative Commons Attribution 4.0 International License (http://creativecommons.org/licenses/by/4.0/), which permits unrestricted use, distribution, and reproduction in any medium, provided you give appropriate credit to the original author(s) and the source, provide a link to the Creative Commons license, and indicate if changes were made.
About this article

Cite this article
Kim, D., Nam, B.H. & Youn, H. Effect of clay content on the shear strength of clay–sand mixture. Geo-Engineering 9, 19 (2018). https://doi.org/10.1186/s40703-018-0087-x
Received:
Accepted:
Published:
DOI: https://doi.org/10.1186/s40703-018-0087-x