
Abstract
Background
Reports on alterations in somatic neural functions due to non-diabetic obesity, a major risk factor for diabetes, are few and still a matter of debate. Nevertheless, to our knowledge, reports lack any comments on the type of somatic nerve fibers affected in non-diabetic obesity. Therefore, this study aimed to find out the alteration in somatic neural functions in non-diabetic obese persons if any.
Methods
The study was conducted on 30 adult non-diabetic obese persons (mean age 32.07 ± 7.25 years) with BMI > 30 Kg/m2 (mean BMI 30.02 ± 2.89 Kg/m2) and 29 age- and sex-matched normal weight controls (mean age 30.48 ± 8.01 years) with BMI: 18–24Kg/m2 (mean BMI 21.87 ± 2.40 Kg/m2). Nerve conduction study (NCS) variables of median, tibial and sural nerves were assessed in each subject using standard protocol. The data were compared by Mann Whitney ‘U’ test.
Results
In comparison to normal weight persons, obese had lower compound muscle action potential (CMAP) amplitudes of right median [9.09(7.62–10.20) Vs 10.75(8.71–12.2) mV, p = 0.025] and bilateral tibial nerves [Right: 8.5(7.04–11.18) Vs 12.1(10.55–15) mV, p < 0.001 and left 9.08(6.58–11.65) Vs 13.05(10.2–15.6) mV, p = 0.002]. Furthermore, obese persons had prolonged CMAP durations of right and left median [10.5(9.62–12) Vs 10(8.4–10.3) ms, p = 0.02 and 10.85(10–11.88) Vs 10(9–10.57) ms, p = 0.019] and right tibial [10(9–11) 8.5(7.92–10) ms, p = 0.032] nerves. Sensory NCS (sural nerve) also showed diminished sensory nerve action potential (SNAP) amplitude [16(12.08–18.21) vs 22.8(18.3–31.08) μV, p < 0.001] and prolonged duration. However, onset latencies and conduction velocities for all nerves were comparable between the groups.
Conclusion
This study documents subclinical peripheral nerve damage in non-diabetic obese with abnormal NCS parameters; shorter amplitudes and prolonged CMAP and SNAP durations. The reduced amplitudes of mixed and sensory nerves might be due to decreased axonal number stimulation or actual decrease in number of axonal fibers, or defect at NMJ in non-diabetic obese. Prolonged durations but normal onset latencies and conduction velocities strongly suggest involvement of slow conducting fibers.
Background
Obesity is a medical condition with a multifactorial etiology. Due to worldwide prevalence of this disorder, it is increasingly considered one amongst the major public health problems, with at least 2.8 million people dying each year as a result of being overweight or obese. Moreover, obesity has become common place in many low- and middle-income south Asian countries, including Nepal and Bangladesh with prevalence being 10% and 8.9% respectively. There are many reports suggesting that obesity causes various alterations in hemodynamic and metabolic systems which affect the functions of many organs and the systems [1, 2].
Obesity is a major risk factor for diabetes. There are substantial reports and established findings on alterations in somatic neural functions due to diabetes [3]. However, only a few have reported functional alterations in somatic neurons merely due to obesity [4]. Further in our geographical setting, reports lack commenting on somatic nerve functions in non-diabetic obese. Therefore, the effects of obesity on somatic neuronal functions are controversial and need to be explored. To our knowledge, reports lack any comments on the type of somatic neural fibers affected most while alterations in somatic neural functions due to non-diabetic obesity.
Somatic sensory and motor nerve conduction studies (NCS) were used to assess their structural and functional alterations [5, 6]. Thus, the study aimed to investigate motor (MNCS) and sensory (SNCS) nerve conduction in non-diabetic obese patients to examine the relevance for the development of subclinical peripheral nerve damage along with exploring the possible order or type of neural fibers involvement. Further, study can be extended to investigate the cause for alterations in neural functions, if any, which may be due to metabolic or structural alterations in neurons as a result of obesity.
Methods
Subjects
This cross-sectional comparative study was conducted over a year (2011–2012) in the Neurophysiology laboratory in the Department of Basic and Clinical Physiology, B. P. Koirala Institute of Health Sciences (BPKIHS), Dharan, Nepal. The convenient sampling was used for the recruitment of the subjects and was selected purposively among the medical staffs and students at BPKIHS having similar lifestyle to avoid the effect of amount, type and intensity of physical activity on nerve response. Thirty non-diabetic obese individuals (Age 32.07 ± 7.25 years) and 29 age- matched normal weight controls (Age 30.48 ± 8.01 years) participated in the study. The percentage contribution of male and female was 50% each in obese group, and 53.33% male and 46.66% female was in normal weight group.
Mean BMI of the obese patients and controls were (32.02 ± 2.89 Kg/m2) and (21.87 ± 2.40 Kg/m2), respectively, p < 0.001. Obese was defined (WHO) as a BMI of over 30, and normal weight was defined as a BMI of less than 25, i.e., between 18 and 24(kg/m2) [7, 8]. To be included, subjects were required to be between 18 and 75 years old and they also had to meet the BMI criteria noted above. Informed written consent was taken from all the subjects and they were screened for any history of drugs/alcohol intake, upper and lower extremity fractures, the familial history of neuropathy, or medical illness likely to affect the nerve conduction study parameters based on clinical history and physical examinations including detailed neurological assessment. Diabetic persons were excluded from the study according to American Diabetes Association criteria (American Diabetes Association, 2003), which defines a plasmatic basal glucose level higher than 126 mg/dL as a reliable indicator of diabetes [9]. The choice of the patients was very selective, to attribute a potential pathogenetic value to a metabolic alteration typical of the obese patients, represented by normal blood glucose level. Plasma glucose level was measured in the clinical laboratory, Department of Biochemistry, BPKIHS, Dharan, Nepal. This study was conducted according to the guidelines of the Declaration of Helsinki and approved by the ethical committee, BP Koirala Institute of Health Sciences, Dharan, Nepal.
Room temperature of the laboratory was maintained at the thermo neutral zone i.e., 26 ± 2 °C. All the required set up was checked before commencing the test. Further, subjects were made comfortable and familiar with the laboratory set up and conditions, and were advised to relax completely during recording. A conventional neurographic study was performed to measure the NCS parameters under standard laboratory conditions by using a Nihon Kohden machine (NM-420S; H36, Japan).
Recording procedures
Anthropometric and blood pressure measurement
Age was recorded in complete years i.e., rounded of the nearest years. Standing height was recorded with stadiometer (Prestige brand) by making the subject stand without shoes and shocks with feet parallel and pointing forwards on a special platform to which vertical measuring rod, marked in metric scale was fixed. Subject was ensured to stand as tall as possible with positioning head in the Frankfort plane position (the plane joining lower border of left orbit and the upper margin of the external auditory meatus in horizontal position). The head piece of the stadiometer or the sliding part of the measuring rod was lowered so that the hair (if present) was pressed flat. Height was recorded in cm to the resolution of the height rule (i.e., the nearest quarter of a cm). Weight of each subject was taken on balanced beam scale (Dr. Morepen MS02B Mechanical weighing machine). The scale was placed on hard floor surface and calibrated with standardized weights at the beginning and end of each examining day. The subjects after removing their heavy outer garments (jacket, coat, trousers, skirts, wrist watch, mobile from pocket etc.) were asked to stand in the centre of the platform to distribute body weight evenly to both feet. The weight was recorded to resolution of the scale (the nearest 0.1 kg to 0.2 kg). Body mass index (BMI) was calculated from the standard formula i.e., BMI = weight (kg)/height (m2). Blood pressure (BP) was measured manually using mechanical aneroid sphygmomanometer and a quality stethoscope (MDF ® 808 Professional Aneroid Sphygmomanometer and Stethoscope). Systolic and Diastolic blood pressure were recorded in sitting upright position after a minimum of five-minute rest, palpatory was followed by ascultatory method of blood pressure measurement. BP was double checked for accuracy as recommended by AHA (American Heart Association) by taking reading with both arms and averaging the readings. Three readings were taken in the interval of 5 min rest and the average of readings was taken as final systolic and diastolic blood pressures.
Nerve conduction study
The neurophysiological study consisted of motor NCS (MNCS) and sensory NCS (SNCS) in median (mixed), tibial (motor), and sural (sensory) nerves. Nerve conduction studies were performed using standard techniques of supra-maximal percutaneous stimulation with a constant current stimulator and surface recording electrodes of electromyography on both extremities of each subject. SNCS was performed orthodromically for median nerves, anti-dromically for the sural nerves, using disposable surface electrodes with supramaximal stimulation. Skin surface temperature was measured over the dorsum of the hand and foot. The limb was warmed with a hairdryer if temperature was below 32 °C. Filter settings were 2 Hz to 10 kHz and 20 Hz to 2 kHz, respectively, for motor and sensory recordings.
-
i)
Motor nerve conduction study variables
For motor nerve conduction study, the stimulator with water soaked felt tips were used for surface stimulation. It was placed on the skin overlying the nerve at two or more sites (Table 1) along the course of nerve after cleaning the site with skin purifier. Before applying a brief pulse of current, ground electrode was placed between the stimulating and recording electrodes. The recording and the reference electrodes were placed using belly tendon montage with the recording electrode placed over the mid belly of the respective muscles, as close to the estimated end plate site as possible and the reference electrode to the tendon at a minimum distance of 3 cm. The sites of stimulation and recording electrodes for different nerves tested are shown in the Table 1 as described by Aminoff [5] and Misuilis [6].
Table 1 Stimulation and recording sites of motor nerves Burst of direct current with supramaximal stimulus and the electrical pulse duration of 200 μsec were used for the stimulation of nerve being studied. While stimulating, cathode of stimulator was faced distally. For each stimulation site (distal and proximal), latency, amplitude, duration and NCV were measured from the obtained CMAP.
Once a recording was made, the trace was stored for later analysis and the stimulating electrode was moved proximally to the second site. The distance between stimulating electrodes at proximal and distal sites was measured with a measuring tape and was fed into the machine for nerve conduction velocity calculation. For each stimulation site, onset latency was measured in milliseconds from the stimulus artefact to the first deflection of CMAP whereas peak latency was measured at the midpoint of the first negative peak. CMAP amplitude was measured from baseline to the negative peak (base to peak) and duration of CMAP was measured from the onset to the final return of waveform to the baseline (Fig. 1). For recording F-response or the late response, the stimulator was placed at the distal point of stimulation of each nerve with cathode proximally. Maximum, minimum and mean F-wave latencies were then measured (Fig. 2).
Fig. 1 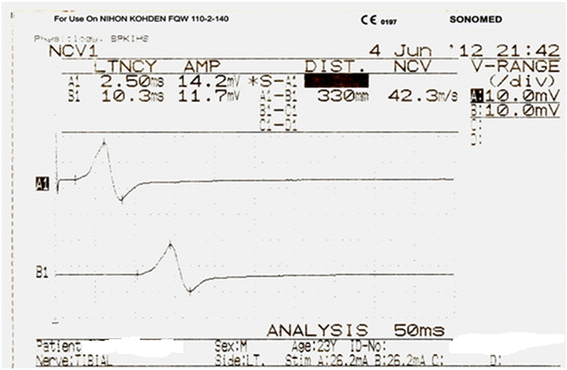
Representative trace of tibial distal and proximal compound muscle action potential
Fig. 2 
F-wave for Median nerve
-
ii)
Sensory nerve conduction study variables
For sensory nerve conduction study, orthodromic and antidromic method of stimulation was employed. Gain was set at 10 mV per division. The electrodes were essentially the same as those used for motor NCV. Skin purifier (skin pure) was used to clean electrode (recording) sites and to reduce skin surface impedance. Stimulating or recording electrodes were placed on a purely sensory portion of the nerve. Before stimulating the nerve, ground electrode was placed between the stimulating and recording electrodes. Antidromic method of stimulation was used for sural nerve and orthodromic used for median nerve. The sites of stimulation and recording electrodes for different nerves are shown in the Table 2 as described by Aminoff [5] and Misuilis [6]. For orthodromic conduction, ring electrodes were used to stimulate the digital nerve whereas surface stimulating electrodes were used for antidromic stimulation. An electrical pulse of either 0.1 m second duration was used and most nerve required a current in the range of 16 to 30 mA to achieve supra maximal stimulation. Current was slowly increased from a base liner of 0 mA, usually by 3–5 mA at a time until the recorded sensory potential was maximized. For each nerve, latency, amplitude, and conduction velocity of SNAP were recorded. Onset latency was measured from stimulus to the onset of initial negative deflection for biphasic SNAPs and to the initial peak for triphasic SNAPs. Peak latency was measured at the midpoint of the first negative peak. For this study the average of twenty responses was taken. SNAPs are usually biphasic or triphasic potentials. Unlike in motor studies, in sensory studies, conduction velocity was calculated with single stimulation because there is no transmission along neuromuscular junctions (NMJ) or muscle fibre. The duration of SNAP was measured firstly from the initial negative peak to return to the baseline. SNAP amplitude was measured form the baseline to negative peak.
Table 2 Stimulation and recording sites of sensory nerves


Statistical analysis
The SPSS software (v 16.02, Chicago, Illinois, USA) for personal computer was used for the statistical analyses. Shapiro-Wilk’s W test was applied to examine normality in the distribution of data. Anthropometric, cardiorespiratory and biochemical observations were distributed normally, therefore, parametric student’s t-test was applied for the statistical comparison and data were expressed in mean ± SD. Since the remaining observations had non-parametric distributions, the Mann whitney ‘U’ test was applied for the statistical comparison between study groups. The data were expressed as median (inter-quartile range) in tabulated form and p < 0.05 was the limit for a significant difference.
Results
Anthropometric and cardiorespiratory variables
Among the studied variables between the groups weight, body mass index, pulse rate, systolic blood pressure, and diastolic blood pressure were found to be significantly more in obese groups shown in Table 3.
Nerve conduction study (NCS) variables
The findings for MNCS and SNCS of obese and normal weight groups are presented in Tables 4, 5, 6 and 7. Among the studied motor NCS variables, compound muscle action potential (CMAP) amplitudes of right median (Table 4 and Fig. 3), right and left tibial (Table 5 and Fig. 4) nerves were significantly less in obese compared to control group. Distal and proximal CMAP durations for right median (Fig. 5) and tibial nerves (Fig. 6) of both sides were significantly prolonged in obese. The findings for sensory NCS were similar to that of motor NCS. The sensory nerve action potential (SNAP) amplitudes of median (Table 6 and Fig. 7) and sural nerves of both sides (Table. 7 and Fig. 8) were found to be reduced whereas SNAP durations for them (Figs. 9 and 10) were prolonged significantly in obese than in normal weight group.

CMAP amplitudes of median nerve in non-diabetic obese and normal weight adults

CMAP amplitudes of tibial nerve in non-diabetic obese and normal weight adults

CMAP durations of median nerve in non-diabetic obese and normal weight adults

CMAP durations of tibial nerve in non-diabetic obese and normal weight adults

SNAP amplitude of median nerve in non-diabetic obese and normal weight adults

SNAP amplitude of sural nerve in non-diabetic obese and normal weight adults

SNAP duration of median nerve in non-diabetic obese and normal weight adults

SNAP duration of sural nerve in non-diabetic obese and normal weight adults
Discussion
Obese persons had significantly higher body weight and BMI than normal weight controls. While comparing the nerve conduction study variables of peripheral somatic nerves, compound muscle action potential (CMAP) of median and tibial nerves showed lower amplitudes (median- proximal, and tibial- distal and proximal) in obese. Further, they had prolonged CMAP durations for median and tibial nerves. Similarly, the findings were found to be consistent with decreased sensory nerve action potential (SNAP) amplitudes and increased SNAP durations for median and sural sensory nerves.
The durations of the CMAPs and SNAPs mainly reflect the relative conduction rates of the impulses as they travel along the various axons between the stimulating and recording points [10]. In addition, CMAPs duration is primarily the measure of synchronized discharge of individual muscle fiber (i.e., the extent to which each of the individual muscle fibers fire at the same time). If there is a significant difference in the conduction velocity among nerve fibers, the duration will be prolonged. This is mainly related to the range of the conduction velocities of the large myelinated fibers. Furthermore, it is essential to note that latencies and conduction velocities reflect the fastest conducting fibres but, the many other slower conducting fibers participate in CMAP area and amplitude as well [11]. Increased CMAP (median and tibial nerves) and SNAP (median and sural nerves) durations in this study could be due to decreased conduction of nerve fibers (fastest and slower) in respective nerves resulting by either decreased myelination or axonal impairment (metabolic defect). However, there were no significant decrease in onset latencies and motor and sensory conduction velocities in obese persons. Thus, it can be concluded that increased CMAP duration could be due to alteration in slower conducting fibres. Our finding is supported by the study of Brismar et al.[12] and Selim et al. [13] that some nerve fibers might be more susceptible to damage than others, in particular, the small caliber or non-myelinated fibers, while others with diameters large enough to sustain the normal conduction velocities may be spared.
Whenever surface recording electrodes are used, amplitudes are semi-quantitative measures of the number of axons conducting impulses from the stimulating to the recording points. Amplitude (CMAP and SNAP) is a function of the total number of fibers stimulated and the synchronicity of the impulses [6]. There are several other influencing factors like the relative conduction rates along the axons, the distance between the recording electrodes and the fibers (nerve or muscle) generating the impulses. The CMAP amplitudes, in addition, are indicative of the efficiency of neuromuscular transmission, and the number of muscle fibers composing the recorded muscle that can generate action potentials [10, 14, 15].
This study revealed lower CMAP and SNAP amplitudes in obese as compared to normal weight controls. This could be due to variation in the relative conduction rates along the axons and decrease in the number of synchronically discharged neurons. Duration and amplitude are closely related: as the duration becomes more prolonged (i.e., the response becomes dispersed), the amplitude decreases [16]. Since, onset latencies and conduction velocities are normal, reduction in amplitudes also supports the probability of affecting slower and small calibre susceptible fibers. This finding is also supported by Ralph et al. [17], reporting that the sensory and mixed nerve amplitudes were lower in obese than in thin subjects. Similar results were obtained by Giacinta et al. [18], who found that the obese group showed significantly decreased compound muscle action potential amplitude of tibial and peroneal nerves and decreased sensory action potential amplitude of all nerves. They also aided the reason for decrement in amplitudes could be specific metabolic alterations [19] as in non-diabetic obese showing hyperinsulinemia and low insulin sensitivity that may be preclinical reason for onset of diabetes [20]. Similarly, a study by Robert Werner [21], noticed that obesity does not influence carpal canal pressure or the size of the median nerve at the wrist. However, there is a strong association between slowed median nerve conduction and increased nerve size, which suggests endoneural edema as a metabolic mechanism; the conduction slowing does not appear to be related to mechanical stress. Similar results were also obtained by other researchers [22–24], but they postulated the reason for decrease in amplitude could be a thicker subcutaneous adipose layer since most routine NCSs are performed using percutaneous stimulation and recording technique.
In this study, onset latencies, F-wave latencies and nerve conduction velocities did not differ significantly between the groups. Similar to this study, Buschbacher found no association between ulnar NCS and weight in ulnar nerve motor conduction to the abductor digiti minimi [25]. In contrast to this study, Dumitru mentioned that, since more adipose tissue in the epineurium would tend to better insulate the axon, the nerves of more obese persons might be expected to conduct their impulses more rapidly than in thin persons [26]. Simmons et al. [27], however, demonstrated that overweight patients had faster ulnar Across-elbow (AE) NCSs, and suggested that the skin measurements overestimate the nerve distance in this population leading to a falsely fast NCS. Similar to Simmons et al.[27], Landau et al. [28] reported that increasing BMI directly correlated with increasing ulnar motor NCV across the elbow but not with forearm NCV. Across-elbow (AE) ulnar motor NCS may be falsely increased in patients with a high BMI, probably due to distance measurement factors.
Obesity is well known risk factor for metabolic derangements, like functional alterations on different ion channels, especially on Na-K channels of nodes of Ranvier [21]. Thus, it may be concluded that prolonged CMAP and SNAP durations might be due to a specific metabolic alteration affecting mostly slower conducting fibers and decreased amplitudes of mixed and sensory nerves might be due to decreased axonal number stimulation or actual decrease in number of axonal fibers, or defect at NMJ in non-diabetic obese.
Conclusion
This study, although conducted in a small number of patients and lacks the relation between body fat composition and Nerve conduction, documents subclinical peripheral nerve impairment in non-diabetic obese with abnormal NCS parameters. Prolonged durations but normal onset latencies and conduction velocities suggest involvement of slow conducting fibers. Further, reduced amplitudes might be due to decreased number of stimulated fibers or/actual decrease in number of axonal fibers or/defect at NMJ in non-diabetic obese. These changes could be due to metabolic alterations due to obesity. These abnormal somatic neural functions depicted by NCS strongly suggest that non-diabetic obesity could lead to future clinical neuropathy.
Further experimental studies based on a larger sample of obese patients, more accurate neurophysiological (i.e., near-nerve recording) and neuropathological (i.e., intraepidermal nerve fibers investigation) techniques, as well as animal models of obesity including histological findings, would provide stronger support for the effects of obesity on impaired somatic neural functions.
Abbreviations
- μV:
-
Microvolt
- BMI:
-
Body mass index
- BPKIHS:
-
B. P. Koirala Institute of Health Sciences
- CMAP:
-
Compound muscle action potential
- Ht:
-
Height
- Lt:
-
Left
- m/s:
-
Meter per second
- MNCS:
-
Motor nerve conduction study
- ms:
-
Millisecond
- mV:
-
Millivolt
- NCS:
-
Nerve conduction study
- Rt:
-
Right
- SNAP:
-
Sensory nerve action potential
- SNCV:
-
Sensory nerve conduction study
- WHO:
-
World Health Organization
- WHR:
-
Waist-hip ratio
- Wt:
-
Weight
References
Ng M, Fleming T, Robinson M, Blake Thomson B, et al. Global, regional, and national prevalence of overweight and obesity in children and adults during 1980–2013: a systematic analysis for the Global Burden of Disease Study 2013. The Lancet. 2014;384(9945):766–81.
Balarajan Y, Villamor E. Nationally representative surveys show recent increases in the prevalence of overweight and obesity among women of reproductive age in Bangladesh. Nepal and India J Nutr. 2009;139:2139–44.
Yagihashi S, Mizukami H, Sugimoto K. Mechanism of diabetic neuropathy: where are we now and where to go? Journal of Diabetes Investigation. 2011;2(1):18–32.
Mokdad AH, Ford ES, Barbara A, Bowman, et al. Prevalence of obesity, diabetes, and obesity-related health risk factors, 2001. JAMA. 2003;289(1):76–9.
Aminoff MJ. Clinical electromyography. In: Electrodiagnosis in clinical neurology. 4th ed. Philadelphia: Churchil Livingstone; 1999. p. 223–52.
Misuilis KE, Head TC. Nerve conduction study and electromyography. In: Piolo S, editor. Essentials of clinical Neuro Physiology. 3rd ed. Butterwoth: Heinemann Burlington; 2003. p. 127–60.
Haslam DW, James WP. “Obesity” (WHO/obesity and overweight: fact sheet no.311). Lancet. 2005;366(9492):1197–209.
Han TS, Sattar N, Lean M. ABC of obesity. Assessment of obesity and its clinical implications. BMJ. 2006;333(7570):695–8.
American Diabetes Association. Screening for type 2 diabetes. Diabetes Care. 2003;26(Suppl):21–4.
Isley MR, Kranss GL, Levin KH, Litt B, Shields RW, Wilbourn AJ. Electromyography/electroencephalography. Redford, Washington: SpaceLabs Medical; 1993.
Giacomini PS. Electromyography and neuromuscular disorders: clinical electrophysiologic correlations. McGill Journal of Medicine. 2006;9(2):173.
Brismar T, Sima AA, Greene DA. Reversible and irreversible nodal dysfunctionin diabetic neuropathy. Ann Neurol. 1987;21:504–7.
Demir S, Özer S, Alim S, Güneş A, Ortak H, Yılmaz R. Retinal nerve fiber layer and ganglion cell-inner plexiform layer thickness in children with obesity. International Journal of Ophthalmology. 2016;9(3):434–8.
Wilbourn AJ, Ferrante MA. Clinical electromyography. In: Joynt RJ, Griggs RC, editors. Baker’s clinical neurology [book on CD-ROM]. Philadelphia: WB Saunders; 2000.
Barthakur M, Hazarika A, Bhuyan M. Classification of peripheral neuropathy by using ANN based nerve conduction study (NCS) protocol. ACEEE Int J. 2014;5:1–4.
Katirji B. Clinical electromyography. Neurol Clin N Am. 2002;20:xi–xii.
Ralph M, Buschbacher MD. Department of Physical Medicine and Rehabilitation, CL 368, 541 North Clinical Drive, Indianapolis, Indiana 46202, USA Accepted 24 March 1998.
Miscio G, Guastamacchia G, Brunani A, Priano L, Silvia B, Mauro A. Obesity and peripheral neuropathy risk: adangerous liaison. Journal of the Peripheral Nervous System. 2005;10:354–8.
Peters AL. The clinical implications of insulin resistance. Am J Manag Care. 2000;6(13 Suppl):S668–74. discussion S675-81.
Vanhala P, Vanhala M, Kumpusalo E, Keinanen-Kiukaanniemi S. The quantitative insulin sensitivity check index QUICKI predicts the onset of type 2 diabetes better than fasting plasma insulin in obese subjects; a 5-year follow-upstudy. J ClinEndocrinolMetab. 2002;87:5834–7.
Werner RA, Jacobson JA, Jamadar DA. Influence of body mass index on median nerve function, carpal canal pressure, and cross-sectional area of the median nerve. Muscle Nerve. 2004;30:481–5.
Dorfman LJ, Robinson LR. AAEM minimonograph. Normative data inelectrodiagnostic medicine. Muscle Nerve. 1997;20:4–14.
Bolton C, Carter KM. Human sensory nerve compound action potentialamplitude: variation with sex and finger circumference. J Neurol Neurosurg Psychiatry. 1980;43:925–8.
Awang MS, Abdullah JM, Abdullah MR, et al. Nerve conduction study among healthy Malays. The influence of Age, height and body mass index on median, ulnar, common peroneal and sural nerves. The Malaysian Journal of Medical Sciences. 2006;13(2):19–23.
Buschbacher RM. Ulnar nerve motor conduction to the abductor digitiminimi. Am J Phys Med Rehabil. 1999;78(Suppl):9–14.
Dumitru D. Nerve conduction studies. In: Dumitru D, editor. Electrodiagnostic Medicine. Philadelphia: Hanley and Belfus; 1995. p. 111–209.
Simmons Z, Nicholson T, Wilde C, Manders EK. Variation of calculated ulnarmotor conduction velocity across the elbow with body mass index. Muscle Nerve. 1997;20:1607–8.
Landau ME, Barner KC, Campbell WW. Effect of body mass index on ulnar nerve conduction velocity, ulnar neuropathy at the elbow, and carpal tunnel syndrome. Muscle Nerve. 2005;32:360–3.
Acknowledgements
We gratefully acknowledge all the staff of the Department of Physiology for their dedication. We also thank all the subjects for their participation and collaboration.
Funding
There was no any funding resource for this work.
Availability of data and materials
The dataset and materials supporting the conclusions of this article is available upon request to the corresponding author.
Authors’ contributions
This work is a product of the intellectual environment of the whole team. All authors have read and approved the final version of the manuscript.
Competing interests
The authors declare that they have no competing interests.
Consent for publication
Not applicable.
Ethics approval and consent to participate
Informed written consent was taken from each participant included in this study. The study was approved by the institutional Ethical Committee, B. P. Koirala Institute of Health Sciences, BPKIHS, Nepal. All procedures were in accordance with the Helsinki declaration and its later amendments.
Author information
Authors and Affiliations
Corresponding author
Rights and permissions
Open Access This article is distributed under the terms of the Creative Commons Attribution 4.0 International License (http://creativecommons.org/licenses/by/4.0/), which permits unrestricted use, distribution, and reproduction in any medium, provided you give appropriate credit to the original author(s) and the source, provide a link to the Creative Commons license, and indicate if changes were made. The Creative Commons Public Domain Dedication waiver (http://creativecommons.org/publicdomain/zero/1.0/) applies to the data made available in this article, unless otherwise stated.
About this article

Cite this article
Yadav, R.L., Sharma, D., Yadav, P.K. et al. Somatic neural alterations in non-diabetic obesity: a cross-sectional study. BMC Obes 3, 50 (2016). https://doi.org/10.1186/s40608-016-0131-3
Received:
Accepted:
Published:
DOI: https://doi.org/10.1186/s40608-016-0131-3