
Abstract
The joint development of cultural heritage protection and tourism is an essential part of sustainable heritage tourism. Mount Lushan in China is such a site which in the past has had shortcomings in heritage protection and heritage tourism marketing. The present research addresses this issue by using digital technologies such as oblique aerial photography, 3D laser scanning technology, and 360 degrees panorama technology to digitize the Mount Lushan cultural landscape heritage site, integrating all elements to create a virtual tourism subsystem. It provides users with a virtual experience of cultural landscape heritage tourism and promotes cultural landscape tourism marketing. In addition, tourist flow and environmental subsystems were built through the integration of Internet of Things (IoT) technology and analytical models. The tourist flow subsystem can help managers to regulate tourist flow according to the tourist carrying capacity threshold. Managers can also conduct environmental health assessment and management through the "pressure-state-response" model provided by the environmental subsystem. Finally, a comprehensive platform was developed based on the system concept, which integrated the three subsystems and their functions, and developed different versions to provide a visual platform for tourists and managers. This study provides a new model for the joint development of cultural heritage protection and tourism activities.
Introduction
Cultural heritage tourism is an increasingly prominent form of tourism globally, bolstered by heritage listings of UNESCO [1]. Built environment or other forms of heritage are often regarded as a focus of social and economic development [2], and the tourism industry can be a driving force to promote heritage protection. Cultural heritage management departments generally assume asset ownership and daily management tasks, while the tourism industry is responsible for product development and marketing [3]. However, poor management of cultural heritage may lead to its degradation. Heritage sites may be damaged by fire or natural disasters, or by human-induced factors [4]. For example, the large flow of people typical of popular tourist destinations may indirectly damage the principal tangible and intangible cultural value of a heritage site [5]. It is thus imperative to strengthen the protection and management of heritage. The Internet has become an important marketing tool for tourism promotion [6], mainly because it can speed up information dissemination. However, whether the website efficiently conveys travel information or effectively promotes destinations is often uncertain as designers tend to focus on aesthetics rather than content [7]. In addition, the quantity and quality of information will affect the time it takes for users to visit the website pages, thereby further restricting the development of the tourism industry.
The "digitalization" of heritage can provide a suitable way to address these issues. Field surveys and mapping, photo files, and data collection are traditional methods of acquiring cultural heritage data, and these results have become an essential foundation for heritage protection [8]. Novel and advanced technologies, such as digital photogrammetry and spectral imaging, are becoming more widely employed in heritage science and are often used to comprehensively record, understand and protect historical relics and artworks [9]. Some examples of these advances include the use of drones to obtain high-resolution images and using the data for 3D modeling [10]; using 360 degrees panorama technology to obtain panoramic photos [11]; or using terrestrial laser scanners to obtain point clouds. Such observations can be used to generate highly accurate models or drawings [12]. GIS also plays a vital role in protecting and utilizing cultural heritage. Using the Web and mobile GIS support, cultural heritage data, such as text, audio, or video stories, location information, and images, can be obtained through portable devices. GIS has unique advantages for data collection, storage, and manipulation of datasets [13]. By integrating historical building information models and 3D-GIS attribute data, the visibility and interactivity of the information models used in cultural heritage sites can be enhanced [14]. Virtual reality (VR) technology also has exceptional value in tourism marketing and cultural relic protection, involving computer graphic rendering, artificial intelligence, networks, and sensor technology, and can virtually reconstruct and simulate cultural heritage. These are examples of effective "digital protection" of cultural heritage [15] which can also assist in attracting more tourists [16].
In addition to the digitization of heritage resources, the flow of visitors and its associated impact to the environment of heritage sites is also intimately related to heritage protection and tourism development, and this factor may also be assisted by advanced technology. The Internet of Things (IoT) can be used to monitor and manage the tourist flow, for example, beam sensors can be employed to count the number of tourists and use these numbers to improve tourist management [17]. The adoption of video monitoring technology in combination with GIS can be used to analyze and visualize the spatial distribution of pedestrian numbers and flow in different areas, providing a strong foundation for tourist flow management [5]. Ground laser scanning technology, sensor monitoring technology, and digital photography can be used to monitor and manage the local environment [18,19,20], and IoT technology can dynamically evaluate whether environmental conditions are suitable to protect cultural heritage.
Such digital technologies have helped to promote the modernization of heritage tourism. Many studies have considered these issues from discrete and separated aspects such as heritage protection, tourism marketing, and tourism management, but less attention has given to the integration of heritage protection and tourism development. Cultural heritage protection and tourism are interdependent by nature [21], and a holistic approach to cultural heritage protection and tourism management is likely to be more effective for all concerned [22]. This research will explore a sustainable development model of cultural heritage to construct a bridge between cultural heritage protection and tourism development via an integrated platform approach.
Study site
Mount Lushan (29°28'-29° 40' N, 115°50'-116°10' E) is located in Lushan County, Jiujiang City, Jiangxi Province, China. Figure 1 shows the location and main attractions of Mount Lushan. It has a rich cultural and natural heritage and is known for its beautiful and unique scenery. The mountains, rivers, and lakes of Mount Lushan blend into landscape tapestry, and Buddhist, Taoism, Christianity, Catholicism, and Islam coexist here. It is known as a mountain of culture, education, and politics. Historically, it has inspired artists, philosophers, and thinkers and inspired many famous works of art. Thirty churches and schools built in the 1920s remain, and 600 villas are influenced by the architectural styles of 18 countries. It is a site of historical importance to the Chinese Nationalist Party and the Chinese Communist Party, and many major meetings are still held here. It is a world-famous cultural landscape heritage site and one of the spiritual centers of Chinese civilization. Its main area covers 30,200 hectares, and its buffer area is greater than 50,000 hectares. Ontological areas and buffer zones include ancient buildings, ruins, modern villas, stone carvings, alpine plants, waterfalls, and streams. Mount Lushan in its entirety for the conservation of the subtropical forest ecosystem and historical sites [23]. These elements fully demonstrate the cultural and natural elements of the Mount Lushan World Heritage Site. Mount Lushan is listed as one of the top ten most famous mountains in China in 2003 and was rated as a national 5A Tourist attraction (5A is the highest level of China's tourist scenic spots, representing the level of China's world-class quality scenic spots) in 2007. These accolades have stimulated the rapid development of tourism in Mount Lushan, attracting tens of millions of tourists every year.

Geographical location and main attractions of Mount Lushan
However, online and field research on Mount Lushan has revealed significant obstacles to the sustainable development of cultural heritage tourism in this area. On one hand, Mount Lushan promotes and displays the cultural heritage landscape through tourism websites, such as the "China Lushan Network" (http://www.china-lushan.com/). This approach only introduces this heritage site in a two-dimensional way (through pictures and text). Although there is a virtual tour section, tourists can only browse a few scenic spots via panoramic views. The possible immersion and interaction, and thus, the virtual experience, is not adequate or conducive to tourism marketing in the heritage site. On the other hand, the increased influx of tourists has given rise to a series of ecological and environmental problems [23, 24]. There is a lack of equipment to monitor the flow of passengers and environmental quality, and there is little visual management information or monitoring capability of tourist flow and environmental information. The quantity and quality of information available at a heritage site directly affects the time spent by users visiting the website and also affects the satisfaction of users (or tourists) [25, 26].
Technologies and models
In the method of system thinking [27], a cultural heritage tourism system can be divided into cultural heritage tourism resource elements, tourist flow elements, and environmental elements. Here we construct subsystems for each of these elements. Our approach involves the digitization of cultural landscape resources to realize a virtual cultural heritage tourism and marketing system. This subdivision into a virtual tourism subsystem, tourist flow subsystem, and environment subsystem build a complete foundation for cultural heritage protection and tourism development. The technical flow chart of the holistic construction of these three subsystems is shown in Fig. 2.

Technical process of the subsystems in the holistic cultural heritage protection and tourism development
Digitalization technologies
Different digital technologies were adopted for cultural tourism information, such as macro-topographic scenes, ancient buildings, panoramic views which considered the complex landscape composition, diverse tourism elements, and the wide geographical diversity of Mount Lushan. The comprehensive application of multiple digitization technologies avoids the deficiencies associated with a single digitization technology and allows large cultural landscape heritage sites to be comprehensively and systematically digitized.
For the large-scale terrain scene of Mount Lushan, it was necessary to purchase 350 km2 of digital orthophoto map (DOM) data and digital elevation model (DEM) data from the government and use image processing technology to process the original data.
We used an integrated production technology process of 3D models, digital line graphs (DLG), DEM, and digital orthopedic maps (TDOM). The flow chart of this process is shown in Fig. 3. First, aerial photography was used to obtain oblique photography images [28]. The flight route and altitude of unmanned aerial vehicles (UAV) were planned, the aerial photography area was delineated, and then the UAV was equipped with a digital oblique camera, and stereo images were then extracted from the UAV videos for aerial triangulation [29]. Next, 3D models were constructed by creating point clouds, constructing irregular triangulations, and performing texture mapping. The 3D model results were edited to obtain the digital surface model (DSM) results and TDOM results. The DEM results were then obtained by editing the DSM results, and the original DLG data were collected from the 3D models. The DLG data were further supplemented and improved, and were redrawn through field surveys to improve their accuracy. Finally, contour lines and elevation points were generated to supplement the line elements in the DLG supported by the DEM results.

Flow chart of the integrated production technology process
Terrestrial laser scanners allow rapid scans of measured objects. They can directly obtain high-precision scanning point clouds, efficiently carrying out 3D modeling and virtual reproduction of historic buildings [30]; here, we applied this approach to obtain point clouds of historical buildings in Mount Lushan. Using the point cloud data, the Smart3D software was used to perform fine 3D modeling.
360 degrees panorama technology can yield a 360 degrees horizontal viewing angle and a 180 degrees vertical viewing angle, and can integrate 360 degrees panoramas in a virtual environment [11]. We employed this technology, using a digital camera to take initial images, then using Photoshop for image stitching to form spherical and cube panoramas.
This study also used traditional data collection methods such as digital photography, digital video shooting, digital recording, image, and text scanning, and interview records to collect cultural heritage resource information. We additionally employed a mobile collection method, using personal digital assistants (PDAs) to obtain real-time wireless communication with the back-end system through the wireless data transmission network, and sent the collected cultural heritage coordinate data to the back-end system in real-time [31].
Monitoring technologies
We employed IoT technology to monitor and manage the flow of tourists and the environmental conditions in the cultural heritage landscape. Video surveillance technology and electronic ticket checking technology were used to monitor travel traffic, and Internet technology was used to visualize surveillance data. First, cameras were set up at the entrance and exit of the scenic spot and near its main attractions to monitor the flow of tourists. Electronic ticketing technology was used to measure the total number of tourists entering the scenic spot. Then, an established tourist flow subsystem was used to process tourist video data and obtain statistics of the flow of tourists in real-time. In addition, we used wireless sensor technology for environmental monitoring in scenic spots [32]. We installed sensors to measure the levels of harmful oxygen ion concentrations, sulfur dioxide, temperature, and humidity. Finally, we connected the environmental data with the established environment subsystem to display the environmental status of the cultural heritage site in real-time.
Models
To fully exploit the monitoring data, we applied several analytical models to strengthen cultural landscape management. Specifically, we combined a spatial carrying capacity model with the tourist flow monitoring data and the "pressure-state-response" (PSR) model for environmental monitoring of the cultural landscape heritage site.
The spatial carrying capacity model was adopted to represent the tourist carrying capacity of Mount Lushan. The model refers to the number of tourist activities that can be effectively accommodated by tourism resources within a certain period and still maintain the quality of the resource. It can also reflect the capacity of the cultural heritage landscape, which can be measured from the aspects of planar capacity and linear capacity.
The planar calculation method applies to areas with relatively flat terrain and relatively uniform distribution of scenic spots and reception facilities [33], expressed as:
where C1 is the spatial carrying capacity (persons/day, i.e., the number of persons suitable for the scenic spot every day), A is the scenic spot (m2), A0 is the reasonable area occupied per capita (m2), and T is the average daily opening time (hours). Although the scenic spot is open 24 h per day, tourists are mainly visiting during the daytime, so T is set for 8 h in our study. t0 is the average time required for visitors to visit the scenic spot (h).
The linear capacity calculation method is suitable for tourism sites along a path, with the resource space capacity expressed as:
If the path is incomplete and the entrance and exit are in the same position, tourists can only return by retracing their steps on the original path. In this case, the spatial carrying capacity formula becomes:
In Eqs. (2) and (3), C2 and C3 both refer to spatial carrying capacity (persons /d). L is the length of the path (m), L0 is the length of reasonable possession per capita (m), and t1 is the return time along the original route (h). The total number of tourists calculated using the area method and the line method constitutes the resource space capacity of the cultural heritage landscape.
The PSR model was first proposed in 1979 to study environmental problems. It has become a commonly used model to evaluate environmental quality [34]. In the PSR model, "P" refers to the pressure index, which is used to describe the pressure applied to the ecological environment under the influence of human activities. "S" refers to the state index, which is used to describe the status of the ecological environment. "R" refers to the response indicator, which describes the positive management actions taken by human beings towards the ecological environment. The PSR model answers three basic sustainable development questions: what happened, why it happened, and what will happen in the future.
Our study used this comprehensive evaluation index to reflect the ecosystem quality of Mount Lushan. A weighted summation method was used to perform the calculation [35]:
where Z represents the comprehensive evaluation index, Xi is the normalized value of a single index, and Yi is the normalized weight of the evaluation index.
Case study verification
Heritage digitization and visualization
Multiple types of digitization
Digitized results are shown in Fig. 4a–i. For the 350 km2 DOM, image fusion, color uniformity, stitching, and resampling were used to generate DOM data with a resolution of 0.2 m (Fig. 4a shows the spring scene in Guling). Using oblique aerial photography, we made 3D models of White Deer Cave Academy, Donglin Temple, Guling, and Mao Zedong Poetry Garden. The generated large-scale scene 3D model has high accuracy, for example, the accuracy of the 3D model of Donglin Temple is 0.06 m (Fig. 4b). The DLG data collected only has a small margin of error that satisfies the accuracy of a 1/1000 scale map (such as White Deer Cave Academy shown in Fig. 4c).

Digitization results for selected spots in Mount Lushan
Education, politics, architecture, natural scenery, religion, and other elements of typical cultural heritage landscapes were considered when conducting the digital modeling process. This process was based on 3D laser scanning, 3D modeling, 360-degree panoramas, and other technologies. These results are shown in Fig. 4d–f. 3D laser scanner was used to model ancient buildings such as the White Deer Cave Academy, Mao Zedong Poetry Garden, and Xianren Cave and obtain delicate point clouds of the buildings. The point clouds contain important appearance features (as shown in Fig. 4d), such as the characteristic feature lines. The elevation, plan, and cross-sectional views of ancient buildings generated from the point clouds were combined with the collected DLG data to generate a 3D model with fine texture and spatial characteristics (Fig. 4e). These 3D models can provide accurate and detailed information for cultural heritage protection. UAVs and ground collection equipment were used to obtain aerial and ground panoramas of the cultural landscape heritage site in each season, and a total of 304 main scenic spots in Mount Lushan were collected (Fig. 4f).
We collected and digitized materials from Taoist and Buddhist cultures, including ancient poems and paintings, ancient books, ancient cultural relics, historical narratives, and written accounts by using traditional data collection methods. Figure 4g shows a stone carving, which is a poem (its title is "Peach Blossoms in Dalin Temple") written by a famous ancient Chinese poet. Other data on the heritage site (scenic spots, traffic, shopping, accommodations, entertainment, tourist facilities, geological data, vertical zonal soil profiles, plant communities) were collected and digitized using mobile data collection. Figure 4h displays 7,128 geographical names and addresses covering an area of about 350 km2 were collected. Figure 4i shows major geological and geomorphologic features of Xiufeng Mountain.
Virtual tourism of Mount Lushan
From the digitized results, a fundamental geographic information database and a cultural heritage resource database were constructed. The SuperMap software was then used to develop the virtual tourism subsystem. This software can manage a large amount of data, can support directly imported data, has high-quality rendering capabilities, and can optimize the scene. The Lushan virtual tourism subsystem was developed into a display platform integrating sound, text, images, 3D models, maps, and various human–computer interaction technologies.
This subsystem has the following functions of 3D scene browsing:
-
1
Generation of a 3D terrain scene: the high-resolution DEM data of about 350 km2 superimposes with the multi-temporal DOM to generate a 3D terrain scene of Mount Lushan. The "majestic, peculiar and beautiful" natural landscape features of the cultural heritage site can clearly be seen in Fig. 5a.
Fig. 5 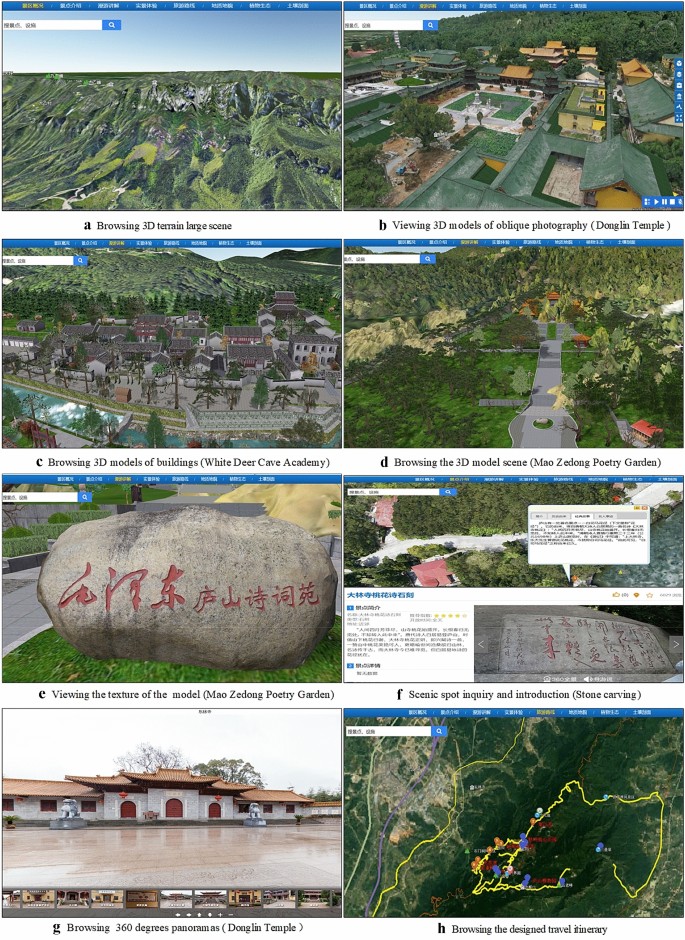
Browsing the virtual scene of the virtual tourism subsystem
-
2
Generation of 3D architectural scenes: the original files of the oblique photography model data included many fragmented files, and the amount of data was enormous. We used SuperMap to process oblique photography models, including generating configuration files, compressing textures, simplifying models and type conversion, meeting the needs of viewing oblique photography models on web pages, and achieving a smooth browsing experience. We located and integrated the processed 3D model of Donglin Temple into the scene (Fig. 5b). For the 3D model generated by laser scanning, we imported the constructed model data into the data engine provided by SuperMap and integrated it into the scene (Fig. 5c).
-
3
Integration of different types of 3D models: the oblique photographic and geometric modeling data were imported into the terrain scene and accurately matched. By controlling the visibility of layers under different viewing angles, seamless switching between terrain scenes and 3D model data was realized. When users viewing the model from a distance, the subsystem can display the DSM; when viewing it at a close distance, the oblique photographic model is displayed on the periphery, and the internal core building is loaded with an intricately detailed 3D model (see Fig. 5d). Users can also continue to zoom in to view the fine texture formed by the laser scan data (Fig. 5e). The subsystem also sets the number of objects and layers in the scene under different viewing angles to reduce the memory and video memory usage of the system to ensure the fluency and stability of the subsystem and speed up the browsing speed of the scene.

Assisted by GIS, the subsystem has the functions of query, recommendation, and popular science. When the user opens the subsystem interface and enters the query keyword through the interactive interface, the result is displayed on the left sidebar and in the 3D scene. The query results will be introduced in pictures and texts (for example, Fig. 5f, which shows a picture of a stone carving, and its poem). Based on the collected geological geomorphology and vegetation ecological data (Fig. 4i), we set up the query and positioning function of geological relics, vegetation, and other attribute information in the subsystem, providing 3D elements, pictures, text, and other display elements, which is helpful to popularize the natural background knowledge of the heritage site to tourists. The subsystem provides an automatic roaming function for famous scenic spots and designed several common roaming routes. When performing automatic roaming, it will be supplemented by voice introduction. A "virtual tour guide" is implemented, and the user can control the broadcast process of the route at any time. Figure 5b shows a roaming scene, and the roaming operation symbol can be seen in the lower right corner. The subsystem can also simultaneously integrate panoramas. By clicking on the panoramic location in the scene, the 360 degrees panoramas of the current position is displayed as a pop-up (see Fig. 5g). Using the scenic spot location data displayed in Fig. 4h, we set up multiple travel planning routes in the subsystem (Fig. 5h). When the user clicks on a specific route, the subsystem will display the route direction and scenic spots on the map to provide convenience for tourists with travel intentions.
The subsystem can provide a unique virtual experience through rich visual content. It can interact with users through query, tourism recommendations, science popularization, and other functions. It can allow to know Mount Lushan in advance, making it an effective marketing tool.
Monitoring and management of tourist flow and environment
When tourists enter a heritage site, they induce environmental pressure. Using our system, tourists can interact virtually before travelling without exerting direct pressure on the cultural heritage site. The virtual tourism subsystem can also help managers improve the protection of the heritage site and carry out tourism marketing. This system can provide better monitoring of tourist flow and the environment of the site, which can greatly assist managers with tourism management and heritage protection. The three subsystems share GIS data to provide a strong data-based foundation for visualization services. These processes are shown schematically in Fig. 6.

Interaction of the three subsystems that improve the management of tourist flow and environmental monitoring of the cultural heritage site
Monitoring and regulation of tourist flow
We used video surveillance technology and electronic ticket checking technology to collect tourist information, built a tourist database, and integrated it with geographic information data (including the location and entrance of the scenic spots and major tour paths). The database is used to record and manage data and to calculate the number of people entering and leaving the scenic spot and the number of people staying in the scenic spot in real-time. We then developed s tourist flow subsystem, which mainly provides services for managers.
Managers can use the subsystem to monitor and manage the tourist flow of the cultural heritage site visually and provide travel services. When visitors buy tickets, their ID number and name will be associated with the identity of the e-ticket. The scope of their travel will be identified in the scenic area. When visitors enter the video surveillance area, face recognition information will be collected by the monitoring equipment, so the general location of the travelers can be identified through the ticket information and video information, and missing tourists can be quickly located to ensure safety.
The determination of tourist capacity thresholds can be vital to the scientific regulation and management of tourist flows within the cultural heritage site. We selected the main scenic spots and routes of Mount Lushan for analysis, and the parameters and results are shown in Tables 1 and 2. The capacity of general scenic spots should be 100–400 square meters per person (based on the "Standards for the Master Planning of Scenic Spots" issued by the Ministry of Housing and Urban–Rural Development of China [36]). Guling is a tourist destination, but it is also a town with permanent residents, so we here assume that its reasonable per capita area is 100 m2/person. For other spots, we assume that the reasonable per capita living area is 400 m2/person. Using these assumptions, the tourist capacity of these scenic spots in Mount Lushan is 46,472 persons/d (Table 1). Since the Guling scenic spot has 21,400 permanent residents, the remaining capacity for visitors is thus 25,072 persons/d. The per capita area of tour routes calculated by the linear capacity calculation method is 5–10 m2/person. We choose a value in the middle of this range, 8 m2/person for our further analyses. The total tourist capacity of the three paths is 4734 persons/d according to this approach (Table 2).
The tourist flow subsystem integrates the number of tourists and GIS data and displays the number of people in each scenic spot by way of map visualization. Similarly, the tourist capacity threshold data of each scenic spot is displayed in the subsystem, and managers can compare the tourist flow real-time data with the tourist capacity threshold data. When the number of tourists in each route and scenic spot exceeds the tourist capacity threshold, the cultural heritage site manager can temporarily restrict ticket sales for overcrowded attractions and guide visitors to other areas. The tourist capacity threshold subsystem thus provides a strong data-based foundation for heritage protection and tourist flow pressure.
Monitoring and evaluation of the environment
We used IoT technology, wireless sensors, and GIS technology to monitor the environment. We first determined the geographic location of the monitoring site and installed the sensor to obtain atmospheric and environmental data through General Packet Radio Service (GPRS) data transmission equipment. Then we established an environmental database to integrate and manage various data resources to develop an environment subsystem that can analyze and express data and realize serving managers.
The subsystem provides a real-time visual management platform for managers that provides a visual map. Managers can use this map to monitor and understand the environment and weather conditions of each scenic spot in real-time to address any possible emergency environmental events in a timely manner.
This tool can also assist with longer-term management. The environmental database stores monthly or longer-period monitoring data and social and economic data. The subsystem can then integrate socio-economic data and annual monitoring data into the PSR model. Table 3 shows the original data of the PSR model, and the analysis results calculated by Eq. (4). As compared with 2017, the comprehensive index of environmental health in 2018 was higher (0.64) because the comprehensive index of response in 2018 was higher than in 2017. However, the pressure index in 2018 was lower than that in 2017. This is attributed to an increase in the number of permanent residents and tourists in 2018, as well as an increase in sulfur dioxide emissions; the combination of both factors has put more pressure on the environment. Future adjustment of the population capacity and better control of the discharge of pollutants could likely improve the comprehensive environmental index.
The analysis results of the PSR model (environmental health index) can be visualized in detail by the environmental subsystem for managers. The comprehensive evaluation results of the environment can play an important role in feedback and early warning. It encourages managers to carry out annual environmental assessments and take corresponding measures, which is conducive to the long-term environmental protection of the heritage site.
Construction of a comprehensive platform
Concept and method of construction
The relationship between heritage and tourism is problematic and intricate, and considering these factors separately is insufficient [37]. Synergies should be developed between tourism and heritage protection [38]. Our integrated system that considered virtual tourism, tourist flow, and environment subsystems is constructed by the integration of different data sources, which have the functions of tourism marketing, digital protection, and information service, and environment management. The interactivity of these different functions improve the overall tourism development and heritage protection. The effective integration of all subsystems allows the construction of a complete platform, detailed in Fig. 7, which displays the path of "data integration-subsystems integration-functions integration-effects integration", thus our system integrates discrete data and subsystems to yield a comprehensive platform for cultural heritage tourism.

Path of the comprehensive platform construction
Products and a new mode
Our first step was to build a comprehensive database. We classified and selected multi-source data, set up a cultural heritage resource database, a GIS database, a tourist and environment database, and a tourism management database to realize the unified storage and management of the data in the cultural heritage tourism comprehensive database. This provided a seamless data interface which includes different types of essential service data for the construction of a comprehensive platform.
The comprehensive platform for Mount Lushan cultural heritage tourism using this complete database is displayed in Fig. 8. It uses multiple display media (e.g., personal computer, smartphones, LED displays), multiple content presentation forms (3D models, maps, charts, text, audio), and multi-subsystem and multi-functional integration forms (virtual tourism subsystem, tourist flow, environment monitoring subsystem, tourist service subsystem, and corresponding functions), providing comprehensive cultural heritage services for tourists and management.

Information of each version
The functions displayed by different media terminals can meet the individual needs of users at different times and places. The Web version is intended for tourists to use before traveling, functioning as a virtual tourism subsystem. It can introduce the cultural heritage site, and can "educate" users to have a more responsible and respectful relationship with the cultural heritage site. It can help to attract potential tourists, as they can “virtually experience” the site before traveling. The LED version of the product is intended for managers, integrating the tourist flow subsystem and the environment subsystem. Managers can monitor tourists and the environment through the LED screen and can visually operate and manage the tourist capacity and environmental health based on the results of the tourist capacity model and PSR model. The smartphone-based application product is intended for tourists during and after travel. It integrates components of the functionality of both the Web-based and LED products to facilitate tourists in obtaining and sharing heritage site information. Tourists can get an overview of the heritage site, navigate the site via the maps and receive tourist recommendation services. They can also find information on the total number of tourists and environmental and weather information of heritage sites. Tourists can then arrange effective plans for their visit based on these functions. It also provides post-tour services such as evaluation of tourist attractions. These functions enrich the experience and satisfaction of tourists.
The comprehensive cultural heritage tourism platform and its corresponding products demonstrate a new paradigm of cultural heritage tourism. Our model can coordinate and integrate multiple key elements to improve the sustainable development of cultural heritage tourism through the combination of in-person and virtual tourism, the combination of service and management to meet the needs of different users, and the combination of heritage protection and tourism.
Results and discussion
The digitization of cultural heritage is becoming more critical, including intangible heritage [39], historical sites [40], archaeological sites [41]. We here developed and described a cultural heritage tourism subsystem, which applies a variety of technologies and methods (such as computer technology, IoT, photogrammetry, geographic information technology, VR technology, and environment assessment methods). We obtained a series of digital results and developed several digital products for tourism marketing and heritage protection.
We also integrated environmental assessment models to provide real-time and long-term assessment and management plans. We accounted for cultural heritage protection, tourism marketing, and management, and the development of cultural heritage tourism digital products. These products show the geographical characteristics of the heritage area, which is conducive to improved heritage protection and the sustainable development of tourism.
The salient point of our research is "integration", which is manifested by integrating multiple subsystems, and connecting themes of different perspectives (including cultural heritage protection, tourism marketing, management, and services) to provide a holistic system. Our important results and finding are now summarized.
(1) Through the use of comprehensive and diverse digital technologies, we obtained a wealth of digital results, including 3D large-scale terrain scenes, 3D cultural relic images, 360-degree panoramas, and pictures. This information was used to create a virtual tourism subsystem to display the regional characteristics of cultural landscape heritage sites through 3D scenes, popular science, and tourism recommendations to improve tourism marketing.
(2) IoT technology was combined with a tourist carrying capacity model and a PSR model to construct tourist flow and environmental subsystems. The tourist flow subsystem allows managers to monitor and manage the tourist flow using capacity models. The environmental subsystem allows the monitoring and management of the environment in real-time and non-real-time using an integrated PSR model.
(3) Finally, a new model of cultural heritage tourism was proposed, and a comprehensive platform for cultural heritage tourism was constructed. We developed products for Web, smartphone, and LED formats, integrating heritage protection and tourism development functions. The platform has rich visual content, including 3D models, maps, charts, and text.
Each subsystem in our comprehensive platform plays a fundamental role. The virtual tourism subsystem can be used before the actual visit to attract more tourists and to provide personalized tourism planning which can improve the virtual experience. Our approach provides a sound foundation, but the continued improvement of this part of the platform is an essential future task [42]. The environmental management subsystem is also an important result of our approach, however, the integrated tourist capacity threshold used here only considered capacities of single scenic spots at a time. Future directions of study could extend the tourist capacity model to multiple entry/exit areas and scenic spots and could set model parameters and thresholds that meet the unique particularity of each scenic spot. Additionally, while our approach demonstrated the effectiveness of many novel elements, the model and parameters employed here were relatively simple and static. In the future, more attention should be paid to the practicality of the model, such as by setting a dynamic tourist capacity threshold, and how this information can be used to implement efficient evacuation plans in case of sudden emergencies. Finally, since the tourist flow subsystem integrates tourist identity information the privacy of users’ needs to be considered in greater detail in the future.
Conclusion
The study has provided a sustainable model of cultural heritage tourism using digital tools. It considered the Lushan cultural landscape heritage site as a case study, and designed a holistic mode of cultural heritage protection and tourism by the comprehensive use of various digital technologies and the development of digital products. We designed and built a digital framework of a large-scale cultural heritage landscape and built a virtual tourism subsystem that integrates 3D model browsing, popular science, and tourism route recommendation functions to meet the needs of tourism marketing.
We proposed and demonstrated a heritage management method that integrates IoT technology with a tourist carrying capacity model and a PSR model to assist in protecting the environment and ensuring the environmental health of the heritage site. The comprehensive cultural heritage tourism platform developed here can provide valuable services for different target audiences (e.g., tourists and managers) through a variety of visualization technologies, and provides a novel demonstration for future development of cultural heritage protection and tourism that can be applied at other heritage sites worldwide.
Availability of data and materials
The dataset supporting the conclusions of this article is included within the article.
Change history
08 November 2021
A Correction to this paper has been published: https://doi.org/10.1186/s40494-021-00613-1
Abbreviations
- VR:
-
Virtual reality
- IoT:
-
Internet of things
- DOM:
-
Digital orthophoto map
- DEM:
-
Digital elevation model
- DLG:
-
Digital line graphic
- TDOM:
-
True digital orthophoto map
- UAV:
-
Unmanned aerial vehicle
- DSM:
-
Digital Surface Model
- PSR:
-
Pressure-state-response
- GPRS:
-
General Packet Radio Service
- LED:
-
Light-emitting diode
References
Bak S, Min C-K, Roh T-S. Impacts of UNESCO-listed tangible and intangible heritages on tourism. J Travel Tour Mark. 2019;36(8):917–27. https://doi.org/10.1080/10548408.2019.1658034.
Timothy DJ. Contemporary cultural heritage and tourism: development issues and emerging trends. Public Archaeology. 2014;13(1–3):30–47. https://doi.org/10.1179/1465518714z.00000000052.
Zhang C, Fyall A, Zheng Y. Heritage and tourism conflict within world heritage sites in China: a longitudinal study. Curr Issue Tour. 2015;18(2):110–36. https://doi.org/10.1080/13683500.2014.912204.
Ryu H-C. Cultural Heritage Management System and Improvement of the Limits - focused on establishing the tangible cultural heritage on-site management organization. 2013;54:183–214.
Zubiaga M, Izkara JL, Gandini A, et al. Towards smarter management of overtourism in historic centres through visitor-flow monitoring. Sustainability. 2019;11(24):7254. https://doi.org/10.3390/su11247254.
Law R, Qi SS, Buhalis D. Progress in tourism management: A review of website evaluation in tourism research. Tour Manage. 2010;31(3):297–313. https://doi.org/10.1016/j.tourman.2009.11.007.
Li J, Whitlow M, Bitsura-Meszaros K, et al. A preliminary evaluation of World Heritage tourism promotion: comparing websites from Australia, China, and Mexico. Tourism PlanDevelop . 2016;13(3):370–6. https://doi.org/10.1080/21568316.2015.1101393.
Shah K. Creation of cultural heritage inventories: case of the historic city of Ahmadabad. J Cult Heritage Manag Sustain Develop. 2016;6(2):166–94. https://doi.org/10.1108/jchmsd-02-2016-0011.
Adamopoulos E, Bovero A, Rinaudo F. Image-based metric heritage modeling in the near-infrared spectrum. Heritage Sci. 2020;8(1):53. https://doi.org/10.1186/s40494-020-00397-w.
Dasari S, Mesapam S, Kumarapu K, et al. UAV in Development of 3D Heritage Monument Model: A Case Study of Kota Gullu, Warangal, India. J Indian Soc Remote Sensing. 2021. https://doi.org/10.1007/s12524-020-01250-0.
Walmsley AP, Kersten TP. The imperial cathedral in Konigslutter (Germany) as an immersive experience in virtual reality with integrated 360 degrees panoramic photography. Appl Sci Basel. 2020;10(4):1517. https://doi.org/10.3390/app10041517.
Davis A, Belton D, Helmholz P, et al. Pilbara rock art: laser scanning, photogrammetry and 3D photographic reconstruction as heritage management tools. Heritage Sci. 2017;5:25. https://doi.org/10.1186/s40494-017-0140-7.
Hadjimitsis D, Agapiou A, Alexakis D, et al. Exploring natural and anthropogenic risk for cultural heritage in Cyprus using remote sensing and GIS. Int J Digital Earth. 2013;6(2):115–42. https://doi.org/10.1080/17538947.2011.602119.
Ma Y-P. Extending 3D-GIS district models and BIM-based building models into computer gaming environment for better workflow of cultural heritage conservation. Appl Sci Basel. 2021;11(5):2101. https://doi.org/10.3390/app11052101.
Zhong H, Wang L, Zhang H. The application of virtual reality technology in the digital preservation of cultural heritage. Comput Sci Inf Syst. 2021;18(2):535–51. https://doi.org/10.2298/csis200208009z.
Frey BS, Briviba A. A policy proposal to deal with excessive cultural tourism. Eur Plan Stud. 2021;29(4):601–18. https://doi.org/10.1080/09654313.2021.1903841.
Jones, T.E., Y. Yang, and K. Yamamoto, Comparing Automated and Manual Visitor Monitoring Methods: Integrating Parallel Datasets on Mount Fuji's North Face. Journal of Park and Recreation Administration, 2018. 36(1): p. 22–38. https://doi.org/10.18666/jpra-2018-v36-i1-7976.
Campiani A, Lingle A, Lercari N. Spatial analysis and heritage conservation: Leveraging 3-D data and GIS for monitoring earthen architecture. J Cult Herit. 2019;39:166–76. https://doi.org/10.1016/j.culher.2019.02.011.
Constantinidis D. GIS for managing the analysis and protection of archaeological remains in the Willandra Lakes World Heritage Area. Archaeol Ocean. 2009;44(2):112–8. https://doi.org/10.1002/j.1834-4453.2009.tb00054.x.
Lombardo L, Parvis M, Corbellini S, et al. Environmental monitoring in the cultural heritage field. Eur Phy J Plus. 2019;134(8):411. https://doi.org/10.1140/epjp/i2019-12800-2.
Lai LWC. Sustainable development of heritage conservation and tourism: A Hong Kong case study on colonial heritage. Sustain Dev. 2020;28(5):1181–8. https://doi.org/10.1002/sd.2067.
Iliopoulou-Georgudaki J, Theodoropoulos C, Konstantinopoulos P, et al. Sustainable tourism development including the enhancement of cultural heritage in the city of Nafpaktos - Western Greece. Int J Sust Dev World. 2017;24(3):224–35. https://doi.org/10.1080/13504509.2016.1201021.
Hui W, Ceming T, Wen X, et al. Vascular plants in the tourist area of Lushan National Nature Reserve, China: status, threats and conservation. Eco Mont J Protected Mountain Areas Res. 2020;12(1):60–3. https://doi.org/10.1553/eco.mont-12-1s60.
Xie DM, Huang QH, Xu S, et al. Assessment of surface water quality in Lushan: a world heritage sites in China. Environ Sci Pollut Res. 2020;27(15):18934–48. https://doi.org/10.1007/s11356-020-08304-3.
Yassierli V, MSS Mohamed. The Importance of Usability Aspect in M-Commerce Application for Satisfaction and Continuance Intention. Makara J Technol. 2018. 22(3): 149–158. Doi: https://doi.org/10.7454/mst.v22i3.3655.
Bastida U, Huan TC. Performance evaluation of tourism websites’ information quality of four global destination brands: Beijing, Hong Kong, Shanghai, and Taipei. J Bus Res. 2014;67(2):167–70. https://doi.org/10.1016/j.jbusres.2012.10.008.
Roxas FMY, Rivera JPR, Gutierrez ELM. Framework for creating sustainable tourism using systems thinking. Curr Issue Tour. 2020;23(3):280–96. https://doi.org/10.1080/13683500.2018.1534805.
Wang JJ, Zhu S, Luo XG, et al. Refined micro-scale geological disaster susceptibility evaluation based on UAV tilt photography data and weighted certainty factor method in Qingchuan County. Ecotoxicol Environ Saf. 2020;189: 110221. https://doi.org/10.1016/j.ecoenv.2019.110005.
He H, Chen T, Zeng H, et al. Ground control point-free unmanned aerial vehicle-based photogrammetry for volume estimation of stockpiles carried on barges. Sensors. 2019;19(16):3534. https://doi.org/10.3390/s19163534.
Pavlidis G, Koutsoudis A, Arnaoutoglou F, et al. Methods for 3D digitization of cultural heritage. J Cult Herit. 2007;8(1):93–8. https://doi.org/10.1016/j.culher.2006.10.007.
Zhou Y, Lobo NF, Wolkon A, et al. PGMS: a case study of collecting PDA-based geo-tagged malaria-related survey data. Am J Trop Med Hyg. 2014;91(3):496–508. https://doi.org/10.4269/ajtmh.13-0652.
Agbota H, Mitchell JE, Odlyha M, et al. Remote assessment of cultural heritage environments with wireless sensor array networks. Sensors. 2014;14(5):8779–93. https://doi.org/10.3390/s140508779.
Zhao GL, Deng ZJ, Shen J, et al. Carrying capacity and its implications in a Chinese ancient village: the case of Hongcun. Asia Pacific J Tour Res. 2018;23(3):260–80. https://doi.org/10.1080/10941665.2017.1421566.
Rapport DJ, Singh A. An ecohealth-based framework for state of environment reporting. Ecol Ind. 2006;6(2):409–28. https://doi.org/10.1016/j.ecolind.2005.05.003.
Zhang J, Zhang Y. Assessing the low-carbon tourism in the tourism-based urban destinations. J Clean Prod. 2020;276: 124303. https://doi.org/10.1016/j.jclepro.2020.124303.
Standards for the Master Planning of Scenic Spots. 2019. http://www.mohurd.gov.cn/wjfb/201903/t20190320_239842.html. Accessed 1 MAR 2021.
Chang-Vargas GV. Between discourse and practice: heritage and cultural tourism in the ICOMOS charter. Pasos-Revista De Turismo Y Patrimonio Cult. 2019;17(2):389–408. https://doi.org/10.25145/j.pasos.2019.17.027.
PargaDans E, P Alonso Gonzalez, R OteroEnriquez. The social value of heritage: Balancing the promotion-preservation relationship in the Altamira World Heritage Site, Spain. Journal of Destination Marketing & Management. 2020. Doi: https://doi.org/10.1016/j.jdmm.2020.100499.
Deng X, Kim IT, Shen C. Research on Convolutional Neural Network-Based Virtual Reality Platform Framework for the Intangible Cultural Heritage Conservation of China Hainan Li Nationality: Boat-Shaped House as an Example. Math Probl Eng. 2021;2021:5538434. https://doi.org/10.1155/2021/5538434.
di Filippo A, L Javier Sanchez-Aparicio, S Barba et al. Use of a Wearable Mobile Laser System in Seamless Indoor 3D Mapping of a Complex Historical Site. Remote Sensing. 2018. 10(12): 1897. https://doi.org/10.3390/rs10121897.
Tanasi D, Hassam S, Kingsland K, et al. Melite Civitas Romana in 3D: Virtualization Project of the Archaeological Park and Museum of the Domus Romana of Rabat. Malta Open Archaeology. 2021;7(1):51–83. https://doi.org/10.1515/opar-2020-0126.
Broderick M, Cypher M, Macbeth J. critical masses: augmented virtual experiences and the Xenoplastic at Australia’s cold war and nuclear heritage sites. Archaeol J World Archaeol Congress. 2009;5(2):323–43. https://doi.org/10.1007/s11759-009-9110-3.
Acknowledgements
Thanks to Xiao Xin and Adam Thomas Devlin of Jiangxi Normal University for their technical and linguistic help.
Funding
This work was supported by the National Key Technologies R&D Program of China under Grant 2015BAH50F03; Major project of Art Science of the National Social Science Foundation of China under Grant 19ZD27; Cultural Arts and Tourism Research Project under Grant xxhfzzx201907; Strategic Priority Research Program of the Chinese Academy of Sciences under Grant No. XDA19030502.
Author information
Authors and Affiliations
Contributions
ZC, CF: Wrote this article; QZ, FC: Reviewed the whole paper and put forward suggestions for improvement. All authors read and approved the final manuscript.
Corresponding author
Ethics declarations
Competing interests
The authors declare that they have no competing interests.
Additional information
Publisher's Note
Springer Nature remains neutral with regard to jurisdictional claims in published maps and institutional affiliations.
The original version of this article was revised: the author names were transposed and a funding note was added.
Rights and permissions
Open Access This article is licensed under a Creative Commons Attribution 4.0 International License, which permits use, sharing, adaptation, distribution and reproduction in any medium or format, as long as you give appropriate credit to the original author(s) and the source, provide a link to the Creative Commons licence, and indicate if changes were made. The images or other third party material in this article are included in the article's Creative Commons licence, unless indicated otherwise in a credit line to the material. If material is not included in the article's Creative Commons licence and your intended use is not permitted by statutory regulation or exceeds the permitted use, you will need to obtain permission directly from the copyright holder. To view a copy of this licence, visit http://creativecommons.org/licenses/by/4.0/. The Creative Commons Public Domain Dedication waiver (http://creativecommons.org/publicdomain/zero/1.0/) applies to the data made available in this article, unless otherwise stated in a credit line to the data.
About this article

Cite this article
Cai, Z., Fang, C., Zhang, Q. et al. Joint development of cultural heritage protection and tourism: the case of Mount Lushan cultural landscape heritage site. Herit Sci 9, 86 (2021). https://doi.org/10.1186/s40494-021-00558-5
Received:
Accepted:
Published:
DOI: https://doi.org/10.1186/s40494-021-00558-5