
Abstract
Background
In the last decade, thousands of satellite-relayed data loggers (SRDLs) have been deployed, providing large datasets on marine predator movement patterns at sea and their diving behaviour. However, the latter is in a highly summarised, low-resolution form, from which it is difficult to make the sorts of important behavioural inferences that are possible from higher-resolution datasets (such as detection of likely foraging events). The main objective of this study was to develop a simple, but accurate tool to detect and quantify within-dive foraging periods in low-resolution dives.
Method
Two southern elephant seals were fitted with a head-mounted time depth recorder (TDR) (recording depth at 1 Hz) and an accelerometer (recording 3 axes of acceleration at 16 Hz) from which prey capture attempts were estimated (PrCA), and a Weddell seal was also fitted with a TDR (1 Hz).The resulting high-resolution dive profiles were used to: (1) calculate an accurate index of foraging effort based on the detection of vertical sinuosity switches (i.e. huntinghighres time); (2) produce an SRDL-equivalent low-resolution dataset using a broken stick algorithm; and (3) from each low-resolution dive calculate a set of candidate foraging effort indices.
Results
Huntinglowres time, which is the total time spent in decreased vertical velocity segments of the dive, was the foraging effort index that best correlated with huntinghighres time. Huntinghighres mode of SES dives (highly sinuous parts of high-resolution dives) was associated with 77 % of total PrCA. In comparison, Huntinglowres segments of SES dives were associated with 68 % of PrCA as well as with four times more PrCA than transitlowres segments.
Conclusion
We found a low-resolution index which indicates foraging activity within a highly summarised dive profile and which identified most PrCA, despite degraded information transmitted by SLDRs. Used in combination with other measurements of the in situ environment, the huntinglowres index could be used in numerous integrated marine ecology studies, such as habitat use studies that are crucial to facilitate more effective conservation.
Background
In natural systems, predators perceive and react to environmental heterogeneity in ways that maximise resource acquisition [1, 2]. These reactions are manifested through changes in their movement characteristics (e.g. direction, speed, sinuosity) that are likely to reflect the presence, or availability, of prey in the three dimensions of the environment [3, 4]. Determining important habitats and quantifying how physical and biological parameters may influence top predators’ behaviour is critical to understanding how a changing environment may influence individuals and populations [5, 6]. For many marine predators, prey capture occurs at depth, and deciphering their diving behaviour to understand their foraging strategies has been a challenging issue since the late 1960s [7].
Bio-logging devices have been fundamental in understanding the behaviour of an increasing number of marine species, because they allow remote measurements of movements and diving behaviour of free-ranging species [5]. During the last decade, satellite-relayed data loggers (SRDLs) have been widely used for transmitting, in near real time, data on the behaviour of marine predators, most typically dive depth and duration, but also in some cases swimming speed or ocean data such as temperature and salinity [6, 8]. The miniaturisation, extended battery life and memory capacity of these devices allow the collection and storage of data at very high resolutions (1 s or less) and for long periods of time (several months) [5, 8, 9]. However, the limited time and bandwidth available for data transmission at the surface imposed by both the animal’s diving habits and CLS Argos restrict the amount of data that can be sent [6, 10]. For example, an SRDLs dive profile that was collected and recorded at 1 Hz might be summarised before transmission to only six points, representing the main inflexion points of the full profile, providing less detailed information on the actual dive profile [11]. Alternatively, several hours of diving behaviour data can be summarised into bins of summarised information on depth, duration or time submerged.
Accurate enumeration of feeding events is often difficult to obtain for marine predators and so most studies rely on proxies such as maximum dive depth, dive duration, bottom time, descent/ascent rates and dive shape indices [12–14]. For many marine predators, foraging and prey acquisition are assumed to occur during the bottom phase of the dive, with predators maximising their time at depth (i.e. bottom time) and minimising transit time (i.e. descent and ascent phases) [15, 16]. For several species, the duration of the bottom phase has been positively related to foraging activity [17–19]. However, Dragon et al. [14] and Thums et al. [20] demonstrated that deep foraging dives in southern elephant seals (SES) were associated with high descent/ascent rates, but relatively short bottom times. Moreover, a recent study on a Weddell seal and SES demonstrated that the three-phase model of diving behaviour (descent, bottom and ascent) is overly simplistic and that using the bottom time only as an index of foraging effort can be misleading and inaccurate, because: (1) intensification of the foraging effort could occur several times within a dive and (2) this may not occur necessarily during the bottom phase [21].
We studied two deep-diving species of circum-Antarctic seals, SES and Weddell seals, for which numerous large low-resolution datasets (collected and transmitted by SRDLs) are available. Southern elephant seals are capable of travelling long distances from their sub-Antarctic breeding colonies and using diverse habitats such as ice edges, continental shelves and oceanic eddies [22, 23], feeding mainly on fish and squid [24–26] and, as recently discovered, on krill [27]. Their diving behaviour is relatively stereotyped and they mostly forage at the bottom of their dives [9, 21]. In contrast, Weddell seals mainly reside in coastal or shelf waters in areas of fast ice. They feed mainly on fish, but also on cephalopods and crustaceans in variable proportions according to age, location and season [28]. Their diving behaviour seems to reflect this generalist feeding strategy even at the dive scale, exhibiting several foraging episodes within a dive, which are most often above the bottom phase of the dive [21]. Southern elephant seal and Weddell seal foraging behaviour has been extensively studied in several locations [29–32]; however, the new information on fine-scale behaviour by Dragon et al. [14] and Heerah et al. [21], in addition to the increasingly large number of low-resolution data available, highlights the value of re-visiting the common approach of identifying foraging activity within low-resolution dives.
We used high-resolution time depth recorder (TDR) and acceleration datasets from two SES that visited the peri-Antarctic margin during their post-breeding foraging trip, and a high-resolution TDR dataset from a Weddell seal during six winter months. These high-resolution dive data were degraded into equivalent SRDL low-resolution dives to find the most appropriate method and index to: (1) detect and quantify within-dive foraging periods in low-resolution dives when no concurrent information on prey encounters are available; and (2) use concurrent prey capture attempts (PrCA) estimated for the SES from high-resolution acceleration data to independently validate the most promising low-resolution index.
Methods
Two adult female SES (length: 266 and 255 cm) were captured at Kerguelen Island (49°20′ S, 70°20′ E) in early November 2010 before their post-breeding foraging trip. One adult female Weddell seal was captured in February 2008 after its annual moult at Dumont D’Urville (66°40′ S, 140°00 E) (length 230 cm). Similar capture and tagging procedures were used for both species and are fully described in [21]. A TDR combined with an accelerometer (TDR Mk 10 X, Wildlife Computers) and a TDR (Mk 10, Wildlife Computers) was head-glued to the SES and to the back of the Weddell seal, respectively. The TDRs all recorded depth at 1 Hz. For the SES, acceleration was recorded in all three axes at 16 Hz.
The number of prey capture attempts (PrCA) was calculated for each dive from the concurrent high-resolution acceleration data [33, 34]. A full description of the acceleration data filtration process and definition of PrCA occurrence are given in [9].
Fine-scale analysis of foraging behaviour
The high-resolution dive data were processed with a new approach which accurately identifies the parts within a dive where a diving predator displays foraging behaviour based on the vertical sinuosity in the dive profile [21]. Only dives below 20 m were analysed for both species. The method is fully described in [21] and briefly summarised below. Each dive was summarised by an optimised broken stick algorithm which (1) iteratively selected a series of inflexion points for individual dives, and multiple summaries were made for each dive based on a varying number of inflexions; (2) from this suite of summaries, the number of broken stick points (inflexions) that best summarised the dive shape was selected; (3) subsequently, the complete set of dives independently of their depth, duration and complexity was described; and (4) for each dive part (i.e. between two inflexion points) an index of vertical sinuosity as the ratio between the vertical distance swum in a linear path (i.e. depth difference between two considered inflexion points) and the sum of all the vertical distances the seal has actually swum in that dive part was calculated. Vertical sinuosity ratio (hereafter sinuosity) takes a value of 1 when the individual swims in a straight path during this part of the dive. Any deviation from a straight path decreases the sinuosity ratio towards 0. By expanding the definition of an area restricted search (ARS) from the horizontal dimension into the vertical dimension, the approach detects two types of behaviour according to their sinuosity, with: (1) highly sinuous segments indicating “hunting” (0 < vertical sinuosity > 0.9) and (2) less sinuous segments indicating “transiting” (0.9 ≤ vertical sinuosity ≥ 1). The time spent in the hunting mode within a dive was summed for each dive and used as an index of the foraging effort (hereafter, “huntinghighres time”). Dives with more than 1500 s spent in huntinghighres time were scarce and therefore not considered in further analysis (9 and 10 dives for the SES and the Weddell seal, respectively).
As described in [21], dives of the Weddell seal dataset containing segments associated with abnormally high vertical ascent/descent rates were removed (23 dives in the Weddell seal dataset).
From high-resolution to low-resolution dive datasets
Simulation of a low-resolution dive dataset and calculation of foraging effort indices
To quantify the foraging effort in low-resolution dives, it was necessary to find an index similar to the huntinghighres time. First, we used the high-resolution dives to generate the equivalent low-resolution profiles provided by CTD-SRDLs (conductivity temperature depth-satellite relayed data loggers) using a broken stick algorithm [11]. The SRDL datasets were created by selecting six data points for each high-resolution dive: the two surface points marking the beginning and end of each dive, the maximum depth point and the three other most informative inflexion points. This is the same method used to summarise dive data transmitted by SRDLs [11].
Then for each dive, we calculated five different indices that could be potentially used to infer foraging effort:
-
1.
The time spent at more than 80 and 60 % of the maximum dive depth (hereafter, bt80 and bt60). Foraging is often assumed to occur during the bottom phase of a dive with bt80 being used as an index of foraging effort for low-resolution dives [31, 35–38]. However, foraging activity also occurs above the bottom phase [9, 14, 18, 21]. We therefore calculated the bt60 to encompass a broader range of within-dive activity.
-
2.
The rate of change (m s−1) between the surface and the first or last inflexion point (i.e. descent or ascent rate). The broken stick algorithm detects the most informative changes in a dive profile; therefore, the first and last segments of the dive are the most likely to reflect the dive descent and ascent phases.
We tested descent and ascent rates as possible candidates of foraging effort indices as they can reflect prey patches that a seal would want to reach and return to faster [15, 20, 39], but also impact the time allocated to foraging activity due to its energetic costs [16, 39, 40].
-
3.
Time allocation at depth index (TAD) [11]. The index takes values close to 1 when the area enclosed by the dive profile is maximal (i.e. “square-shaped dive”) towards values close to 0.5 when the dive area is minimum (i.e. “V-shaped dive”) given a set speed. The V-shaped dive represents dives where equal time is spent at all the depths encountered; conversely the square-shaped dive represents dives where a seal maximises its time at depth. TAD values close to 1 indicate that a seal has spent more time at a given depth reflecting potential foraging activity.
-
4.
Hunting time calculated using low-resolution dive data (i.e. huntinglowres time). A recent study has shown that hunting mode in high-resolution dives (calculated using vertical sinuosity, see “Fine scale analysis of foraging behaviour” and [21], Fig. 1a, c) was associated both with more PrCA and decreased vertical velocities (SES: 0.3 ± 0.001 m s−1, Weddell seal: 0.13 ± 0.13 m s−1; [21]). However, vertical sinuosity cannot be calculated for low-resolution dives. Instead, for each low-resolution dive broken stick segment, we calculated the concurrent vertical rate of change assuming that decreased vertical rates would be indicative of foraging (m s−1, Figs. 1b, d, 2). According to this, the first mode of the distribution of vertical velocity in low-resolution dives was used to define a set of thresholds to identify foraging behaviour (Fig. 2). Thresholds from 0.1 to 0.7 m s−1 and from 0.1 to 0.9 m s−1 were tested for the Weddell seal and the SES, respectively. These different thresholds were used to discriminate between “low-speed” (hereafter “huntinglowres”) segments vs “high-speed” (hereafter “transitlowres”) segments in low-resolution dive data. Then, for each dive and threshold, we calculated the total time spent in “huntinglowres” segments (i.e. within-dive hunting time calculated using low-resolution dive data—hereafter “huntinglowres time”) and compared it to the corresponding “huntinghighres time” (Table 1). For both species, hunting time indices correlated best and did not vary much for threshold values between 0.3 m s−1 and 0.6 m s−1 (Table 1). The 0.4 m s−1 threshold was the most parsimonious across both species and SES individuals. Therefore, we used this threshold to calculate the “huntinglowres time” in further analysis (Fig. 1c, d).
Fig. 1 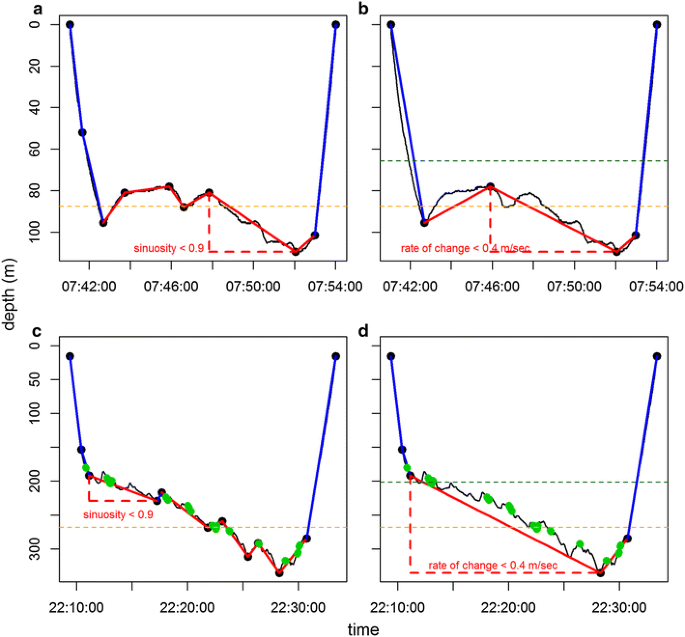
From high resolution to low resolution: concordance of within-dive parts of intensified foraging effort. High-resolution dive profile (black line) were summarised by the optimal broken stick method (a Weddell seal, c SES) and degraded in SRDLs low-resolution dives (b Weddell seal, d SES). Red lines represent “huntinghighres” (highly sinuous parts of high-resolution dives) and “huntinglowres” (segments associated with vertical velocity ≤0.4 m s−1 of low-resolution dive) mode broken stick segments for high and low resolution, respectively. Conversely, blue lines represent “transithighres” (straighter parts of high-resolution dives) and “transitlowres” (segments associated with vertical velocity >0.4 m s−1 of low-resolution dive) mode broken stick segments for high and low resolution, respectively. Dotted lines represent the 80 (orange) and 60 % (green) of maximal dive depth. The green dots indicate prey capture attempts for the SES dataset (estimated from high-resolution acceleration data)
Fig. 2 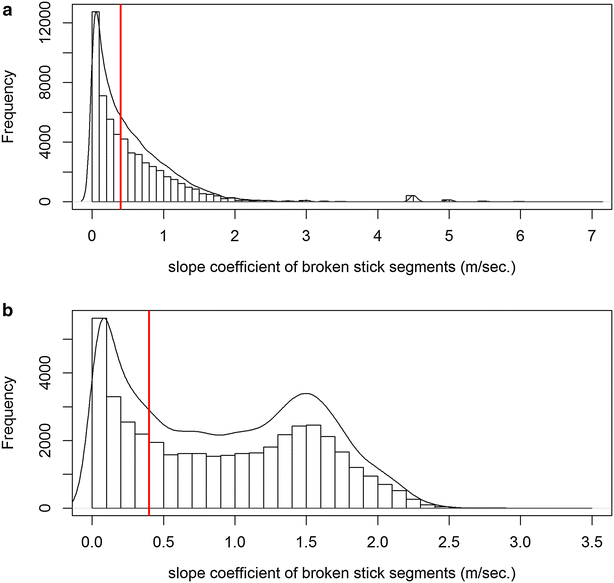
Distribution of the vertical velocity in low-resolution dives. Distribution of the vertical velocity (histogram and density plot [black line]) associated with each broken stick in low-resolution dives for the Weddell seal (a) and the SES (b). The threshold of 0.4 m s−1 was used for both species to discriminate “low speed” (i.e. “huntinglowres”) segments versus “high speed” (i.e. “transitlowres”) segments in low-resolution dive data. The total time spent in “huntinglowres” segments for each dive was used as an index of foraging effort (i.e. “huntinglowres time”)
Table 1 Correlations between hunting times of high- and low-resolution dives according to different vertical velocity threshold values


Statistical analysis
The relationship between the five low-resolution foraging indices and the huntinghighres time was analysed using Spearman correlations (function cor; R development core team, 2008) and this indicated that huntinglowres time was best correlated with the huntinghighres time (R 2 SES = 0.61, R 2 Weddell seal = 0.94, see Additional file 1). We therefore fitted linear models to investigate the relationship between the huntinghighres time and the huntinglowres time (function lm; [41]) for both species. The residuals of this preliminary fit showed that 141 SES dives were not well explained by the model and weakened the relationship (see Additional file 2). They were associated with an overestimation of the hunting time when using the low-resolution index (dives associated with residuals ≤−400). The latter is likely to be related to the occurrence of rare “drift” dives that would be associated with “low-speed” segments in low-resolution dives, but not with an increased vertical sinuosity in high-resolution dives. In agreement with our assumption, these dives were also associated with lower than average PrCA (3 ± 6 PrCA instead of 9 ± 0.05 PrCA). These dives were excluded from the dataset before repeating the analysis described above.
Results
General diving behaviour
The TDRs recorded the diving behaviour of two SES for 72 and 73 days from November to January 2011 (see Table 1 in [21]). The seals performed 3941 and 4254 dives with on average (mean ± SD) 53 ± 1 and 56 ± 1 dives per day, respectively (see Table 1 in [21]). The mean maximum dive depths were 511 ± 4 m and 475 ± 4 m with in average dive durations of 23 ± 0.01 min and 21 ± 0.1 min, and dives were associated with 8 ± 0.06 PrCA (max: 39 PrCA) and 10 ± 0.05 PrCA (max: 40 prCA), respectively (see Table 1 in [21]). The diving behaviour of the Weddell seal was recorded for 182 days from February to August 2008 (see Table 1 in [21]). The seal performed 11452 dives with on average 63 ± 24 dives per day (see Table 1 in [21]). The mean maximum dive depth was 67 ± 54 m with average dive durations of 10 ± 6 min (see Table 1 in [21]).
From high-resolution to low-resolution dives: estimation of foraging effort
Comparison between foraging effort metrics
Of all the low-resolution dive foraging effort indices, the huntinglowres time (see “Simulation of a low-resolution dive dataset and calculation of foraging effort indices”) was best correlated with the huntinghighres time for both species (R 2 SES = 0.67 and R 2 Weddell seal = 0.94, Table 2). Two dives for each species are presented as an example of the concordance between the parts of the dive where foraging occurred for high- and low-resolution dives, respectively (Fig. 1).
For the SES, the second best correlated index with huntinghighres time was bt60 (R 2 = 0.4) followed by bt80 (R 2 = 0.3, Table 2). The ascent rate correlated least with huntinghighres time (R 2 = 0.001, Table 2). For the Weddell seal, the second best correlated index with huntinghighres time was bt60 (R 2 = 0.7) followed by bt80 (R 2 = 0.5, Table 2). The TAD index correlated least with huntinghighres time (R 2 = 0.03, Table 2).
Relationship between low- and high-resolution dive index of foraging effort
Linear models were fit to huntinghighres time and huntinglowres time for each seal (Fig. 3). The fit of the model for the Weddell seal was good (Fig. 3 and see distribution of the residuals Additional file 3). For the SESs, removing the 141 likely drift dives (see “Statistical analysis”, Additional file 2) improved the fit of the model (see distribution of the residuals Additional files 2b [before], 3b [after]) and the strength of the relationship between the variables (Additional file 2 [before], Fig. 3b [after]). The relationship between huntinghighres time and huntinglowres time was positively significant (p value <0.001) for both species, but stronger for the Weddell seal (R 2 SES = 0.67 and R 2 Weddell seal = 0.94, Fig. 3; Table 2).

Relationship between high-resolution and low-resolution foraging effort metric. Results of linear models fitted to investigate the relationship between the huntinghighres time (time spent in highly sinuous parts of high-resolution dives) and the huntinglowres time (time spent in segments associated with vertical velocity ≤0.4 m s−1 of low-resolution dive) for the Weddell seal (a) and the SES (b). The regression line of the model is represented in red. Grey points in figure b indicate the 141 likely drift dives associated with outlier residuals that were removed for the SES dataset (see “Statistical analysis”, Additional file 1)
High-resolution dives were summarised by more segments than low-resolution ones. Consequently, high-resolution dives are characterised by more segments of each behavioural mode that are shorter in duration than low-resolution segments (Additional file 4). For both resolutions, the average depths of hunting and transit segments are similar showing the concordance in behavioural mode detection with the two methods (Additional file 4; Fig. 1). On average, huntinghighres time (see “Fine scale analysis of foraging behaviour”) was 9 ± 0.05 min and 6.5 ± 0.05 min per dive representing 42 ± 0.2 % and 59 ± 0.3 % of the corresponding dive duration, for SES and the Weddell seal, respectively (see [21]). On average, huntinglowres time was 9 ± 0.06 and 7 ± 0.05 min per dive, representing 44 ± 0.3 % and 70 ± 0.3 % of the corresponding dive duration, for SES and the Weddell seal, respectively. Southern elephant seals spent 41 and 42 % of their total dive duration foraging when considering huntinghighres and huntinglowres time, respectively. The Weddell seal spent 67 and 77 % of their total dive duration foraging when considering huntinghighres and huntinglowres time, respectively.
Foraging effort and prey capture attempts in SES
In SES dives, prey capture attempt rates were three times higher in hunting segments than transit ones for both resolution datasets (Table 3). In addition, hunting segments were associated with four times more PrCA than transit ones with 77 and 68 % of total PrCA occurring during huntinghighres and huntinglowres segments, respectively (Table 3; Fig. 1c, d).
Discussion
We present a new method for identifying areas of hunting activity within low-resolution dive data, which can be used at the scale of individual dives. Our results show that (1) of five potential indices, the huntinglowres time was the most correlated of the indices to the huntinghighres time, (2) times allocated to foraging at the dive or trip scale were quite similar when estimated by huntinghighres and huntinglowres time, (3) 77 % of total PrCA occurred in huntinghighres mode segments of high-resolution dives and despite dive information being much more degraded in low-resolution dives, 68 % of total PrCA occurred in the huntinglowres segments which were also associated with four times more PrCA than transitlowres segments. Importantly, the concurrent prey capture attempts (PrCA) estimated from high-resolution acceleration data for SES supported the low-resolution foraging effort index identified with our method.
Unlike studies that only consider foraging behaviour within the bottom phase of a dive [14, 35, 36], the “hunting time” method [21] considers potential foraging activity within the whole dive. We show that the same method can be adapted to low-resolution dive data from SRDLs and still detects foraging within a dive and most of the associated PrCA, despite being highly degraded information.
Foraging effort in low-resolution dives
Huntinglowres time
Of all the low-resolution foraging effort indices tested, the huntinglowres time was the best correlated to the huntinghighres time. The good correlation between huntinghighres and huntinglowres time and the similarities in average hunting times at the dive and trip scales indicate that in most cases low-resolution dive segments of decreased vertical velocity (i.e. “huntinglowres mode”) are also associated with increased vertical sinuosity (i.e. wiggles).
However, the correlation between huntinghighres and huntinglowres time was overall lower for SES than the Weddell seal, and for both species some dives were not well correlated. This may be due to several reasons. Firstly, high-resolution dives are summarised by more numerous (on average, 12 segments; see [21], Additional file 4), shorter broken sticks segments which allow for the detection of behavioural changes at a finer scale and more accurately than in low-resolution dives that are summarised by five segments only. This is highlighted, for example, by the higher PrCA rate and percentage of total PrCA associated with huntinghighres segments compared to huntinglowres segments (Table 3). Moreover, SESs perform, on average, longer and deeper dives than Weddell seals, which means that more information is lost when going from high- to low-resolution data. Secondly, the estimation of foraging effort in high-resolution dives relies on the calculation of vertical sinuosity which is not accessible in low-resolution dives. Therefore, in the case where sinuous parts of high-resolution dives are also associated with a decrease in vertical rates, the concordance between huntinglowres and huntinghighres parts would be optimal. On the other hand, in some dives a seal could increase its vertical sinuosity without increasing its time spent in the same part of the water column (i.e. vertical velocity). This would be the case if the seal pursues a prey moving faster vertically than horizontally in the water column or if “wiggling” while transiting at a faster rate than the defined threshold. Another mismatch between huntinghighres and huntinglowres parts would exist when a seal decreases its vertical transiting rate without performing wiggles. This would be observed if a seal meanders at depth exploring the water column horizontally to find a prey patch, orientate or glide (e.g. drift dives for elephant seals, [42]). Simultaneously recorded information on prey encounters and 3D diving movements would provide a better understanding of these different scenarios (e.g. [43]).
Nonetheless, our results are in agreement with our assumption that diving predators adjust their diving behaviour to maximise the time spent in a prey patch by displaying vertical ARS (i.e. increased vertical sinuosity and decreased vertical speed). Vertical sinuosity is often used as an index of foraging effort and/or feeding success [12–14, 44]. Moreover, even though acceleration data cannot discriminate between successful prey capture attempts and unsuccessful ones and may not represent actual feeding success, it is a powerful proxy for quantifying predator–prey encounters [33, 45–47] providing valuable information on the distribution and abundance of prey in the water column [29, 30, 48]. Similarly to the huntinghighres time, the huntinglowres time has the advantage of incorporating the entire dive profile to detect intensified foraging effort according to behavioural changes (see [21]) rather than a putative bottom phase. This method relies on a defined vertical velocity threshold. Therefore, preliminary analyses are advised (as before using any index or method on a new dataset) and would require the user to check the distribution of vertical velocities to adapt the method to his/her dataset. Then, huntinglowres mode segments and huntinglowres time could be used as a tool to: (1) isolate areas of foraging behaviour within a dive and (2) quantify the overall dive foraging effort using only low-resolution dive datasets.
Bottom time indices
Although not the best indices, bottom times (bt80 and bt60) were also correlated with huntinghighres time for both species. It is a commonly accepted idea that foraging activity mainly occurs during the bottom phase of a dive [15, 16, 18, 49] and so some measure of bottom time is often used as an index of foraging effort to investigate habitat use and dive behaviour [31, 35–38]. However, using only bt80 as an index of foraging effort in low-resolution dives could be misleading in over- (SES) or under-estimating (the Weddell seal) the actual time spent in intensive foraging mode (see [21]). Further, hunting occurred several times within a dive and not just during the bottom phase. This is perhaps why, for both species, incorporating a greater proportion of the dive profile in the bottom phase to calculate the bt (from bt80 to bt60) strengthened the correlations with huntinghighres time. Overall, we see two main limitations of using bottom time indices: these methods (1) only consider a proportion of the dive profile and it is often difficult to accurately define the actual bottom phase; and (2) assume that foraging is occurring only in one part of the dive instead of considering behavioural variations within the dive. Alternatively, the “huntinglowres time” method is a more appropriate measure of foraging effort, because it incorporates the entire dive profile and detects within-dive behavioural changes.
TAD and transiting rate indices
For both species, there were weak correlations between the TAD index, the descent/ascent rates and huntinghighres time. Dive classification studies often assume that square-shaped dives are foraging dives [12, 49, 50]. However, our results suggest that attributing an overall function to the dive based only on its shape might oversimplify the complexity of the within-dive activity of diving predators. Indeed, [21] demonstrated the dive complexity of seals (both Weddell seal and SES) that alternated between transit and hunting behaviour several times within each dive. We tested descent and ascent rates as possible candidates of foraging effort indices, as both are known to influence foraging activity of marine predators in different ways: (1) reflect favourable areas that a seal would want to reach and return to faster [15, 20, 50], (2) be used to prospect the water column and find a patch of prey [51, 52], (3) impact the time allocated to foraging activity due to its energetic costs [16, 39]. Without any information on changes in body condition or metabolic rate, it is difficult to draw conclusions based on these assumptions. However, our results suggest that only using transit rates poorly reflects the time spent in intensive foraging.
Ecological applications
During the last decade, SRDLs have been widely deployed on several species. These tags were primarily designed to monitor animal behaviour, but the integration of other sensors (temperature, conductivity, ambient light, etc.) provides insight into the direct responses of individuals to their environment [38, 53, 54]. Since 2004, more than 270 000 CTD profiles were collected using CTD-SRDLs from SMRU (Sea Mammal Research Unit, St Andrews, Scotland) in the frame of SEaOS (Southern Elephant Seals as Oceanographic Samplers) and MEOP (Marine Mammal Exploration of the Oceans Pole to Pole; hooded, crabeater, Weddell and southern elephant seals) programs [55, 56]. On average, two CTD profiles per day are transmitted and depending on the species the number of low-resolution dive profiles associated per day can be up to 15 more times (SES, Labrousse et al. unpublished data). Other projects like the Tagging of Pacific Pelagics (TOPP) has also deployed thousands of similar tags including SRDLs [8]. These numbers are impressive and show that millions of low-resolution dive profiles were or are to be analysed.
Our study showed that despite degraded information, insights on foraging activity (i.e. detection of within-dive intensive foraging occurrences and quantification of foraging effort) could be obtained when using low-resolution dive datasets as long as using a metric that is based on the detection of changes in predator’s diving behaviour. Our results were supported by independent PrCA, but the integration of complementary sensors (e.g. video recorders, stomach/oesophageal temperature sensors) from which feeding success could be inferred [43, 47, 57] would allow to further validate the method. This method was developed on a small amount of individuals, but on numerous dives and on two species displaying a broad range of different dive types [12, 13]. Moreover, the consistency of foraging strategies across different species [49] and the simplicity of the index suggest that this method could be applied to a broad range of diving species. For example, the huntinghighres and/or huntinglowres time could be included in the metrics calculated on board the tags and transmitted by SRDLs.
The behavioural adjustments of top predators when diving are expected to primarily reflect changes in their prey distribution in the three dimensions of the environment [3, 4]. Several methods have been developed to quantify how individuals concentrate their search effort along a given path (e.g. Hidden Markov model [58, 59], first passage time [60], state space model [61, 62]) and used to relate the defined horizontal ARS to particular structures of the environment (e.g. oceanographic features [31, 53, 63], sea ice [64, 65], topography [66, 67]). Bailleul et al. [36] underlined the importance of integrating a vertical index of foraging effort to better identify foraging areas when studying deep-diving marine predators. Indeed, for many marine predators, feeding occurs at depth and several studies demonstrated the association between oceanographic features of the water column and predator’s diving behaviour [9, 29, 38, 52, 68]. The inclusion of huntinglowres time when predicting switching between movement states (see [69]) would allow integrating a quantification of foraging effort at depth (where they encounter the prey) based on the detection of changes in diving behaviour and to relate the actual predator’s behaviour in the three dimensions to the heterogeneous environment they respond to. This method could therefore be a useful tool in both behavioural and ecological studies to characterise and/or predict at broad and fine scale which environmental features are likely to impact marine predators and their prey.
References
MacArthur RH, Pianka ER. On optimal use of a patchy environment. Am Nat. 1966;100(916):603–9.
Charnov EL. Optimal foraging, the marginal value theorem. Theor Popul Biol. 1976;9:129–36.
Fauchald P, Erikstad KE, Skarsfjord H. Scale-dependent predator–prey interactions: the hierarchical spatial distribution of seabirds and prey. Ecology. 2000;81:773–83.
Fauchald P, Erikstad KE. Scale-dependent predator–prey interactions: the aggregative response of seabirds to prey under variable prey abundance and patchiness. Mar Ecol Prog Ser. 2002;231:279–91.
Evans K, Lea M-A, Patterson TA. Recent advances in bio-logging science: technologies and methods for understanding animal behaviour and physiology and their environments. Deep Sea Res Part II Top Stud Oceanogr. 2012;88:1–6.
Fedak MA. The impact of animal platforms on polar ocean observation. Fourth Int Symp Bio Logging Sci. 2013;88–89:7–13.
Kooyman GL. Techniques used in measuring diving capacities of Weddell Seals. Polar Rec. 1965;12:391–4.
Block BA, Jonsen ID, Jorgensen SJ, Winship AJ, Shaffer SA, Bograd SJ, Hazen EL, Foley DG, Breed GA, Harrison A-L, Ganong JE, Swithenbank A, Castleton M, Dewar H, Mate BR, Shillinger GL, Schaefer KM, Benson SR, Weise MJ, Henry RW, Costa DP. Tracking apex marine predator movements in a dynamic ocean. Nature. 2011;475:86–90.
Guinet C, Vacquié-Garcia J, Picard B, Bessigneul G, Lebras Y, Dragon A, Viviant M, Arnould J, Bailleul F. Southern elephant seal foraging success in relation to temperature and light conditions: insight into prey distribution. Mar Ecol Prog Ser. 2014;499:285–301.
Fedak M, Lovell P, McConnell B, Hunter C. Overcoming the constraints of long range radio telemetry from animals: getting more useful data from smaller packages. Integr Comp Biol. 2002;42:3–10.
Fedak MA, Lovell P, Grant SM. Two approaches to compressing and interpreting time-depth information as as collected by time-depth recorders and satellite-linked data recorders. Mar Mammal Sci. 2001;17:94–110.
Hindell MA, Slip DJ, Burton HR. The diving behavior of adult male and female southern elephant seals, Mirounga leonina (Pinnipedia, Phocidae). Aust J Zool. 1991;39:595–619.
Schreer JF, Testa JW. Classification of Weddell seal diving behavior. Mar Mammal Sci. 1996;12:227–50.
Dragon AC, Bar-Hen A, Monestiez P, Guinet C. Horizontal and vertical movements as predictors of foraging success in a marine predator. Mar Ecol Prog Ser. 2012;447:243–57.
Houston AI, Carbone C. The optimal allocation of time during the diving cycle. Behav Ecol. 1992;3:255–65.
Thompson D, Hiby A, Fedak M. How fast should I swim? Behavioural implications of diving physiology. Symp Zool Soc Lond. 1993;66:349–68.
Lesage V, Hammill MO, Kovacs KM. Functional classification of harbor seal (Phoca vitulina) dives using depth profiles, swimming velocity, and an index of foraging success. Can J Zool. 1999;77:74–87.
Watanabe Y, Mitani Y, Sato K, Cameron MF, Naito Y. Dive depths of Weddell seals in relation to vertical prey distribution as estimated by image data. Mar Ecol Prog Ser. 2003;252:283–8.
Austin D, Bowen WD, McMillan JI, Iverson SJ. Linking movement, diving, and habitat to foraging success in a large marine predator. Ecology. 2006;87:3095–108.
Thums M, Bradshaw CJA, Sumner MD, Horsburgh JM, Hindell MA. Depletion of deep marine food patches forces divers to give up early. J Anim Ecol. 2013;82:72–83.
Heerah K, Hindell M, Guinet C, Charrassin J-B. A new method to quantify within dive foraging behaviour in marine predators. PLoS One. 2014;9:e99329.
Biuw M, Boehme L, Guinet C, Hindell M, Costa D, Charrassin J-B, Roquet F, Bailleul F, Meredith M, Thorpe S. Variations in behavior and condition of a Southern Ocean top predator in relation to in situ oceanographic conditions. Proc Natl Acad Sci. 2007;104:13705–10.
Bailleul F, Charrassin J-B, Ezraty R, Girard-Ardhuin F, McMahon CR, Field IC, Guinet C. Southern elephant seals from Kerguelen Islands confronted by Antarctic Sea ice. Changes in movements and in diving behaviour. Deep Sea Res Part II Top Stud Oceanogr. 2007;54:343–55.
Cherel Y, Ducatez S, Fontaine C, Richard P, Guinet C. Stable isotopes reveal the trophic position and mesopelagic fish diet of female southern elephant seals breeding on the Kerguelen Islands. Mar Ecol Prog Ser. 2008;370:239–47.
Bailleul F, Authier M, Ducatez S, Roquet F, Charrassin J-B, Cherel Y, Guinet C. Looking at the unseen: combining animal bio-logging and stable isotopes to reveal a shift in the ecological niche of a deep diving predator. Ecography. 2010;33:709–19.
Banks J, Lea M-A, Wall S, McMahon CR, Hindell MA. Combining bio-logging and fatty acid signature analysis indicates spatio-temporal variation in the diet of the southern elephant seal, Mirounga leonina. J Exp Mar Biol Ecol. 2014;450:79–90.
Walters A, Lea M-A, van den Hoff J, Field IC, Virtue P, Sokolov S, Pinkerton MH, Hindell MA. Spatially explicit estimates of prey consumption reveal a new krill predator in the Southern Ocean. PLoS One. 2014;9:e86452.
Lake S, Burton H, van den Hoff J. Regional, temporal and fine-scale spatial variation in Weddell seal diet at four coastal locations in east Antarctica. Mar Ecol Prog Ser. 2003;254:293–305.
Plötz J, Bornemann H, Knust R, Schröder A, Bester M. Foraging behaviour of Weddell seals, and its ecological implications. Polar Biol. 2001;24:901–9.
Naito Y, Bornemann H, Takahashi A, McIntyre T, Plötz J. Fine-scale feeding behavior of Weddell seals revealed by a mandible accelerometer. Polar Sci. 2010;4:309–16.
Dragon A-C, Monestiez P, Bar-Hen A, Guinet C. Linking foraging behaviour to physical oceanographic structures: southern elephant seals and mesoscale eddies east of Kerguelen Islands. Prog Oceanogr. 2010;87:61–71.
McIntyre T, Bornemann H, Plötz J, Tosh CA, Bester MN. Water column use and forage strategies of female southern elephant seals from Marion Island. Mar Biol. 2011;158:2125–39.
Viviant M, Trites AW, Rosen DAS, Monestiez P, Guinet C. Prey capture attempts can be detected in Steller sea lions and other marine predators using accelerometers. Polar Biol. 2009;33:713–9.
Gallon S, Bailleul F, Charrassin J-B, Guinet C, Bost C-A, Handrich Y, Hindell M. Identifying foraging events in deep diving southern elephant seals, Mirounga leonina, using acceleration data loggers. Deep Sea Res Part II Top Stud Oceanogr. 2012;88:14–22.
Burns JM, Hindell MA, Bradshaw CJA, Costa DP. Fine-scale habitat selection of crabeater seals as determined by diving behavior. Deep Sea Res Part II Top Stud Oceanogr. 2008;55:500–14.
Bailleul F, Pinaud D, Hindell M, Charrassin J-B, Guinet C. Assessment of scale-dependent foraging behaviour in southern elephant seals incorporating the vertical dimension: a development of the First Passage Time method. J Anim Ecol. 2008;77:948–57.
Bailleul F, Cotté C, Guinet C. Mesoscale eddies as foraging area of a deep-diving predator, the southern elephant seal. Mar Ecol Prog Ser. 2010;408:251–64.
Heerah K, Andrews-Goff V, Williams G, Sultan E, Hindell M, Patterson T, Charrassin J-B. Ecology of Weddell seals during winter: influence of environmental parameters on their foraging behaviour. Deep Sea Res Part II Top Stud Oceanogr. 2012;88:23–33.
Williams TM, Davis RW, Fuiman LA, Francis J, Le Boeuf BJ, Horning M, Calambokidis J, Croll DA. Sink or swim: strategies for cost-efficient diving by marine mammals. Science. 2000;288:133–6.
Adachi T, Maresh JL, Robinson PW, Peterson SH, Costa DP, Naito Y, Watanabe YY, Takahashi A. The foraging benefits of being fat in a highly migratory marine mammal. Proc R Soc B Biol Sci. 2014;281:20142120.
R Development Core Team. R: a language and environment for statistical computing. Vienna: R Foundation for Statistical Computing; 2008.
Biuw M. Blubber and buoyancy: monitoring the body condition of free-ranging seals using simple dive characteristics. J Exp Biol. 2003;206:3405–23.
Davis RW, Fuiman LA, Madden KM, Williams TM. Classification and behavior of free-ranging Weddell seal dives based on three-dimensional movements and video-recorded observations. Deep Sea Res Part II Top Stud Oceanogr. 2012;88:65–77.
Hindell MA, Crocker D, Mori Y, Tyack P. Foraging behaviour. In: Boyd IL, Bowen WD, Iverson SJ, editors. Marine mammal ecology and conservation—a handbook of techniques. Oxford: Oxford University Press; 2010. p. 241–62.
Suzuki I, Naito Y, Folkow LP, Miyazaki N, Blix AS. Validation of a device for accurate timing of feeding events in marine animals. Polar Biol. 2009;32:667–71.
Skinner J, Norberg S, Andrews R. Head striking during fish capture attempts by Steller sea lions and the potential for using head surge acceleration to predict feeding behavior. Endanger Species Res. 2009;10:61–9.
Watanabe YY, Takahashi A. Linking animal-borne video to accelerometers reveals prey capture variability. Proc Natl Acad Sci. 2013;110:2199–204.
Naito Y, Costa DP, Adachi T, Robinson PW, Fowler M, Takahashi A. Unravelling the mysteries of a mesopelagic diet: a large apex predator specializes on small prey. Funct Ecol. 2013;27:710–7.
Schreer JF, Kovacs KM, O’Hara Hines RJ. Comparative diving patterns of pinnipeds and seabirds. Ecol Monogr. 2001;71:137–62.
Thompson D, Fedak MA. How long should a dive last? A simple model of foraging decisions by breath-hold divers in a patchy environment. Anim Behav. 2001;61:287–96.
Wilson RP, Culik BM, Peters G, Bannasch R. Diving behaviour of Gentoo penguins, Pygoscelis papua; factors keeping dive profiles in shape. Mar Biol. 1996;126:153–62.
Charrassin J-B, Bost C-A. Utilisation of the oceanic habitat by king penguins over the annual cycle. Mar Ecol Prog Ser. 2001;221:285–98.
Muelbert MMC, De Souza RB, Lewis MN, Hindell MA. Foraging habitats of southern elephant seals, Mirounga leonina, from the Northern Antarctic Peninsula. Deep Sea Res Part II Top Stud Oceanogr. 2013;88–89:47–60.
O’Toole M, Hindell M, Charrassin J, Guinet C. Foraging behaviour of southern elephant seals over the Kerguelen Plateau. Mar Ecol Prog Ser. 2014;502:281–94.
Charrassin J-B, Hindell M, Rintoul SR, Roquet F, Sokolov S, Biuw M, Costa D, Boehme L, Lovell P, Coleman R, Timmermann R, Meijers A, Meredith M, Park Y-H, Bailleul F, Goebel M, Tremblay Y, Bost C-A, McMahon CR, Field IC, Fedak MA, Guinet C. Southern Ocean frontal structure and sea-ice formation rates revealed by elephant seals. Proc Natl Acad Sci. 2008;105:11634–9.
Roquet F, Wunsch C, Forget G, Heimbach P, Guinet C, Reverdin G, Charrassin J-B, Bailleul F, Costa DP, Huckstadt LA, Goetz KT, Kovacs KM, Lydersen C, Biuw M, Nøst OA, Bornemann H, Ploetz J, Bester MN, McIntyre T, Muelbert MC, Hindell MA, McMahon CR, Williams G, Harcourt R, Field IC, Chafik L, Nicholls KW, Boehme L, Fedak MA. Estimates of the Southern Ocean general circulation improved by animal-borne instruments: seals sample the Southern Ocean. Geophys Res Lett. 2013;40:6176–80.
Horsburgh JM, Morrice M, Lea M, Hindell MA. Determining feeding events and prey encounter rates in a southern elephant seal: a method using swim speed and stomach temperature. Mar Mammal Sci. 2008;24:207–17.
Patterson T, Thomas L, Wilcox C, Ovaskainen O, Matthiopoulos J. State–space models of individual animal movement. Trends Ecol Evol. 2008;23:87–94.
Patterson TA, Basson M, Bravington MV, Gunn JS. Classifying movement behaviour in relation to environmental conditions using hidden Markov models. J Anim Ecol. 2009;78:1113–23.
Fauchald P, Tveraa T. Using first-passage time in the analysis of area-restricted search and habitat selection. Ecology. 2003;84:282–8.
Jonsen ID, Myers RA, Flemming JM. Meta-analysis of animal movement using state-space models. Ecology. 2003;84:3055–63.
Jonsen ID, Flemming JM, Myers RA. Robust state-space modeling of animal movement data. Ecology. 2005;86:2874–80.
Cotté C, Guinet C, Taupier-Letage I, Mate B, Petiau E. Scale-dependent habitat use by a large free-ranging predator, the Mediterranean fin whale. Deep Sea Res Part Oceanogr Res Pap. 2009;56:801–11.
Freitas C, Kovacs KM, Ims RA, Fedak MA, Lydersen C. Ringed seal post-moulting movement tactics and habitat selection. Oecologia. 2008;155:193–204.
Freitas C, Kovacs KM, Ims RA, Fedak MA, Lydersen C. Deep into the ice: over-wintering and habitat selection in male Atlantic walruses. Mar Ecol Prog Ser. 2009;375:247–61.
Suryan RM, Sato F, Balogh GR, David Hyrenbach K, Sievert PR, Ozaki K. Foraging destinations and marine habitat use of short-tailed albatrosses: a multi-scale approach using first-passage time analysis. Deep Sea Res Part II Top Stud Oceanogr. 2006;53:370–86.
Andersen JM, Skern-Mauritzen M, Boehme L, Wiersma YF, Rosing-Asvid A, Hammill MO, Stenson GB. Investigating annual diving behaviour by hooded seals (Cystophora cristata) within the Northwest Atlantic Ocean. PLoS One. 2013;8:e80438.
Biuw M, Nøst OA, Stien A, Zhou Q, Lydersen C, Kovacs KM. Effects of hydrographic variability on the spatial, seasonal and diel diving patterns of southern elephant seals in the eastern Weddell sea. PLoS One. 2010;5:e13816.
Bestley S, Jonsen ID, Hindell MA, Guinet C, Charrassin J-B. Integrative modelling of animal movement: incorporating in situ habitat and behavioural information for a migratory marine predator. Proc R Soc B Biol Sci. 2012;280:20122262.
Authors’ contributions
KH developed the method described in the present manuscript, performed data analysis, interpreted the results and wrote the manuscript. MH, CG and JBC designed data collection, provided the datasets and guidance in data analysis and interpretations as well as major revisions to the present manuscript. All authors read and approved the final manuscript.
Acknowledgements
This study was supported by an Australian Antarctic Science grant (AAS project 2794), the programs CNES-TOSCA (“Ecologie des phoques de Weddell et bio-océanographie de la banquise antarctique” and “Eléphants de mer océanographes”), the ANR VMC-07: IPSOS seals and the Total foundation. All animals in this study were treated in accordance with the IPEV ethics and polar environment committee guidelines. We thank the IPEV (programs 109 and 394), TAAF and AAD for providing logistical support. We thank all the people that contributed to the field work in Dumont D’Urville and Kerguelen and data processing, especially J. Vaquié-Garcia and V. Andrews-Goff. We wish to thank M. Fedak for his help in the calculation of the TAD index and M. O’Toole for his comments and revisions of the manuscript.
Compliance with ethical guidelines
Competing interests The authors declare that they have no competing interests.
Author information
Authors and Affiliations
Corresponding author
Additional files
40317_2015_74_MOESM1_ESM.docx
Additional file 1. R2 of Spearman correlations between high-resolution and low-resolution foraging effort indices before removing the 141 likely drift dives associated with outlier residuals (see Materials and methods Sect. 2.2.2 and Additional file 2). See Table 2 for variable descriptions. SES stands for southern elephant seals.
40317_2015_74_MOESM2_ESM.tiff
Additional file 2. Results of the preliminary linear models fitted to huntinghighres time (time spent in highly sinuous parts of high-resolution dives) and the huntinglowres time (time spent in segments associated with vertical velocity ≤ 0.4 m s−1 of low-resolution dive) for the SES (A). The regression line of the model is represented in red. Residuals of this preliminary fit for the SES (B). Kernel density contour encompassing 90 and 50 % of the dives are represented in blue and red, respectively. A small proportion of dives (141 dives, 1.9 % of the dives) were not well explained by the model and suspected to be drift dives: dives below the green dotted lines and outside of the kernel density contour of 90 %.
40317_2015_74_MOESM3_ESM.tiff
Additional file 3. Residuals of linear models fitted to huntinghighres time and the huntinglowres time for the Weddell seal (A) and the SES (B) for the models presented in Figure 3.
40317_2015_74_MOESM4_ESM.docx
Additional file 4. Summary of the number, duration and depths of broken stick segments characterising high and low-resolution dives for each behavioural mode (transit vs hunting) (mean ± SE). SES: southern elephant seal, HR: high-resolution, LR: low-resolution.
Rights and permissions
Open Access This article is distributed under the terms of the Creative Commons Attribution 4.0 International License (http://creativecommons.org/licenses/by/4.0/), which permits unrestricted use, distribution, and reproduction in any medium, provided you give appropriate credit to the original author(s) and the source, provide a link to the Creative Commons license, and indicate if changes were made. The Creative Commons Public Domain Dedication waiver (http://creativecommons.org/publicdomain/zero/1.0/) applies to the data made available in this article, unless otherwise stated.
About this article

Cite this article
Heerah, K., Hindell, M., Guinet, C. et al. From high-resolution to low-resolution dive datasets: a new index to quantify the foraging effort of marine predators. Anim Biotelemetry 3, 42 (2015). https://doi.org/10.1186/s40317-015-0074-3
Received:
Accepted:
Published:
DOI: https://doi.org/10.1186/s40317-015-0074-3