
Abstract
Background
As reported by the World Health Organization, a novel coronavirus (2019-nCoV) was identified as the causative virus of Wuhan pneumonia of unknown etiology by Chinese authorities on 7 January, 2020. The virus was named as severe acute respiratory syndrome coronavirus 2 (SARS-CoV-2) by International Committee on Taxonomy of Viruses on 11 February, 2020. This study aimed to develop a mathematical model for calculating the transmissibility of the virus.
Methods
In this study, we developed a Bats-Hosts-Reservoir-People transmission network model for simulating the potential transmission from the infection source (probably be bats) to the human infection. Since the Bats-Hosts-Reservoir network was hard to explore clearly and public concerns were focusing on the transmission from Huanan Seafood Wholesale Market (reservoir) to people, we simplified the model as Reservoir-People (RP) transmission network model. The next generation matrix approach was adopted to calculate the basic reproduction number (R0) from the RP model to assess the transmissibility of the SARS-CoV-2.
Results
The value of R0 was estimated of 2.30 from reservoir to person and 3.58 from person to person which means that the expected number of secondary infections that result from introducing a single infected individual into an otherwise susceptible population was 3.58.
Conclusions
Our model showed that the transmissibility of SARS-CoV-2 was higher than the Middle East respiratory syndrome in the Middle East countries, similar to severe acute respiratory syndrome, but lower than MERS in the Republic of Korea.
Background
On 31 December 2019, the World Health Organization (WHO) China Country Office was informed of cases of pneumonia of unknown etiology (unknown cause) detected in Wuhan City, Hubei Province of China, and WHO reported that a novel coronavirus (2019-nCoV), which was named as severe acute respiratory syndrome coronavirus 2 (SARS-CoV-2) by International Committee on Taxonomy of Viruses on 11 February, 2020, was identified as the causative virus by Chinese authorities on 7 January [1]. It is reported that the virus might be bat origin [2], and the transmission of the virus might related to a seafood market (Huanan Seafood Wholesale Market) exposure [3, 4]. The genetic features and some clinical findings of the infection have been reported recently [4,5,6]. Potentials for international spread via commercial air travel had been assessed [7]. Public health concerns are being paid globally on how many people are infected and suspected.
Therefore, it is urgent to develop a mathematical model to estimate the transmissibility and dynamic of the transmission of the virus. There were several researches focusing on mathematical modelling [3, 8]. These researches focused on calculating the basic reproduction number (R0) by using the serial intervals and intrinsic growth rate [3, 9, 10], or using ordinary differential equations and Markov Chain Monte Carlo methods [8]. However, the bat origin and the transmission route form the seafood market to people were not considered in the published models.
In this study, we developed a Bats-Hosts-Reservoir-People (BHRP) transmission network model for simulating the potential transmission from the infection source (probably be bats) to the human infection. Since the Bats-Hosts-Reservoir network was hard to explore clearly and public concerns were focusing on the transmission from Huanan Seafood Wholesale Market (reservoir) to people, we simplified the model as Reservoir-People (RP) transmission network model, and R0 was calculated based on the RP model to assess the transmissibility of the SARS-CoV-2.
Methods
Data source
The reported cases of SARS-CoV-2, which have been named as COVID-19, were collected for the modelling study from a published literature [3]. As reported by Li et al. [3], the onset date of the first case was on 7 December, 2020, and the seafood market was closed on 1 January, 2020 [11]. The epidemic curve from 7 December, 2019 to 1 January, 2020 was collected for our study, and the simulation time step was 1 day.
Simulation methods and statistical analysis
Berkeley Madonna 8.3.18 (developed by Robert Macey and George Oster of the University of California at Berkeley. Copyright©1993–2001 Robert I. Macey & George F. Oster) was employed for the curve fitting. The fourth-order Runge–Kutta method, with tolerance set at 0.001, was used to perform curve fitting. While the curve fitting is in progress, Berkeley Madonna displays the root mean square deviation between the data and best run so far. The coefficient of determination (R2) was employed to assess the goodness-of-fit. SPSS 13.0 (IBM Corp., Armonk, NY, USA) was employed to calculate the R2.
The Bats-Hosts-Reservoir-People (BHRP) transmission network model
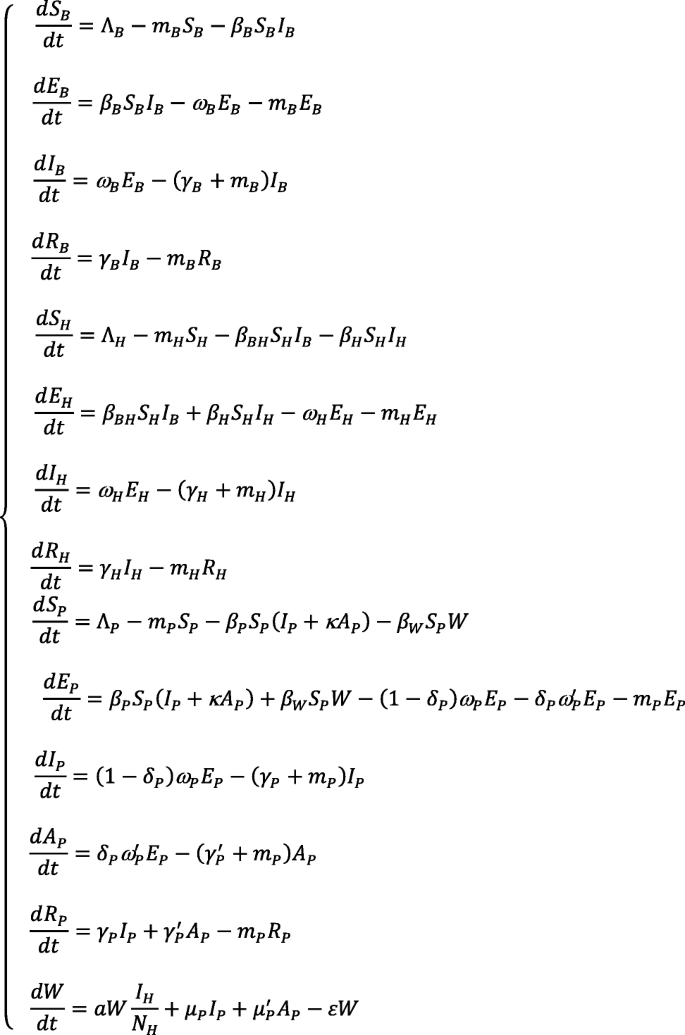
The BHRP transmission network model was posted to bioRxiv on 19 January, 2020 [12]. We assumed that the virus transmitted among the bats, and then transmitted to unknown hosts (probably some wild animals). The hosts were hunted and sent to the seafood market which was defined as the reservoir of the virus. People exposed to the market got the risks of the infection (Fig. 1). The BHRP transmission network model was based on the following assumptions or facts:
- a)
The bats were divided into four compartments: susceptible bats (SB), exposed bats (EB), infected bats (IB), and removed bats (RB). The birth rate and death rate of bats were defined as nB and mB. In this model, we set ɅB = nB × NB as the number of the newborn bats where NB refer to the total number of bats. The incubation period of bat infection was defined as 1/ωB and the infectious period of bat infection was defined as 1/γB. The SB will be infected through sufficient contact with IB, and the transmission rate was defined as βB.
- b)
The hosts were also divided into four compartments: susceptible hosts (SH), exposed hosts (EH), infected hosts (IH), and removed hosts (RH). The birth rate and death rate of hosts were defined as nH and mH. In this model, we set ɅH = nH × NH where NH refer to the total number of hosts. The incubation period of host infection was defined as 1/ωH and the infectious period of host infection was defined as 1/γH. The SH will be infected through sufficient contact with IB and IH, and the transmission rates were defined as βBH and βH, respectively.
- c)
The SARS-CoV-2 in reservoir (the seafood market) was denoted as W. We assumed that the retail purchases rate of the hosts in the market was a, and that the prevalence of SARS-CoV-2 in the purchases was IH/NH, therefore, the rate of the SARS-CoV-2 in W imported form the hosts was aWIH/NH where NH was the total number of hosts. We also assumed that symptomatic infected people and asymptomatic infected people could export the virus into W with the rate of μP and μ’P, although this assumption might occur in a low probability. The virus in W will subsequently leave the W compartment at a rate of εW, where 1/ε is the lifetime of the virus.
- d)
The people were divided into five compartments: susceptible people (SP), exposed people (EP), symptomatic infected people (IP), asymptomatic infected people (AP), and removed people (RP) including recovered and death people. The birth rate and death rate of people were defined as nP and mP. In this model, we set ɅP = nP × NP where NP refer to the total number of people. The incubation period and latent period of human infection was defined as 1/ωP and 1/ω’P. The infectious period of IP and AP was defined as 1/γP and 1/γ’P. The proportion of asymptomatic infection was defined as δP. The SP will be infected through sufficient contact with W and IP, and the transmission rates were defined as βW and βP, respectively. We also assumed that the transmissibility of AP was κ times that of IP, where 0 ≤ κ ≤ 1.

Flowchart of the Bats-Hosts-Reservoir-People transmission network model
The parameters of the BHRP model were shown in Table 1.
The simplified reservoir-people transmission network model
We assumed that the SARS-CoV-2 might be imported to the seafood market in a short time. Therefore, we added the further assumptions as follows:
- a)
The transmission network of Bats-Host was ignored.
- b)
Based on our previous studies on simulating importation [13, 14], we set the initial value of W as following impulse function:
$$ Importation= impulse\left(n,{t}_0,{t}_i\right) $$
In the function, n, t0 and ti refer to imported volume of the SARS-CoV-2 to the market, start time of the simulation, and the interval of the importation.
Therefore, the BHRP model was simplified as RP model and is shown as follows:
During the outbreak period, the natural birth rate and death rate in the population was in a relative low level. However, people would commonly travel into and out from Wuhan City mainly due to the Chinese New Year holiday. Therefore, nP and mP refer to the rate of people traveling into Wuhan City and traveling out from Wuhan City, respectively.
In the model, people and viruses have different dimensions. Based on our previous research [15], we therefore used the following sets to perform the normalization:
In the normalization, parameter c refers to the relative shedding coefficient of AP compared to IP. The normalized RP model is changed as follows:
The transmissibility of the SARS-CoV-2 based on the RP model
In this study, we used the R0 to assess the transmissibility of the SARS-CoV-2. Commonly, R0 was defined as the expected number of secondary infections that result from introducing a single infected individual into an otherwise susceptible population [13, 16, 17]. If R0 > 1, the outbreak will occur. If R0 < 1, the outbreak will toward an end. In this study, R0 was deduced from the RP model by the next generation matrix approach [18].
Parameter estimation
The parameters were estimated based on the following facts and assumptions:
- a)
The mean incubation period was 5.2 days (95% confidence interval [CI]: 4.1–7.0) [3]. We set the same value (5.2 days) of the incubation period and the latent period in this study. Thus, ωP = ω’P = 0.1923.
- b)
There is a mean 5-day delay from symptom onset to detection/hospitalization of a case (the cases detected in Thailand and Japan were hospitalized from 3 to 7 days after onset, respectively) [19,20,21]. The duration from illness onset to first medical visit for the 45 patients with illness onset before January 1 was estimated to have a mean of 5.8 days (95% CI: 4.3–7.5) [3]. In our model, we set the infectious period of the cases as 5.8 days. Therefore, γP = 0.1724.
- c)
Since there was no data on the proportion of asymptomatic infection of the virus, we simulated the baseline value of proportion of 0.5 (δP = 0.5).
- d)
Since there was no evidence about the transmissibility of asymptomatic infection, we assumed that the transmissibility of asymptomatic infection was 0.5 times that of symptomatic infection (κ = 0.5), which was the similar value as influenza [22]. We assumed that the relative shedding rate of AP compared to IP was 0.5. Thus, c = 0.5.
- e)
Since 14 January, 2020, Wuhan City has strengthened the body temperature detection of passengers leaving Wuhan at airports, railway stations, long-distance bus stations and passenger terminals. As of January 17, a total of nearly 0.3 million people had been tested for body temperature [23]. In Wuhan, there are about 2.87 million mobile population [24]. We assumed that there was 0.1 million people moving out to Wuhan City per day since January 10, 2020, and we believe that this number would increase (mainly due to the winter vacation and the Chinese New Year holiday) until 24 January, 2020. This means that the 2.87 million would move out from Wuhan City in about 14 days. Therefore, we set the moving volume of 0.2 million per day in our model. Since the population of Wuhan was about 11 million at the end of 2018 [25], the rate of people traveling out from Wuhan City would be 0.018 (0.2/11) per day. However, we assumed that the normal population mobility before January 1 was 0.1 times as that after January 10. Therefore, we set the rate of people moving into and moving out from Wuhan City as 0.0018 per day (nP = mP = 0.0018).
- f)
The parameters bP and bW were estimated by fitting the model with the collected data.
- g)
At the beginning of the simulation, we assumed that the prevalence of the virus in the market was 1/100000.
- h)
Since the SARS-CoV-2 is an RNA virus, we assumed that it could be died in the environment in a short time, but it could be stay for a longer time (10 days) in the unknown hosts in the market. We set ε = 0.1.
Results
In this study, we assumed that the incubation period (1/ωP) was the same as latent period (1/ω’P) of human infection, thus ωP = ω’P. Based on the equations of RP model, we can get the disease free equilibrium point as:
In the matrix:
By the next generation matrix approach, we can get the next generation matrix and R0 for the RP model:
The R0 of the normalized RP model is shown as follows:
Our modelling results showed that the normalized RP model fitted well to the reported SARS-CoV-2 cases data (R2 = 0.512, P < 0.001) (Fig. 2). The value of R0 was estimated of 2.30 from reservoir to person, and from person to person and 3.58 from person to person which means that the expected number of secondary infections that result from introducing a single infected individual into an otherwise susceptible population was 3.58.

Curve fitting results of the RP model
Discussion
In this study, we developed RP transmission model, which considering the routes from reservoir to person and from person to person of SARS-CoV-2 respectively. We used the models to fit the reported data in Wuhan City, China from published literature [3]. The simulation results showed that the R0 of SARS-CoV-2 was 3.58 from person to person. There was a research showed that the R0 of SARS-CoV-2 was 2.68 (95% CI: 2.47–2.86) [8]. Another research showed that the R0 of SARS-CoV-2 was 2.2 (95% CI: 1.4–3.9) [3]. The different values might be due to the different methods. The methods which Li et al. employed were based on the epidemic growth rate of the epidemic curve and the serial interval [3]. Our previous study showed that several methods could be used to calculate the R0 based on the epidemic growth rate of the epidemic curve and the serial interval, and different methods might result in different values of R0 [26]. Our results also showed that the R0 of SARS-CoV-2 was 2.30 from reservoir to person which was lower than that of person to person. This means that the transmission route was mainly from person to person rather than from reservoir to person in the early stage of the transmission in Wuhan City. However, this result was based on the limited data from a published literature, and it might not show the real situation at the early stage of the transmission.
Researches showed that the R0 of severe acute respiratory syndrome (SARS) was about 2.7–3.4 or 2–4 in Hong Kong, China [27, 28]. Another research found that the R0 of SARS was about 2.1 in Hong Kong, China, 2.7 in Singapore, and 3.8 in Beijing, China [29]. Therefore, we believe that the commonly acceptable average value of the R0 of SARS might be 2.9 [30]. The transmissibility of the Middle East respiratory syndrome (MERS) is much lower than SARS. The reported value of the R0 of MERS was about 0.8–1.3 [31], with the inter-human transmissibility of the disease was about 0.6 or 0.9 in Middle East countries [32]. However, MERS had a high transmissibility in the outbreak in the Republic of Korea with the R0 of 2.5–7.2 [33, 34]. Therefore, the transmissibility of SARS-CoV-2 might be higher than MERS in the Middle East countries, similar to SARS, but lower than MERS transmitted in the Republic of Korea.
To contain the transmission of the virus, it is important to decrease R0. According to the equation of R0 deduced from the simplified RP model, R0 is related to many parameters. The mainly parameters which could be changed were bP, bW, and γ. Interventions such as wearing masks and increasing social distance could decrease the bP, the intervention that close the seafood market could decrease the bW, and shorten the duration form symptoms onset to be diagnosed could decrease 1/γ. All these interventions could decrease the effective reproduction number and finally be helpful to control the transmission.
Since there are too many parameters in our model, several limitations exist in this study. Firstly, we did not use the detailed data of the SARS-CoV-2 to perform the estimation instead of using the data from literatures [3]. We simulated the natural history of the infection that the proportion of asymptomatic infection was 50%, and the transmissibility of asymptomatic infection was half of that of symptomatic infection, which were different to those of MERS and SARS. It is known that the proportion of asymptomatic infection of MERS and SARS was lower than 10%. Secondly, the parameters of population mobility were not from an accurate dataset. Thirdly, since there was no data of the initial prevalence of the virus in the seafood market, we assumed the initial value of 1/100 000. This assumption might lead to the simulation been under- or over-estimated. In addition, since we did not consider the changing rate of the individual’s activity (such as wearing masks, increasing social distance, and not to travel to Wuhan City), the estimation of importation of the virus might not be correct. All these limitations will lead to the uncertainty of our results. Therefore, the accuracy and the validity of the estimation would be better if the models fit the first-hand data on the population mobility and the data on the natural history, the epidemiological characteristics, and the transmission mechanism of the virus.
Conclusions
By calculating the published data, our model showed that the transmissibility of SARS-CoV-2 might be higher than MERS in the Middle East countries, similar to SARS, but lower than MERS in the Republic of Korea. Since the objective of this study was to provide a mathematical model for calculating the transmissibility of SARS-CoV-2, the R0 was estimated based on limited data which published in a literature. More data were needed to estimate the transmissibility accurately.
Availability of data and materials
Not applicable.
Abbreviations
- 2019-nCoV:
-
2019 novel coronavirus
- BHRP:
-
Bats-Hosts-Reservoir-People
- R 0 :
-
Basic reproduction number
- RP:
-
Reservoir-People
- SARS-CoV-2:
-
Severe acute respiratory syndrome coronavirus 2
- WHO:
-
World Health Organization
References
World Health Organization. Coronavirus. World Health Organization, cited January 19, 2020. Available: https://www.who.int/health-topics/coronavirus.
Zhou P, Yang XL, Wang XG, Hu B, Zhang L, Zhang W, et al. A pneumonia outbreak associated with a new coronavirus of probable bat origin. Nature. 2020. https://doi.org/10.1038/s41586-020-2012-7.
Li Q, Guan X, Wu P, Wang X, Zhou L, Tong Y, et al. Early transmission dynamics in Wuhan, China, of novel coronavirus-infected pneumonia. N Engl J Med. 2020. https://doi.org/10.1056/NEJMoa2001316.
Huang C, Wang Y, Li X, Ren L, Zhao J, Hu Y, et al. Clinical features of patients infected with 2019 novel coronavirus in Wuhan, China. Lancet. 2020. https://doi.org/10.1016/S0140-6736(20)30183-5.
Chan JF, Yuan S, Kok KH, To KK, Chu H, Yang J, et al. A familial cluster of pneumonia associated with the 2019 novel coronavirus indicating person-to-person transmission: a study of a family cluster. Lancet. 2020. https://doi.org/10.1016/S0140-6736(20)30154-9.
Zhu N, Zhang D, Wang W, Li X, Yang B, Song J, et al. A novel coronavirus from patients with pneumonia in China, 2019. N Engl J Med. 2020. https://doi.org/10.1056/NEJMoa2001017.
Bogoch II, Watts A, Thomas-Bachli A, Huber C, Kraemer MUG, Khan K. Pneumonia of unknown etiology in Wuhan, China: Potential for International Spread Via Commercial Air Travel. J Travel Med. 2020. https://doi.org/10.1093/jtm/taaa008.
Wu JT, Leung K, Leung GM. Nowcasting and forecasting the potential domestic and international spread of the 2019-nCoV outbreak originating in Wuhan, China: a modelling study. Lancet. 2020. https://doi.org/10.1016/S0140-6736(20)30260-9.
Zhao S, Lin Q, Ran J, Musa SS, Yang G, Wang W, et al. Preliminary estimation of the basic reproduction number of novel coronavirus (2019-nCoV) in China, from 2019 to 2020: a data-driven analysis in the early phase of the outbreak. Int J Infect Dis. 2020. https://doi.org/10.1016/j.ijid.2020.01.050.
Zhao S, Musa SS, Lin Q, Ran J, Yang G, Wang W, et al. Estimating the unreported number of novel coronavirus (2019-nCoV) cases in China in the first half of January 2020: a data-driven Modelling analysis of the early outbreak. J Clin Med. 2020. https://doi.org/10.3390/jcm9020388.
World Health Organization. Novel Coronavirus – China. World Health Organization. cited January 20, 2020. Available: https://www.who.int/csr/don/12-january-2020-novel-coronavirus-china/en/. Accessed 20 Jan 2020.
Chen T, Rui J, Wang Q, Zhao Z, Cui J-A, Yin L. A mathematical model for simulating the transmission of Wuhan novel Coronavirus. bioRxiv. 2020:2020.2001.2019.911669. Accessed 13 Feb 2020.
Chen T, Ka-Kit Leung R, Liu R, Chen F, Zhang X, Zhao J, et al. Risk of imported Ebola virus disease in China. Travel Med Infect Dis. 2014;12:650–8.
Yi B, Chen Y, Ma X, Rui J, Cui JA, Wang H, et al. Incidence dynamics and investigation of key interventions in a dengue outbreak in Ningbo City, China. PLoS Negl Trop Dis. 2019;13:e0007659.
Chen T, Leung RK, Zhou Z, Liu R, Zhang X, Zhang L. Investigation of key interventions for shigellosis outbreak control in China. PLoS One. 2014;9:e95006.
Zhang S, Hu Q, Deng Z, Hu S, Liu F, Yu S, et al. Transmissibility of acute haemorrhagic conjunctivitis in small-scale outbreaks in Hunan Province, China. Sci Rep. 2020;10:119.
Chen S, Yang D, Liu R, Zhao J, Yang K, Chen T. Estimating the transmissibility of hand, foot, and mouth disease by a dynamic model. Public Health. 2019;174:42–8.
Cui J-A, Zhao S, Guo S, Bai Y, Wang X, Chen T. Global dynamics of an epidemiological model with acute and chronic HCV infections. Appl Math Lett. 2020;103:106203.
Japan MoH. Development of patients with pneumonia associated with new coronavirus. Ministry of Health Japan. cited 16 Jan 2020. Available: https://www.mhlw.go.jp/stf/newpage_08906.html.
World Health Organization. Novel Coronavirus – Thailand (ex-China). World Health Organization. cited January 20, 2020. Available: https://www.who.int/csr/don/14-january-2020-novel-coronavirus-thailand/en/.
World Health Organization. Novel Coronavirus – Japan (ex-China). World Health Organization. cited January 20, 2020. Available: https://www.who.int/csr/don/17-january-2020-novel-coronavirus-japan-ex-china/en/.
Longini IM Jr, Nizam A, Xu S, Ungchusak K, Hanshaoworakul W, Cummings DA, et al. Containing pandemic influenza at the source. Science. 2005;309:1083–7.
TAKEFOTO.CN. Wuhan City set up temperature detection points and screening points to strengthen the temperature detection of passengers leaving Wuhan. . TAKEFOTO.CN. cited January 20, 2020. Available: https://baijiahao.baidu.com/s?id=1656211292146188271&wfr=spider&for=pc.
China Business Network. Wuhan City has a permanent floating population of 2.87 million, ranking 15th in migration. China Business Network. cited January 20, 2020:Available: https://baijiahao.baidu.com/s?id=1656237519515683348&wfr=spider&for=pc.
Wuhan Government. Population distribution. Wuhan Government. cited January 20, 2020. Available: http://www.wuhan.gov.cn/2019_web/zjwh_5785/whgk/201910/t20191022_20290870.html.
Chen TM, Chen QP, Liu RC, Szot A, Chen SL, Zhao J, et al. The transmissibility estimation of influenza with early stage data of small-scale outbreaks in Changsha, China, 2005-2013. Epidemiol Infect. 2017;145:424–33.
Riley S, Fraser C, Donnelly CA, Ghani AC, Abu-Raddad LJ, Hedley AJ, et al. Transmission dynamics of the etiological agent of SARS in Hong Kong: impact of public health interventions. Science. 2003;300:1961–6.
Dye C, Gay N. Epidemiology. Modeling the SARS epidemic. Science. 2003;300:1884–5.
Zhou G, Yan G. Severe acute respiratory syndrome epidemic in Asia. Emerg Infect Dis. 2003;9:1608–10.
Peak CM, Childs LM, Grad YH. Comparing nonpharmaceutical interventions for containing emerging epidemics. Proc Natl Acad Sci U S A. 2017;114:4023–8.
Cauchemez S, Fraser C, Van Kerkhove MD, Donnelly CA, Riley S, Rambaut A, et al. Middle East respiratory syndrome coronavirus: quantification of the extent of the epidemic, surveillance biases, and transmissibility. Lancet Infect Dis. 2014;14:50–6.
Breban R, Riou J, Fontanet A. Interhuman transmissibility of Middle East respiratory syndrome coronavirus: estimation of pandemic risk. Lancet. 2013;382:694–9.
Zhang XS, Pebody R, Charlett A, de Angelis D, Birrell P, Kang H, et al. Estimating and modelling the transmissibility of Middle East respiratory syndrome CoronaVirus during the 2015 outbreak in the Republic of Korea. Influenza Other Respir Viruses. 2017;11:434–44.
Xia ZQ, Zhang J, Xue YK, Sun GQ, Jin Z. Modeling the transmission of Middle East respirator syndrome Corona virus in the Republic of Korea. PLoS One. 2015;10:e0144778.
Acknowledgements
We thank Qingqing Hu at School of Medicine, University of Utah for her reviewing and editing the English language.
Funding
This study was supported by Xiamen New Coronavirus Prevention and Control Emergency Tackling Special Topic Program (No: 3502Z2020YJ03).
Author information
Authors and Affiliations
Contributions
TC designed research; TC conceived the experiments, TC, JR, ZZ, QW, JAC, and LY conducted the experiments and analyzed the results; TC and JAC wrote the manuscript. All authors read and approved the final manuscript.
Corresponding author
Ethics declarations
Ethics approval and consent to participate
Not applicable.
Consent for publication
Not applicable.
Competing interests
The authors declare that they have no competing interests.
Rights and permissions
Open Access This article is licensed under a Creative Commons Attribution 4.0 International License, which permits use, sharing, adaptation, distribution and reproduction in any medium or format, as long as you give appropriate credit to the original author(s) and the source, provide a link to the Creative Commons licence, and indicate if changes were made. The images or other third party material in this article are included in the article's Creative Commons licence, unless indicated otherwise in a credit line to the material. If material is not included in the article's Creative Commons licence and your intended use is not permitted by statutory regulation or exceeds the permitted use, you will need to obtain permission directly from the copyright holder. To view a copy of this licence, visit http://creativecommons.org/licenses/by/4.0/. The Creative Commons Public Domain Dedication waiver (http://creativecommons.org/publicdomain/zero/1.0/) applies to the data made available in this article, unless otherwise stated in a credit line to the data.
About this article

Cite this article
Chen, TM., Rui, J., Wang, QP. et al. A mathematical model for simulating the phase-based transmissibility of a novel coronavirus. Infect Dis Poverty 9, 24 (2020). https://doi.org/10.1186/s40249-020-00640-3
Received:
Accepted:
Published:
DOI: https://doi.org/10.1186/s40249-020-00640-3