
Abstract
Background
Land-use systems that sequester carbon and reduce CO2 emissions are key in the global mitigation strategies of climate change. Greenhouse gas emission from agro-ecosystems in sub-Saharan Africa is little studied. Here, we quantified soil carbon stock (SCS) and CO2 emissions from three land-use systems viz. arable land, oil palm plantation and forestland in the semi-deciduous forest zone of Ghana.
Results
Soil organic carbon concentration at the 0–15 cm layer in the forestland was 62 and 23% greater than that in the arable land and palm plantation, respectively. The SCS along the 1.0-m profile was 108.2, 99.0 and 73.5 Mg ha−1 in the forestland, palm plantation and arable land, respectively. Arable land emitted 30–46% more CO2 than palm plantation and forestland. In the dry season, CO2 emissions were respectively 0.93, 0.63 and 0.5 kg ha−1 h−1 from the arable land, palm plantation and forestland. Positive relationships were observed between CO2 emissions and SCS, soil temperature, and moisture. The SCS greatly influenced CO2 emission in the dry season more than in the wet season in the relatively higher carbon-input systems (forestland and palm plantation). Soil temperature accounted for more than 55% of CO2 emissions in both seasons, which has implications in the era of rising global temperatures.
Conclusions
The study provides relevant information on carbon storage abilities of the three land-use types in tropical climate and calls for drastic climate change actions to reduce degradation of forest cover and soil disturbance in agro-ecosystems in sub-Saharan Africa.
Background
Climate change has, over the years, been a global concern driven by elevated concentrations of greenhouse gases (GHGs) in the atmosphere, of which, carbon dioxide (CO2) is the most important (Stavi and Lal 2013). Land management practices, which sequester carbon or reduce the emissions of CO2,, are being considered in the mitigation strategies of climate change (Zomer et al. 2008; Logah et al. 2020). Programmes and institutions have been established at national and international levels to look into climate change and land use, predict likely changes and corresponding impacts and suggest responses regarding adaptation to climate change and mitigation (Garnaut 2008; Department of Environment and Resource Management (DERM) 2011). For example, programmes such as the Clean Development Mechanism (CDM), which was commenced under the Kyoto Protocol and the reducing emissions from deforestation and forest degradation in developing countries (REDD+) through the United Nations Framework Convention on Climate Change (UNFCCC) are giving financial assistance to support the sequestration of carbon and reduce the emissions of greenhouse gas from land-use change (Dayamba et al. 2016). However, data availability on soil carbon stocks and emissions of CO2 associated with land use is hindering the implementation of these mechanisms in tropical countries (Verchot et al. 2012).
The soil has become one of the most vulnerable resources globally via climate change, land degradation and loss of biodiversity (FAO and Intergovernmental Technical Panel on Soils (ITPS) 2015). It plays a crucial role in the fight against climate change by controlling the global carbon cycle. The soil represents the most important long-term organic carbon reservoir in the terrestrial ecosystems, which act as a source or a sink of atmospheric CO2. It contains approximately twice (1500 Pg C) the amount of carbon (C) in the atmosphere (about 800 Pg C) and about three times the amount in plant biomass (500 Pg C) (Schimel 1995; Lal 2004; Intergovernmental Panel on Climate Change (IPCC) 2007; Tarnocai 2009). However, the large soil reserve is not permanent and results from a dynamic equilibrium between organic and inorganic materials leaving and entering the system. Hence, a relatively small change in the soil carbon pool can enhance or mitigate considerable CO2 concentrations in the atmosphere (Lal 2004; FAO 2017). Land-use types have major influence on soil C stock. The type of vegetation cover influences the abundance of organic carbon in the soil (Jobbagy and Jackson 2000), which in turn affects plant production.
In tropical countries, the contribution of agriculture and forest to GHG emissions is very significant (Asumadu-Sarkodie and Owusu 2016). Agriculture being a major contributing factor of climate change, contributing up to 29% of the annual GHG emissions, is also part of the solution as it offers opportunities for alleviation through soil carbon capture, plant biomass production and improved land use management (Nelson 2009; Vermeulen et al. 2012). In spite of the global attention given to agricultural land use management as an important initiative in reducing C emissions to the atmosphere, its inclusion in farming systems in sub-Saharan Africa (SSA) is limited (Tiessen et al. 1998; Smalling and Dixon 2006; Bationo et al. 2007; Agboadoh 2011).
The REDD+ initiative currently considers C conversion in farming systems a thematic area for emission reduction. Also, the potential consideration of soil carbon credit under the Kyoto Protocol emphasizes the need for a detailed data on soil C stocks in SSA (Takimoto et al. 2008; Nketia et al. 2009). However, the complexity of the dynamics underlying soil C storage and release makes the evaluation of soil C sources and sinks difficult and still not well understood (Wang and Hsieh 2002; Scharlemann et al. 2014). In Africa, not much has been done on soil C storage and especially emissions in land-use systems (Yao et al. 2010). This is despite the fact that such data will help predict the rate of change of carbon stock and other environmental variables associated with land-use systems and also engender a better understanding of the influence of terrestrial ecosystems on the climate. This study therefore sought to quantify soil carbon stock and CO2 emissions under selected agro-ecosystems and adjacent forestland and to establish the extent to which the emission is influenced by soil factors in a tropical climate.
Methods
Experimental site and plot layout
The study was conducted at the Agricultural Research Station, Anwomaso of the Kwame Nkrumah University of Science and Technology (KNUST), Kumasi. The site is located in the Semi-deciduous Forest Agro-ecological Zone of Ghana and lies on latitude 6.69514° N and longitude 1.52477° W geographically. The area is characterized by a bimodal rainfall regime with March to July as the major season with the minor season spanning from September to November. The bimodal rainfall regime is interspersed with a short dry spell in August. The mean rainfall amount in the study area ranges between 1300 and 1500 mm annually (Opoku-Ankomah and Cordery 1994; Nkrumah and Adukpo 2014) with the mean annual temperature ranging between 22 and 31 °C (Adu 1992). The soil type is Plinthic Vetic Lixisol (Amegashie 2014).
Three different land-use systems, namely, oil palm plantation, arable land and natural forestland at the Research Station were selected for the study. The oil palm plantation has been in existence since the year 2000. Soils in the plantation do not receive any form of fertilizer. Weed control (manual, mechanical and sometimes the use of weedicides) and pruning are the key management practices carried out in the plantation. The arable land at the Research Station is mainly used for the cultivation of maize, plantain, cassava, yam, cocoyam, vegetables (cabbage, tomato, pepper, okro, lettuce) and sometimes legumes. It has been under cultivation for over 20 years. Experimental plots on the arable land were laid on the maize farms. Inorganic fertilizers (specifically N, P and K) are applied to the soils in areas where maize is cultivated at a rate of 90 – 60 − 60 kg ha-1 N − P2O5 − K2O (Tetteh et al. 2008; Logah et al. 2011). Other management practices such as weed and pest control are also carried out. The nearby forestland (measuring (~ 2½ ha) used for this study has never been cultivated. In each of the land-use systems, a 1.0-ha area was demarcated within which, five 20 × 20 m plots were randomly demarcated. The three land-use systems constituted the treatments for the study.
Soil and CO2 fluxes sampling
Soil sampling was done randomly at 0–15 and 15–30 cm depths from each of the subplots for routine analyses. Ten (10) samples were taken at both depths in each subplot and bulked as composite sample, representative of each plot. In the ecosystems, deep auguring was also carried out in each subplot at 0–15, 15–30, 30–50 and 50–100 cm depths for soil organic carbon stock determination. Carbon dioxide (CO2) fluxes sampling was done at three randomly selected points in each plot within each land-use system. This was done for 30 days each in both the dry (February to March 2019) and wet (June to July 2019) seasons at 48 h interval.
Laboratory and analytical procedures
All analyses were carried out in the Soil Science Laboratory of the Department of Crop and Soil Sciences, KNUST. Prior to analysis, soil samples were air-dried, crushed and sieved through a 2-mm mesh sieve. Bulk density was determined from core samples following oven drying at 105 °C for 24 h. The hydrometer method was used for soil texture determination (Anderson and Ingram 1998). The pH of the soils was measured using pH meter (PHS – 3E 510) in a 1:1 soil: water suspension. Soil organic carbon (SOC) and total nitrogen (N) were determined on the elemental analyser (Vario Macro cube, Germany). The Bray 1 method was employed for the determination of available phosphorus (Bray and Kurtz 1945). Exchangeable bases (Ca2+, Mg2+, K+ and Na+) were extracted with ammonium acetate (1.0 M NH4OAc) at pH 7 (Black 1986) whereas exchangeable aluminium was extracted with 1.0 M KCl and titrated with 0.1 M NaOH. Effective cation exchange capacity (ECEC) was calculated by summation of the exchangeable bases and exchangeable aluminium (Al3+). Soil microbial biomass carbon, nitrogen and phosphorus (MBC, MBN and MBP) were determined using the chloroform fumigation and extraction procedure described by Ladd et al. (1990).
Calculation of soil organic carbon stock (SCS)
The SCS was calculated using the Donovan (2013) formula:
where:
SCS = soil organic carbon stock (Mg ha−1)
SOC = soil organic carbon concentration
BD = soil bulk density (kg m−3)
V = volume of soil (m3)
Measurement of soil CO2 production
The gas entrapment method was employed to measure CO2 emissions from the soil (Hutchinson and Mosier 1981; Sullivan et al. 2008). Polyvinylchloride (PVC) chambers were inserted into the soil (5 cm deep). Ten millilitres of 3 M NaOH solution was dispensed into a vial and placed under the chamber to trap CO2 evolving from the soil. Control vials containing the same volume of 3 M NaOH (with their lids on to exclude CO2 evolving from the soil) were also placed under the chambers. Sampling of CO2 emission from the soil was done at 48 h interval for 30 days. At sampling, the vials were removed and covered immediately with lids. The evolved CO2 from the soil was measured by back titration using 1.0 M HCl and phenolphthalein indicator. The mass of CO2 was calculated as (Crossno et al. 1996):
where:
CO2 = mass of carbon dioxide evolved
C(HCl) = molarity of HCl used
V(HCl) = volume of HCl
MCO2 = molecular weight of CO2
Soil temperature and moisture content were measured along with CO2 sampling during the period of the experiment. Soil temperature was measured at 5 cm depth using a digital probe while moisture content was determined by the gravimetric method.
Statistical analysis
Analysis of variance (ANOVA) was performed on all parameters separately using the GenStat statistical package (edition 12). Mean separations were done using the least significant difference (LSD) method at 5% probability level. Regression and correlation analyses were done to determine the relationship between CO2 emission rates and selected soil parameters (temperature, moisture) and SCS. The significance of the relationships was tested at 5% level of probability.
Results
Edaphic characteristics of the land-use systems
Soil physical properties of the land-use systems examined are presented in Table 1. Generally, soil bulk density increased with depth in all the land-use systems with higher values (p < 0.05) observed in the arable land than in the oil palm plantation and forestland at the 0–15 cm depth. However, similar values (p > 0.05) were observed among the land-use systems at the 15–30 cm depth. Soil moisture content was significantly greater (p = 0.002) in the oil palm plantation and forestland than in the arable land in the surface soil. The soil textural class was sandy loam in the arable land and loam in both the oil palm plantation and forestland.
Soil pH differed across the land-use systems (Table 2). Lower values (p < 0.001) were recorded in forestland than in arable land and oil palm plantation. At the 0–15 cm depth, SOC content was about 62% greater in the forestland than in the arable land and about 23% greater than in the oil palm plantation. At the 15–30 cm depth, similar amounts of SOC were recorded between the forestland and oil palm plantation, which were significantly (p < 0.001) greater than that of the arable land. The forestland had the greatest (p < 0.001) soil total N content with that of the arable land being the least. In the surface soil, the forestland was about twice greater in soil total N than the arable land with values also 37% greater than that of the palm plantation. Soil available P was > 20 mg kg–1 in the land-use systems and was greater (p < 0.05) in the forestland at both depths than in the oil palm plantation and the arable land. As typical of SSA soils, effective cation exchange capacities (ECEC) observed were very low (< 10 cmol(+) kg−1 soil) in all land-use types.
Soil microbial biomass C, N and P across the land-use systems were greater during the wet season than in the dry season (Table 3). As expected, MBC was relatively greater in the surface soil. In the dry season, the forestland had greater MBC, MBN and MBP (p < 0.05) than the arable land and oil palm plantation. During the wet season, there were 117 and 41% increase in MBC in the forestland over the arable land and the palm plantation, respectively in the surface soil. Similarly, MBN and MBP were greatest (p < 0.05) in the forestland and least in the arable land.
Soil organic carbon stock (SCS) of the land-use systems
The amounts of SOC stored in the various land-use systems to 100 cm depth were estimated (Table 4). The greatest SCS (p < 0.001) was recorded in the forestland at 0–15 cm depth, followed by the oil palm plantation (18.8 Mg ha−1). The arable land had the least SCS (16.4 Mg ha−1). There were no significant differences (p > 0.05) in SCS between the forestland and the oil palm plantation in the 15–30, 30–50 and 50–100 cm depths. However, smaller amounts of SCS (p < 0.05) were recorded in the arable land than in both the forest and oil palm plantation. The total SCS (0–100 cm) observed among the land-use systems was greatest (p < 0.001) in the forestland, which was about 47 and 9% more than that of the arable land and oil palm plantation, respectively.
Soil temperature and moisture variations in the land-use systems
Soil temperature and moisture variations were monitored to determine their effect on soil CO2 emissions throughout the study period (Figs. 1 and 2).

Soil temperature of the land-use systems
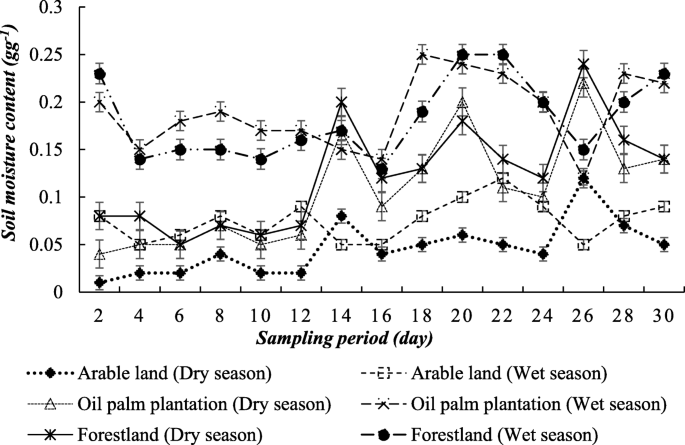
Soil moisture content of the land-use systems
Soil temperature
Temperatures were particularly higher in the arable land than in the forestland in both seasons (Fig. 1). Average soil temperatures during the study period were 36.3, 28.9 and 26.7 °C in the dry season and 28.4, 25.9 and 25.2 °C in the wet season in the arable land, oil palm plantation and forestland, respectively. Similar patterns in temperature variations were observed between the wet and the dry seasons among the land-use systems. In the arable land, soil temperature ranged between 31.2 and 41.3 °C (13th and 5th sampling periods respectively) in the dry season and 25.7 and 30.5 °C (15th and 8th sampling periods respectively) in the wet season. Temperature recorded under the oil palm plantation in the dry season was highest at the 1st sampling period and least during the 11th sampling period. In the wet season, temperature decreased from 27.3 °C during the 1st sampling period to 24.3 °C in the 2nd period and thereafter increased to 26.8 °C in the 3rd period. The fluctuation continued and peaked again at the 8th sampling period (27.8 °C) and declined to 24.3 °C in the last (15th) sampling period. In the forestland, temperatures were highest in the 1st, 5th and 15th sampling periods in the dry season. In the wet season, temperature ranged from 24 °C in the 2nd and 15th sampling periods to 26.9 °C in the 8th sampling period.
Soil moisture
Soil moisture contents were generally lower in the arable land than in the other land-use systems in both seasons (Fig. 2). Average soil moisture contents were 0.04, 0.11 and 0.12 g g−1 in the dry season and 0.07, 0.19 and 0.18 g g−1 in the wet season in the arable land, oil palm plantation and forestland, respectively. During the dry season, soil moisture content peaked at three sampling periods in all land-use systems: 7th, 10th and 13th with 0.08, 0.17 and 0.2 g g−1, 0.06, 0.2 and 0.18 g g−1 and 0.12, 0.22 and 0.24 g g−1 for the arable land, oil palm plantation and forestland, respectively. In the arable land, soil moisture content fluctuated from the 1st sampling period till it peaked at the 11th sampling period (0.12 g g−1), dropped to 0.05 g g−1 at the 13th period and up-surged to 0.09 g g−1 at the last sampling period (15th) in the wet season. Fluctuations in soil moisture contents were also observed from the 1st sampling time till there was a peak at the 9th sampling period in the oil palm plantation and 10th and 11th periods in the forestland. There was a general decrease in moisture content to 0.12 and 0.15 g g−1 at the 13th period and a rise at the last period (15th) in oil palm plantation and forestland, respectively.
Soil CO2 emission from the land-use systems
Figure 3 shows the results of CO2 emitted from the land-use systems in both dry and wet periods of the study. Carbon dioxide emissions were greater in the wet season than in the dry season across the land-use systems. Emissions in the wet season were 3-fold greater in forest and palm plantation and 6-fold greater in the arable land than in the dry season. Average CO2 emissions for arable land, oil palm plantation and forestland were 0.93, 0.63 and 0.5 kg ha−1 h−1 and 3.18, 2.22 and 3.02 kg ha−1 h−1 in the dry and wet seasons, respectively.

CO2 emissions from the land use systems
In the dry season, CO2 emissions were generally greater (p < 0.05) in the arable land followed by the oil palm plantation, while the forestland produced the least emission. At the first sampling period, CO2 emission was significantly (p = 0.01) greatest in the oil palm plantation and least in the forestland. The emission patterns were maintained till the 4th sampling period where significantly greatest CO2 emission was recorded in the arable land with forestland emitting the least. The CO2 emissions increased sharply from the 4th period and peaked at the 7th sampling time in all land-use systems with oil palm plantation producing relatively greater emissions and the arable land, the least. The emissions peaked at the 13th sampling time with the arable land emitting more CO2. The CO2 emissions decreased to 0.97, 0.43 and 0.67 kg ha−1 h−1 at 30 days in the arable land, oil palm plantation and forestland, respectively.
Similarly, the arable land emitted more CO2 in the wet season than the forestland and oil palm plantation. Similar (p > 0.05) amounts of CO2 were emitted from the 1st to the 6th sampling periods among the land-use systems. At the 7th period, the arable land significantly (p = 0.03) emitted the greatest amount of CO2 while the oil palm plantation emitted the least. The emissions fluctuated from the 7th to the 9th periods and then peaked at the 10th sampling period with the forestland emitting significantly the greatest amount of CO2 (p = 0.01). Cumulatively, greater CO2 emissions were recorded in the wet season than the dry season.
Relationships between soil temperature, moisture, SCS and CO2 emissions
Regression and correlation analyses were performed to determine the relationships among soil CO2 production and soil temperature, moisture and SCS in both the dry and wet seasons. There were significant (p < 0.05) correlations between CO2 production and soil temperature, moisture and SCS (Figs. 4, 5 and 6). Soil temperature explained 68.5, 66.7 and 68.2% of total CO2 emitted in the dry season and 62.8, 67.6 and 55.4% in the wet season in the arable land, oil palm plantation and forestland, respectively (Fig. 4a, b). The predictive power of the models, given by R2 for soil moisture and CO2 evolutions were generally low in both seasons (Fig. 5a, b). Nonetheless, positive and significant (p < 0.05) relationships were recorded between soil moisture contents and CO2 emissions in the dry season (a) and in the wet season (b) for the arable land, oil palm plantation and forestland, respectively. Significant (p < 0.05) and positive correlations were recorded between SCS and CO2 production. Soil carbon stock was responsible for 51.7 and 59.9% of CO2 productions in forestland and oil palm plantation respectively, in the dry season. Relationships between CO2 production and SCS were stronger in the dry season than in the wet season in both the oil palm plantation and forestland, but weaker in dry season than the wet season in the arable land (Fig. 6).

Relationships between soil temperature and CO2 production in the land-use systems for both dry (a) and wet (b) seasons

Relationships between soil moisture and CO2 production in the land use systems for both dry (a) and wet (b) seasons

Relationships between SCS and soil CO2 production in the land-use systems for both seasons
Discussion
Soil characteristics in the land-use systems
Soil bulk density is one of the important physical properties, which connects the general structural characteristics of the soil (Chen et al. 2010) and is very relevant in ecosystem studies. Though it is influenced by a number of factors, the lower values observed in the forestland than in the arable land and the palm plantation may be due to the relatively greater SOC (Table 2) and clay contents (Table 1) in the forest system. Soil organic carbon is known to increase soil stability by reducing compaction (Morisada et al. 2004). Apart from the variations in the clay and SOC contents accounting for the differences in soil bulk density among the land-use systems, the higher values of the arable land may also be due to soil disturbance via tillage operations from intensive farming activities (Homann et al. 2004; Agbeshie et al. 2020). Tillage causes soil compaction through increase in soil micro-porosity and reduction in macro-porosity with adverse implications for ecosystem plant productivity.
Soil moisture content was greater in the forestland and oil palm plantation (Table 1) as a result of the closed canopy cover in these land-use systems. This possibly reduced the direct impact of the sun’s rays, thereby reducing evaporation of soil water from these systems. The greater SOC and clay contents of these land-use systems could also account for the observation. Higher SOC levels generally correspond to increase water-holding capacity, soil aggregation and decreased aluminium toxicity (Saiz et al. 2012).
Apart from the forestland, where the SOC and total N contents were moderate (as per the ratings of Boerma et al. 1995 and Council for Scientific and Industrial Research-Soil Research Institute (CSIR–SRI) 2007), the values recorded in the arable land and the palm plantation were low. Vegetation has been identified to have significant impact on soil properties (Wang et al. 2010). This comprises species-specific influence on the quality and amount of leaves and roots litter produced (Talkner et al. 2009; Agboadoh 2011). According to Chen et al. (2000), litter production is a key supplier of SOM in forest biomes, probably accounting for the relatively greater SOC content in the forestland than the other land-use systems (Table 2). Significant changes in soil chemical properties following change in vegetation from natural forest to other land-use systems have been reported (Owusu-Bennoah 1997; Gimeno-Garcia et al. 2000; Wang et al. 2001; Mhawish 2015). Carbon turnover, transformation and microbial biomass are linked to the texture of the soil and these processes are usually connected to the amount of clay (Bauhus et al. 1998). As indicated earlier, greater clay content in both depths was recorded in the forestland than in the other land-use systems (Table 1).
Soil total N is highly related to C content in the soil as it forms part of organic matter. Loss of nitrogen occurs by volatilization and reduction in organic matter when forest vegetation is converted to other land-use systems (Gol and Dengiz 2008; Sigua et al. 2014). This suggests that lands without enough canopy cover are predisposed to high temperatures (especially in tropical climate), which increases rate of organic matter decomposition (Alegre et al. 1988). This may account for the lower total N contents of the arable land than in the forestland and oil palm plantation (Table 2). The forestland had greater soil available P content than the arable land and oil palm plantation as a result of its relatively greater SOC content (Table 2). Organic matter is normally responsible for about 50% of total P in tropical soils (Sanchez 1976). Organic P circulates via the litter between plant and soil, and it is released through decomposition.
Soil microbial biomass is known to encompass the living portion of organic matter. It represents a major labile pool of nutrients in the soil (Sun et al. 2010) and as such, is used as a key indicator for soil fertility in various ecosystems and in different land-use systems (Bastida et al. 2008). One of the major factors, which affect microbial biomass and activities in the soil, is moisture, accounting for the higher soil microbial biomass values observed in the wet season than in the dry season (Table 3). Differences in amount and quality of substrate through different litter and root types drive soil microbial biomass (Wang et al. 2010). Soil microbial biomass has been found to increase when soil organic matter increases and vice versa (Jenkinson 1988; Chen et al. 2005). Apart from greater soil moisture content of the forestland (Table 1), its relatively greater SOC, total N and available P (Table 2) may account for the relatively greater microbial values than in the two land-use systems. These observations were expected as studies have shown that up to 3%, 5% and between 2 and 10% of the total SOC, soil N and soil phosphorous is made up of MBC, MBN and MBP, respectively (Jenkinson and Ladd 1981; Baldwin 2006).
Soil organic carbon stock and carbon emissions
The soil is the largest terrestrial carbon pool (Scharlemann et al. 2014) and plays a key role globally in the C balance by controlling the changing bio-geochemical processes and the exchange of greenhouse gases (GHG) within the atmosphere (Lal 2009). According to Li et al. (2012), land-use and vegetation cover have a major influence on the global C balance through different soil C accumulation and turnover, soil depletion and plant biomass. Soil carbon stock was greater in the 0–15 cm depth than in the 15–30 cm across all land-use systems (Table 4), affirming earlier reports that most of soil carbon is stored in the upper meter layer and especially, in the 0–20 cm depth (Lal 2004; Le Quéré et al. 2015). This notwithstanding, the contribution of deep soil carbon to the global carbon stock cannot be underestimated (Jobbagy and Jackson 2000; Schmidt et al. 2011). Some earlier reports also show that the varying horizontal distribution of SCS depends on large-scale factors such as soil type, vegetation, topography and regional climate (Wang et al. 2010). However, SCS can vary for a specific soil type as a result of the balance of net C inputs to the soil and net losses of C from the soil and is the interplay between soil bulk density and carbon concentration. The greater SCS observed in the forestland than in the oil palm plantation and arable land was due to the low organic inputs in the latter systems. The annual cultivation of the arable land disturbs the soils (Logah et al. 2020) more than the oil palm plantation and the forestland, explaining its comparatively lower SCS. According to Morris et al. (2007), less soil disturbance tends to preserve SCS, and mixed species forests are more resilient and hence, better systems for carbon storage.
Emission of CO2 from the soil surface represents a major component of C cycle in the biosphere as it may account for about three-fourth of total ecosystem respiration (Law et al. 2001). The relatively greater CO2 emissions in the wet season across all land-use systems (Figs. 3 and 4) were a result of higher soil moisture content during the period (Fig. 2). This probably increased the rate of decomposition of soil organic matter (SOM) as moisture is a major driver of soil microbial activity, leading to greater CO2 production (Luo and Zhou 2006). This observation is consistent with the findings of other studies in temperate climate where CO2 flux increases with enhanced microbial activity as a result of an increase in soil moisture content (Sainju et al. 2010). Our results (Table 3) show greater microbial biomass in the wet season, which is an indicator of higher microbial activity than in the dry season. Differences in CO2 emission from the soil may also be partly dependent on soil temperature variations in the land use types (Fig. 1). According to Reichle et al. (1975), microflora accounts for 99% of the CO2 originating from decomposition of SOM, while root respiration contributes up to 50% of total soil respiration (Macfadyen 1970). Microbial respiration is dependent on soil temperature while both microbial and soil respirations are dependent on soil moisture, and hence CO2 evolution (Robinson et al. 2017).
Soil cultivation increases the mineralization of SOM and consequently, the emission of CO2 (Reicosky 2001). Decomposition of SOM is increased when the soil is physically disturbed and breaks down macroaggregates, exposing the protected C in their interiors to microbial processes (Cambardella and Elliott 1992). Continuous cultivation of the arable land coupled with the higher soil temperature recorded in the system (Fig. 1) accounted for its greater emissions of CO2. This was confirmed by the positive and significant correlations between CO2 emission and soil temperature (Figs. 4a, b), with temperature accounting for 68.5, 66.7 and 68.2% of total CO2 production in the dry season and 62.8, 67.6 and 55.4% in the wet season in the arable land, oil palm plantation and forestland, respectively. Positive relationships between soil temperature and CO2 emission have been reported in few earlier studies under various land-use types (Tufekcioglu et al. 2001; Sainju et al. 2010; MacCarthy et al. 2018). Other important factors that influence the production of CO2 include substrate C availability. Positive relationships were observed between CO2 evolution and SCS (Fig. 6), which was more prominent in the dry season in the relatively higher carbon-input systems (forestland and palm plantation) than in the lower carbon-input system (arable land). This is an indication that soil CO2 production is also dependent on C availability and subsequently microbial processes.
Conclusions
Arable land, due to continuous cultivation, stored less carbon and emitted 30–46% more CO2 than forestland and oil palm planation which were less disturbed. Soil carbon stock accounted prominently for CO2 emission in the dry season under the relatively higher carbon-input systems (palm plantation and forestland) than in the low carbon-input system (arable land). Carbon dioxide emissions were greater in the wet season than in the dry season across land-use systems with soil temperature accounting for increased emissions. The study calls for drastic climate change policies to reduce degradation of forest cover and reduction of soil disturbance in agro-ecosystems in SSA and elsewhere.
Availability of data and materials
The datasets used and/or analysed during the current study are available from the corresponding author on reasonable request.
Abbreviations
- ACBI:
-
Africa capacity building initiative
- C:
-
Carbon
- CDM:
-
Clean development mechanism
- CO2 :
-
Carbon dioxide
- DFID:
-
Department for International Development
- GHG:
-
Greenhouse gas
- KNUST:
-
Kwame Nkrumah University of Science and Technology
- MBC:
-
Soil microbial biomass carbon
- MBN:
-
Soil microbial biomass nitrogen
- MBP:
-
Soil microbial biomass phosphorus
- N:
-
Nitrogen
- P:
-
Phosphorus
- REDD+:
-
Reducing emissions from deforestation and forest degradation
- SCS:
-
Soil carbon stock
- SOC:
-
Soil organic carbon
- SOFIIA:
-
Soils of Forest Island in Africa
- SOM:
-
Soil organic matter
- SSA:
-
Sub-Saharan Africa
- UNFCC:
-
United Nations Framework Convention on Climate Change
References
Adu SV (1992) Soils of the Kumasi region, Ashanti region, Ghana. Memoir No. 8. Soil Research Institute, Ghana
Agbeshie AA, Logah V, Opoku A, Tuffour HO, Abubakari A, Quansah C (2020) Mineral nitrogen dynamics in compacted soil under organic amendment. Sci Afr 9:e00488
Agboadoh MDY (2011) Estimation and mapping of soil organic carbon stocks in croplands of the Bechem Forest District. Dissertation, Kwame Nkrumah University of Science and Technology, Kumasi, Ghana, Ghana
Alegre JC, Cassel DK, Bandy DE (1988) Effect of land clearing method on chemical properties of an Ultisol in the Amazon. Soil Sci Soc Am J 52:1283–1288
Amegashie BK (2014) Response of maize grain and stover yields to tillage and different soil fertility management practices in the semi-deciduous forest zone of Ghana. PhD Dissertation, Kwame Nkrumah University of Science and Technology, Kumasi, Ghana
Anderson JM, Ingram JSI (1998) Tropical soil biology and fertility, A handbook of methods, p 1221
Asumadu-Sarkodie S, Owusu PA (2016) The relationship between carbon dioxide and agriculture in Ghana: a comparison of VECM and ARDL model. Environ Sci Pollut Res 23(11):10968–10982
Baldwin KR (2006) Organic production – soil quality considerations for organic farmers. North Carolina Cooperative Extension Service, USA
Bastida F, Zsolnay A, Hernandez T, Garcia C (2008) Past, present and future of soil quality indices: a biological perspective. Geoderma 147:159–171
Bationo A, Kihara J, Vanlauwe B, Waswa B, Kimetu J (2007) Soil organic carbon dynamics, functions and management in West Africa Agro-ecosystems. Agric Syst 94(1):13–25
Bauhus JD, Pare D, Cote L (1998) Effects of tree species, stand age, and soil type on soil microbial biomass and its activity in a southern boreal forest. Soil Biol Biochem 30:1077–1089
Black CA (1986) Methods of soil analysis, Part I. Physical and mineralogical properties, including statistics of measurement and sampling, Part II. Chemical and microbiological properties. Agronomy series, ASA, Madison
Boerma JAK, Luo G, Huang B (1995) People’s Republic of China, reference soils of the Liaohe plain, Liaoning Province. Soil Brief CN 10. In: Institute of Soil Science, Chinese Academy of Sciences, Nangjing, and International Soil Reference and Information Centre, 1995, Wageningen, p 20
Bray RH, Kurtz LT (1945) Determination of total, organic and available forms of phosphorus in soil. Soil Sci 599:39–45
Cambardella CA, Elliott ET (1992) Particulate soil organic matter changes across a grassland cultivation sequence. Soil Sci Soc Am J 56(3):777–783
Chen DD, Zhang SH, Dong SK (2010) Effect of land-use on soil nutrients and microbial biomass of an alpine region on the northeastern Tibetan Plateau, China. Land Degrad Dev 21(5):446–452
Chen GX, Yu KW, Liao LP, Xu GS (2000) Effect of human activities on forest ecosystem: N cycle and soil fertility. Nutr Cycling Agroecosyst 57:45–54
Chen TH, Chiu CY, Tian GL (2005) Seasonal dynamics of soil microbial biomass in coastal sand dune forest. Pedobiologia 49:645–653
Council for Scientific and Industrial Research-Soil Research Institute (CSIR–SRI) (2007) Soil research institute of Council for Scientific and Industrial Research, Ghana. Soil nutrient (mineral) content factsheet, 2007.
Crossno SK, Kalbus LH, Kalbus GE (1996) Determinations of carbon dioxide by titration: new experiments for general, physical and quantitative analysis courses. J Chem Educ 73(2):175–176
Dayamba SD, Djoudi H, Zida M, Sawadogo L, Verchot L (2016) Biodiversity and carbon stocks in different land use types in the Sudanian Zone of Burkina Faso, West Africa. Agric Ecosyst Environ 216:61–72
Department of Environment and Resource Management (DERM) (2011) Climate change: adaptation for Queensland. State of Queensland, Office of Climate Change, Issue Paper Government, Brisbane. Available: http://www.climatechange.qld.gov.au/pdf/climateqreport/climateqreport.pdf. Accessed 15 Feb 2019.
Donovan P (2013) Measuring soil carbon change: a flexible, practical, local method. Available at http://soilCcoalition.org/files/MeasuringSoilCChange.pdf
FAO (2017) Soil Organic Carbon: the hidden potential. Food and Agriculture Organization of the United Nations Rome, Italy
FAO and Intergovernmental Technical Panel on Soils (ITPS) (2015) Status of the World’s Soil Resources (SWSR) –Technical Summary. In: Food and Agriculture Organization of the United Nations and Intergovernmental Technical Panel on Soils, Rome, Italy
Garnaut R (2008) The Garnaut climate change review: final report. Cambridge University Press, Cambridge, p 616
Gimeno-Garcia E, Andreu V, Rubio JL (2000) Change in organic matter, nitrogen, phosphorus and cations in soil as result of fire and water erosion in Mediterranean landscape. Eur J Soil Sci 51:201–210
Gol C, Dengiz O (2008) Effect of modifying land cover and long-term agricultural practices on the soil characteristics in native forest-land. J Environ Biol 29(5):677–682
Homann S, Rischkowsky B, Steinbach J (2004) Herd mobility leads the way for sustainable pastoral development: the case of Borana rangelands, Southern Ethiopia. In: Stuhler EA, Misra M (eds.) Across disciplinary boundaries towards a sustainable life: psychodynamic reflection on human behavior. Ranier Hampp Verlag, Munich, pp 183–196
Hutchinson GL, Mosier AR (1981) Improved soil cover method for field measurement of nitrous-oxide fluxes. Soil Sci Soc Am J 45(2):311–316
Intergovernmental Panel on Climate Change (IPCC) (2007) Summary for Policymakers. In: Solomon S, Qin D, Manning M, Chen Z, Marquis M, Averyt KB, Tignor M, Miller HL (eds) Climate Change 2007: The Physical Science Basis. Contribution of Working Group I to the Fourth Assessment Report of the Intergovernmental Panel on Climate Change. Cambridge University Press, Cambridge and New York
Jenkinson DS (1988) Determination of microbial biomass carbon and nitrogen in soil. In: Wilson JR (ed) Advances in Nitr Cycling Agric Ecosyst, pp 368–386
Jenkinson DS, Ladd LN (1981) Microbial biomass in soil: measurement and turnover. Soil Biol Biochem 5:415–471
Jobbagy EG, Jackson RB (2000) The vertical distribution of soil organic carbon and its relation to climate and vegetation. Ecol Appl 10(2):423–436
Ladd JN, Amato ML, Gestel M (1990) Soil microhabitats and carbon and nitrogen metabolism. In: Proceedings of the 14th International Congress on Soil Science, vol 3, CABI, Kyoto, pp 82–87
Lal R (2004) Soil carbon sequestration to mitigate climate change. Geoderma 123:1–22
Lal R (2009) Agriculture and climate change: an agenda for negotiation in Copenhagen; the potential for carbon sequestration, Vision 2020 for food, agriculture, and the environment. Focus 16, Brief S, pp 1–2
Law B, Kelliher F, Baldocchi D, Anthoni P, Irvine J, Moore D, Van Tuyl S (2001) Spatial and temporal variation in respiration in a young ponderosa pine forest during a summer drought. Agr Forest Meteorol 110(1):27–43
Le Quéré C, Moriarty R, Andrew RM, Peters GP, Ciais P, Friedlingstein P, Jones SD (2015) Global carbon budget 2014. Earth Syst Sci Data 7:47–85
Li DJ, Niu SL, Luo YQ (2012) Global patterns of the dynamics of soil carbon and nitrogen stocks following afforestation: a meta-analysis. New Phytol 195:172–181
Logah V, Ewusi-Mensah N, Tetteh FKM (2011) Soil organic carbon and crop yield under different soil amendments and cropping systems in the semi-deciduous forest zone of Ghana. J. Plant Sci 6(4):165–173
Logah V, Tetteh EN, Adegah EY, Mawunyefia J, Ofosu EA, Asante D (2020) Soil carbon stock and nutrient characteristics of Senna siamea grove in the semi-deciduous forest zone of Ghana. Open Geosci 12:443–451
Luo Y, Zhou X (2006) Soil respiration and the environment. Elsevier, Oxford
MacCarthy SD, Zougmore RB, Akponikpe BPI, Koomson E, Savadogo P, Adiku SGK (2018) Assessment of greenhouse gas emissions from different land-use systems: a case study of CO2 in the southern zone of Ghana. Appl Environ Takimoto Sci 2018:1–12
Macfadyen A (1970) Soil metabolism in relation to ecosystem energy flow and to primary and secondary production. In: Phillipson J (ed) Methods of Study in Soil Ecology. IBP/UNESCO Symposium, Paris, pp 167–172
Mhawish YM (2015) Effect of land-use/cover change on physical and chemical soil properties within an agricultural ecosystem of Ajloun Area-Jordan. Int J Geol Earth Sci 5(2):1–17
Morisada K, Ono K, Kanomata H (2004) Organic carbon stock in forest soils in Japan. Geoderma 119(1-2):21–32
Morris SJ, Bohm S, Haile-Mariam S, Paul EA (2007) Evaluation of carbon accrual in afforested agricultural soils. Global Change Biol 13:1145–1156
Nelson GC (2009) Agriculture and climate change: an agenda for negotiation in Copenhagen, Focus No. 16
Nketia KS, Tutu OP, Asare A (2009) The Forest Dialogue-TFD, Implementing REDD+ in Ghana: contextualization and some challenges. A background Paper for REDD+ Readiness Field Dialogue in Ghana, November 2009
Nkrumah F, Adukpo DC (2014) Rainfall variability over Ghana: model versus rain gauge observation. Geol Atmosphere Sci Public 5:673–683
Opoku-Ankomah Y, Cordery I (1994) Atlantic sea surface temperature and rainfall variability in Ghana. J Climate 7(5):551–558
Owusu-Bennoah E (1997) Environment, biodiversity and agricultural change in West Africa. United Nations University Press, Tokyo – New York – Paris
Reichle DE, McBrayer JF, Ausmus BS (1975) Ecological energetics of decomposer invertebrates in a deciduous forest and total respiration budget. In: J. Vanek (ed.). Progress in Soil Zoology. Junk B. V. Publ., The Hague. pp 283–292
Reicosky DC (2001) Effects of conservation tillage on soil organic carbon dynamics in field experiments in the U.S. Corn Belt. In: Stott DE, Mohtar RH, Steinhardt GC (eds) Sustainable global farm. pp 481–485
Robinson JM, O’Neill TA, Ryburn J, Liang LL, Arcus VL, Schipper LA (2017) Rapid laboratory measurement of the temperature dependence of soil respiration and application to changes in three diverse soils through the year. Biogeochemistry 133(1):101–112
Sainju MU, Stevens BW, Caesar-Ton T, Jabro DJ (2010) Land use and management practices impact on plant biomass carbon and soil carbon dioxide emission. Soil Sci Soc Am J 74:1613–1622
Saiz G, Bird MI, Domingues T, Schrodt F, Schwarz M, Feldpausch TR, Lloyd J (2012) Variation in soil carbon stocks and their determinants across a precipitation gradient in West Africa. Global Change Biol 18(8):2676–2676
Sanchez PA (1976) Properties and management of soils in the tropics. Wiley, New York, p 618
Scharlemann JPW, Edmund VJT, Roland H, Valerie K (2014) Global soil carbon: understanding and managing the largest terrestrial carbon pool. Carbon Manag 5(1):81–91
Schimel DS (1995) Terrestrial ecosystems and the carbon cycle. Global Change Biol 1(1):77–91
Schmidt M, Torn WI, Abiven MS, Dittmar S, Guggenberger T, Janssens G, Kleber IA et al (2011) Persistence of soil organic matter as an ecosystem property. Nature 478(7367):49–56
Sigua GC, Novak J, Watts D, Cantrell K, Shumaker P, Szogi A, Johnson M (2014) Carbon mineralization in two ultisols amended with different sources and particle sizes of biochar. Chemosphere 103:313–321
Smalling EMA, Dixon J (2006) Adding a soil fertility dimension to the global farming systems approach, with cases from Africa. Agric Ecosyst Environ 116(1-2):15–26
Stavi I, Lal R (2013) Agroforestry and biochar to offset climate change: a review. Agron Sustain Dev 33:81–96
Sullivan BW, Kolb TE, Hart SC, Kaye JP, Dore S, Montes-Helu M (2008) Thinning reduces soil carbon dioxide but not methane flux from southwestern USA ponderosa pine forests. Forest Ecol Manag 255(12):4047–4055
Sun B, Hallett PD, Caul S, Daniell TJ, Hopkins DW (2010) Distribution of soil carbon and microbial biomass in arable soils under different tillage regimes. Plant Soil 338:17–25
Takimoto A, Nair PKR, Nair VD (2008) Carbon stock and sequestration potential of traditional and improved agroforestry systems in the West African Sahel. Agricu Ecosyst Environ 125(1–4):159–166
Talkner U, Jansen M, Beese FO (2009) Soil phosphorus status and turnover in Central-European beech forest ecosystems with differing tree species diversity. Eur J Soil Sci 60(3):338–346
Tarnocai C (2009) The impact of climate change on Canadian peatlands. Can Water Resour J 34(4):453–466
Tetteh FM, Issaka RN, Ennin S, Buri MM (2008) Soil fertility initiative, fertilizer update and recommendation trials. Soil Research Institute of Ghana, Kumasi, Ghana, p 33
Tiessen H, Feller C, Sampaio EVSB, Garin P (1998) Carbon sequestration and turnover in semiarid savanna and dry forest. Climatic Change 40(1):105–117
Tufekcioglu A, Raich JW, Isenhart TM, Schultz RC (2001) Soil respiration within riparian buffers and adjacent crop fields. Plant Soil 229(1):117–124
Verchot L, Anitha VK, Romijn E, Herold M, Hergoualc’h K (2012) Emissions factors: converting land use change to CO2 estimates. In: Angelsen A, Brockhaus M, Sunderlin WD, Verchot LV (eds) Analysing REDD+: Challenges and choices. CIFOR, Bogor, pp 261–278
Vermeulen SJ, Campbell BM, Ingram JSI (2012) Climate change and food systems. Annu Rev Environ Resour 37(1):195–222
Wang J, Fu B, Qiu Y, Chen L (2001) Soil nutrients in relation to land use and landscape position in the semi-arid small catchment on the loess plateau in China. J Arid Environ 48(4):537–550
Wang Y, Hsieh YP (2002) Uncertainties and novel prospects in the study of the soil carbon dynamics. Chemosphere 49(8):791–804
Wang ZM, Zang B, Song KS, Liu DW, Ren CY (2010) Spatial variability of soil organic carbon under maize monoculture in the Song-Nen Plain, Northeast China. Pedosphere 20(1):80–89
Yao MK, Angui PKT, Konate S, Tondo JE, Tano Y, Abbadie L, Benest D (2010) Effects of land use types on soil organic and nitrogen dynamics in Mid-West Cote d’Ivoire. Eur J Sci Res 40(2):211–222
Zomer RJ, Trabucco A, Bossio DA, Verchot LV (2008) Climate change mitigation: a spatial analysis of global land suitability for clean development mechanism afforestation and reforestation. Agric Ecosyst Environ 126:67–80
Acknowledgements
We sincerely acknowledge the financial assistance provided by the Royal Society-DFID Africa Capacity Building Initiative (ACBI) through the SOFIIA project at KNUST for which the second author was the Coordinator.
Funding
This work was funded by the Royal Society-DFID through the SOFIIA project at KNUST.
Author information
Authors and Affiliations
Contributions
This work was carried out in collaboration among all authors. Authors JA and VL designed the study, performed the statistical analysis and wrote the first draft of the manuscript and responded to all review comments. Authors VL and AO supervised the work which was part of the MPhil Thesis of author JA. All authors reviewed the pre-submission draft and read and approved the final manuscript.
Corresponding author
Ethics declarations
Ethics approval and consent to participate
Not applicable.
Consent for publication
Not applicable.
Competing interests
The authors declare that they have no competing interests.
Additional information
Publisher’s Note
Springer Nature remains neutral with regard to jurisdictional claims in published maps and institutional affiliations.
Rights and permissions
Open Access This article is licensed under a Creative Commons Attribution 4.0 International License, which permits use, sharing, adaptation, distribution and reproduction in any medium or format, as long as you give appropriate credit to the original author(s) and the source, provide a link to the Creative Commons licence, and indicate if changes were made. The images or other third party material in this article are included in the article's Creative Commons licence, unless indicated otherwise in a credit line to the material. If material is not included in the article's Creative Commons licence and your intended use is not permitted by statutory regulation or exceeds the permitted use, you will need to obtain permission directly from the copyright holder. To view a copy of this licence, visit http://creativecommons.org/licenses/by/4.0/.
About this article

Cite this article
Anokye, J., Logah, V. & Opoku, A. Soil carbon stock and emission: estimates from three land-use systems in Ghana. Ecol Process 10, 11 (2021). https://doi.org/10.1186/s13717-020-00279-w
Received:
Accepted:
Published:
DOI: https://doi.org/10.1186/s13717-020-00279-w