
Abstract
One of the key requirements for technological systems that are used to secure independent housing for seniors in their home environment is monitoring of daily living activities (ADL), their classification, and recognition of routine daily patterns and habits of seniors in Smart Home Care (SHC). To monitor daily living activities, the use of a temperature, CO2, humidity sensors, and microphones are described in experiments in this study. The first part of the paper describes the use of CO2 concentration measurement for detecting and monitoring room´s occupancy in SHC. In second part focuses this paper on the proposal of an implementation of Artificial Neural Network based on the Levenberg–Marquardt algorithm (LMA) for the detection of human presence in a room of SHC with the use of predictive calculation of CO2 concentrations from obtained measurements of temperature (indoor, outdoor) T i, T o and relative air humidity rH. Based on the long-term monitoring (1 month) of operational and technical functions (unregulated, uncontrolled) in an experimental Smart Home (SH), LMA was trained through the data picked up by the sensors of CO2, T and rH with the aim to indirectly predict CO2 leading to the elimination of CO2 sensor from the measurement process. Within the realized experiment, input parameters of the neuronal network and the number of neurons for LMA were optimized on the basis of calculated values of Root Mean Squared Error, the correlative coefficient (R) and the length of the measured training time ANN. With the use of the trained network ANN, we realized a strictly controlled short-term (11 h) experiment without the use of CO2 sensor. Experimental results verified high method accuracy (>95%) within the short-term and long-term experiments for learned ANN (1.6.2015–30.6.2015). For learned ANN (1.2.2014–27.2.2014) was verified worse method accuracy (>60%). The original contribution is a verification of a low-cost method for the detection of human presence in the real operating environment of SHC. In the third part of the paper is described the practical implementation of voice control of operating technical functions by the KNX technology in SHC by means of the in-house developed application HESTIA, intended for both the desktop system version and the mobile version of the Windows 10 operating system for mobile phones. The resultant application can be configured for any building equipped with the KNX bus system. Voice control implementation is an in-house solution, no third-party software is used here. Utilization of the voice communication application in SHC was proven on the experimental basis with the combination of measurement CO2 for ADL monitoring in SHC.
Introduction
Monitoring the activities of daily living (ADLs) and detection of deviations from previous patterns is crucial to assessing the ability of an elderly person to live independently in their community and in early detection of upcoming critical situations. “Aging in place” for an elderly person is one key element in ambient assisted living (AAL) technologies [1]. For recognition [2–15] and classification of ADL [16, 17] are used various mathematical methods such as Hidden Markov Model (HMM), Linear Discriminant Analysis (LDA) and Support Vector Machines (SVM) [18, 6], Artificial Neural Networks (ANN) [11] or adaptive-network-based fuzzy inference system (ANFIS) [19, 20]. For detection of ADL in SHC it is possible to use RFID [21], PIR [22], CO2 [23] sensors or presence sensors, on the basis of which probability models of the people’s behavior in SH [24] can be built, respecting the privacy [25] of SHC residents [26]. One of the ways of performing the ADL is motion detection [27, 28] and falls of seniors [29, 30] which may end tragically in the case of late intervention. Therefore, it is necessary to design such a technology solution system that will allow a range of services including data collection and analysis of long-term trends in behaviors and physiological parameters (e.g. relating to sleep or daily activity); warnings, alarms and reminders; and social interaction [31]. An example might be the technology system AAL [32]. The proposed technology systems need to be based on the real needs of SHC residents [1]. For the comfort and a feeling of safety [33] of the SH residents, sensors are designed to use of advanced mobile devices in diverse scenarios, by developing wearable sensors, and by using numerous sensors embedded in the environment in SHC [34]. For example, Liu investigates the importance of spatiotemporal reasoning and uncertainty reasoning in the design of Smart Homes. Accordingly, a framework for applying a methodology referred as Rule-based Inference Methodology using the Evidential Reasoning in conjunction with Smart Home Framework considering spatiotemporal aspects of ADL is outlined [35]. Noury solved a very interesting way of ADL implementation in SH by detecting the energy consumption of the SH [36]. Another alternative for the effective implementation of ADL monitoring can also be used to the IoT concept within the SH inclusion in the concept of Smart Cities [37].
The objective of the article is to describe and evaluate new approaches to the technical solution for monitoring the presence of persons in individual rooms of intelligent buildings (IB) (SH, SHC) to determine the occupancy of the monitored spaces with the possibility of using the information obtained to determine the ADL by existing technology systems that can be used in the SHC.
The aim of the first part of the article is the use and processing of information from operationally measured non-electrical quantities determining the indoor environment in the SHC using operational technological units for the determination of the ADL in a real-world SHC environment. To obtain an overview of the occupancy of individual rooms of the SHC (time of arrival, time of departure, number of persons), the indirect measurement of CO2 concentration (ppm) with operational CO2 (ppm) sensors is used.
The aim of the second part of the article is to use ANN to predict the measured quantities for the purpose of monitoring the ADL in a real-world SHC environment. It describes the process of using the multilayer forward ANN to predict the course of CO2 concentration from the measured temperature Ti (°C), relative humidity rH (%) in the interior of the SHC in the selected room R104 and from the outdoor temperature readings To (°C), with the gradient algorithm of error backpropagation using the Levenberg–Marquardt (LMA) prediction. For the classification of prediction quality, a correlation analysis (correlation coefficient R), calculated RMSE (Root Mean Squared Error) and Mean Absolute Percentage Error (MAPE) and Bland–Altman method are used.
The third part of the article aims to connect and test the created HESTIA application for visualization and voice control of operational technical features using real-world KNX technology to determine the ADL. As complementary information for more precise determination of activities of SHC inhabitants, the presence of persons in the SHC room is monitored using the CO2 sensor and the prediction of the CO2 course from the measured Ti (°C), the relative humidity rH (%) in the interior of the selected room of the SHC and the measured outdoor temperature To (°C) using the above methods. The applications described below may be used for detecting ADL in the SHC.
Description of the used technologies
The Smart two-floor wooden house (hereafter Smart Home; floor area of: 12.1 m × 8.2 m; (Fig. 1) was built as a training centre of the Moravian-Silesian Wood Cluster (MSWC). The wooden house (SHC) was built to a passive standard in accordance with standards ČSN 75 0540-2 and ČSN 730540-2(2002).

Smart home—wooden house, training center of the Moravian-Silesian wood cluster (MSWC)
Description of the used technologies
For heating, cooling and forced ventilation, BACnet (Building Automation and Controls Network) technology is used in the SHC. Lighting, blinds and mains sockets are controlled by KNX technology, which is interconnected with BACnet (Fig. 2).

Smart Home building—block scheme of the building automation technology part (including communication modules for the building heating technology part and the heat storage technology part)
Visualization and archiving of measured values of non-electric quantities are realized in the master visualization system Desigo Insight, for example measurement of temperature, humidity, CO2 for monitoring and control of the indoor environment of individual rooms of SHC. To perform the evaluation of the measured non-electrical quantities, the values of CO2, temperature (T) and relative humidity (rH) in selected rooms have been chosen and measured by means of air quality sensor QPA 2062. The technical parameters of the sensor are as follows:
-
Temperature indoor T i, (sensor (QPA 2062), (within 0 and 50 °C/−35 to 35 °C, accuracy ±1 K) implemented in BACnet technology) and Temperature outdoor T 0, (sensor AP 257/22, measuring range −30…+80 °C, resolution: 0.1 °C), implemented in KNX technology).
-
Relative humidity (rH) measurement (sensor (QPA 2062), (within 0 and 100%, accuracy ±5%), implemented in BACnet technology),
-
CO2 measurement (sensor (QPA 2062), (within 0 and 2000 ppm, accuracy ±50 ppm, implemented in BACnet technology).
For the actual experiment room R104 was used (Fig. 3) in the SHC.

Ground floor of the SHC with indication of the sensors used for measuring temperature, relative humidity and CO2 in room R104
First part—use of CO2 sensors for determining the presence and occupation of a room in the SHC
Monitoring of ADL or occupancy of the SHC rooms serves to more accurately and efficiently regulate the operational-technical functions in the SHC (reduction of operating costs and energy consumption, comfort of controlling operational technical functions in the SHC and object security) and for indirect monitoring of daily activities of seniors in order to prevent borderline and critical situations (fall of an elderly person, injury, death). In connection with ADL monitoring, carbon dioxide (CO2) concentrations can be used in occupied SHC rooms. The actual measurement of CO2 is primarily performed in order to control the quality of the indoor environment (air) in individual SHC rooms, to ensure hygienic conditions and to control the HVAC in the SHC. Air quality in rooms has a significant impact on personal well-being and people’s attention. Higher CO2 concentrations lead to premature fatigue, while prolonged exposure may lead to headaches or other ailments [38]. The concentration of CO2 is the most common contaminant in indoor building environments. In interiors of buildings there is always higher concentration than outside. The main source of the increase in CO2 concentration in the interior of the IB is above all human. During breathing, oxygen and CO2 are exchanged. CO2 production is in direct proportion to physical activity. The carbon dioxide concentration is given in ppm (parts per million) [39].
From the measured values of CO2 concentration (Fig. 4) in room R104 it is possible to determine the time of arrival or departure of a person to/from the monitored space (Fig. 5). This is based on the assumption that if the CO2 increases then there is a person present (source of CO2). When the person leaves the monitored space, the increase in CO2 concentration:

Measured waveform of CO2 (ppm) in R104 of SHC (1.2.2014–27.2.2014)

Measured waveform of CO2 (ppm) in R104 of SHC (1.2.2014–27.2.2014). (dd.mm.yyyy hh:mm:ss): 1 arrival (5.2.2017 7:42:00), 2 departure (5.2.2017 7:53:00)—closed window, 3 arrival (5.2.2017 8:12:00), 4 departure (5.2.2017 8:22:00)—closed window, between points 5 (5.2.2017 8:34:00) and 6 (5.2.2017 8:43:00) stagnation of CO2 concentration (ppm), 6 arrival (5.2.2017 8:43:00), 7 departure (5.2.2017 8:53:00), 8 arrival (5.2.2017 9:03:00), 9 departure (5.2.2017 9:14:00), 10 arrival (5.2.2017 9:24:00), 11 departure (5.2.2017 9:34:00), 12 arrival (5.2.2017 9:44:00), 13 departure (5.2.2017 9:55:00), 14 arrival (5.2.2017 10:03:00), 15 departure (5.2.2017 10:14:00), 16 (5.2.2017 10:23:00), 17 arrival (5.2.2017 10:35:00), 18 departure (5.2.2017 10:54:00), 19 doors open (5.2.2017 11:04:00), 20 doors close (5.2.2017 11:14:00), 21 arrival (5.2.2017 11:24:00), 22 departure (5.2.2017 11:34:00), 23 doors open (5.2.2017 11:44:00), 24 doors close (5.2.2017 11:54:00) 25 arrival (5.2.2017 12:24:00) 26 departure (5.2.2017 12:35:00)
-
stagnates or remains constant (Fig. 5), points 2–3, 5–6, 7–8, 15–16, 18–19, 20–21, 24–25; i.e. closed windows, doors, no forced ventilation,
-
rapid decrease (Fig. 5), points 19–20, 23–24), open window or doors,
-
gradually (Fig. 5), points 4–5, 9–10, 11–12, closed windows, doors, no forced ventilation.
It is also possible to determine, based on the dispersion of CO2 concentration, the manner of dispersion of CO2 in the space of the room [opening the window, switching on forced ventilation, natural scattering of CO2 (ppm)] (Fig. 6).

Measured waveform of CO2 (ppm) in R104 of SHC (1.2.2014–27.2.2014). (dd.mm.yyyy hh:mm:ss): 1 arrival (6.2.2017 9:14:00), 2 departure (6.2.2017 9:24:00), 3 arrival (6.2.2017 9:34:00), 4 departure (6.2.2017 10:45:00), 5 arrival (6.2.2017 11:15:00), 6 departure (6.2.2017 12:05:00), t1—open doors (6.2.2017 13:16:00–14:07:00), t2 (6.2.2017 14:07:00–8.2. 2017 11:06:00) closed windows and doors, forced ventilation off—natural dispersion of CO2 concentration in the space of room R104
Results first part
The experiments described above (Figs. 4, 5, 6) have shown that CO2 can be used for ADL monitoring, occupancy detection and classification of determination of behaviour of the occupants of the SHC, SH or IB. Information obtained during the measurement of CO2 (ppm) can also be used to determine the indoor environment quality of each space in the SHC, SH or IB.
Discussion
Information about the quality of the internal environment in an IB is provided by temperature sensors (indoor, outdoor) T i, T o (°C) and air humidity sensors rH (%). This information is crucial for the comfort and occupancy of separate rooms of IB. The cost of high-quality temperature and air humidity sensors is approximately in the range of Euro units. The cost of sensors for the measurement of CO2 moves the price a rank higher to several tens of Euro. In the Czech Republic (CR), the emphasis is placed on the utilization of a good thermal insulation for large buildings, which can finally provide certain energy savings. This is realized for big office buildings, schools, hospitals, residential dwellings, family houses and blocks of flats. The internal environment of reconstructed insulated buildings is continuously getting worse with the increase in CO2 concentrations and humidity rH. Many investors in the CR do not take this fact into account. To decrease the concentration of CO2 in a room we can easily open a window and a door, or to use a forced ventilation as the part of a complex solution provided by HVAC technology (Heating, Ventilation and Air Conditioning). Regarding the technology utilization in connection with the automatization of buildings, it is necessary to provide the measurement of CO2 concentration before the implementation of HVAC controlled technology.
Second part—the optimized artificial neural network model with Levenberg–Marquardt algorithm for detecting human presence in SHC
Different types of sensors and technological equipment with regard to robustness, quality, design, capital and operating costs are used to determine the movement, location and time of occurrence of persons for the purpose of indirectly determining the space occupancy of intelligent buildings IB (administrative buildings, schools, hospitals, homes for the elderly, households), and to optimize the management of operational and technical functions in IB (lighting, blinds, HVAC). To detect the movement of people or for monitoring ADL within the building, the PIR motion sensors, presence sensor, GPS sensor or Smart Phones is possible using (Table 1) [40]. For bedridden patients in hospitals, it is possible to use RFID sensors [41] or barcode labels. To obtain additional information on the occupancy of the individual rooms of an IB, the values from the operational sensors measuring the CO2 concentration (ppm) can be measured, which are used to control forced ventilation in the building. Building heating, ventilation, and air conditioning (HVAC) systems are considered to be a prime tool for energy conservation due to their significant contribution to commercial buildings’ energy consumption. For example, Yang evaluates occupancy modeling using twelve ambient sensor variables with results which demonstrate that 20% of gas and 18% of electricity could be saved effectively if occupancy-based demand-response HVAC control is implemented in IB [42]. In energy efficiency analysis, user behavior detection related to the dynamic demands of energy is a critical aspect of supporting the intelligent control scheme of a Building Management System. According to Zhao, occupancy of anomalous user behavior tends to be figured out from multiple time-series records of occupancy [43]. For prediction and subsequent classification of automatic human activity recognition (AR), the regression method of Artifical Neural Networks (ANN), Hidden Markov models [43–45] decision trees method [46], methods using Bayesian networks [47], Conditional Random Fields (CRF) or a sequential Markov Logic Network (MLN) [48] can be used.
Biswas described, that the artificial neural network has emerged as a key method to address the issue of nonlinearity of building energy data and the robust calculation of large and dynamic data [49]. Pantazaras used incorporating CO2 concentration as a factor in predictive models may unlock further optimization opportunities in controller applications, especially in buildings with highly varied occupancy, such as institutional buildings with the results, which suggest that there is indeed potential for at least short-term prediction using a very simple identification procedure [50]. Leung presents an investigation into the use of occupancy space electrical power demand to mimic occupants’ activities in building cooling load prediction by intelligent approach, where the effect of individual behaviour on cooling load demand is less significant at building level than at office level and the proposed cooling demand prediction approach is able to predict daily peak loads satisfactory which would be useful for system dimensioning. [51]. Moon was developed temperature control algorithm to apply a setback temperature predictively for the cooling system of a residential building during occupied periods by residents, where Levenberg-Marquart training method was employed for model training [52]. The purpose of Mba work was to apply the artificial neural network (ANNs) with Levenberg–Marquardt algorithm for an hourly prediction, 24-672 h in advance of (IT) and (IH) in buildings found in hot humid region with results, which testified that ANN can be used for hourly IT and IH prediction [53]. Using the neural network to predict the energy consumption of the building resulted in some shortcomings, which were solved of Dinghao’s proposed model (a new algorithm which combined genetic algorithm with the Levenberg–Marquardt algorithm) for qualified of predict short-term energy consumption in buildings accurately and efficiently [54], [55]. Yuce presents an ANN approach to predict energy consumption and thermal comfort level of an indoor swimming pool with ANN (Levenberg–Marquardt algorithm) based prediction approach for a specific HVAC system [56].
Based on the above-described scientific works, it was selected ANN with the Levenberg–Marquardt algorithm for prediction of measured waveform CO2 from measured temperature and relative humidity waveforms.
Preparation of experimental data
Within experiments, we used the BACnet technology (Building Automation and Controls Network) for the operational control of HVAC in SHC. To determine the occupancy of each room (coming time, time of leaving, the number of people) in SHC, are in this article uses indirect measurements of CO2 concentration (ppm) using operational sensors CO2 (ppm) [(sensor QPA 2062), (within 0 and 2.000 ppm, accuracy ±50 ppm)] In this part of the article is described how to determine the appropriate method of prediction of the CO2 concentration from the measured values of the indoor temperature T (°C) in a SHC room [(sensor QPA 2062) (within 0 and 50 °C/−35 to 35 °C, accuracy ±1 K)], indoor rH (%) [(sensor QPA 2062), (within 0 and 100%, accuracy ±5%)] and outdoor temperature T (°C) ((sensor AP 257/22, measuring range −30…+80 °C, resolution: 0.1 °C), the sensor is implemented in KNX technology) using the gradient algorithm of the back-propagation of error for the adaptation of the multilayer feedforward ANN using prediction—the LMA method [57, 58], (Fig. 7).

The architecture of designed ANN
For the actual experiments the measured values of Ti, T0, rH and CO2 in room R104 in the period 1.2.2014–27.2.2014 (transition winter–spring) and 1.6.2015–30.6.2015 (transition spring–summer) were used:
Training and test dataset
The goal of testing is to verify whether the results achieved from the training data can be verified in the future for other input data files. The training set is created directly from the measured values of temperature Ti (°C), relative humidity rH (%) in room R104 and outdoor temperature To (°C). The output (target) dataset is created by the measured values of CO2 (ppm). The measured values in February 2014 and June 2015 were selected. For February 2014 this represented 38,880 samples with the following distribution:
-
Training—70%, 27,216 samples, which are presented to the network during training, and the network is adjusted according to its error.
-
Validation—15%, 5832 samples, which are used to measure network generalization, and to halt training when generalization stops improving.
-
Testing—15%, 5832 samples, which have no effect on training and so provide an independent measure of network performance during and after training.
For June 2015 this represented 41,760 samples with the following distribution:
-
Training—70%, 29,232 samples.
-
Validation—15%, 6264 samples.
-
Testing—15%, 6264 samples.
The data is sampled in 1 min intervals. Before the actual learning, the training dataset was normalized using the min–max method.
where min(x 1··· x i ) is the smallest value in the set (x 1··· x i ) and max(x 1··· x i ) is the largest value in the set (x 1··· x i ).
The min–max method was used to eliminate possible errors during ANN LMA training. After training the neural network and simulation with training or test data, the output from the neural network had to be denormalized according to the original range of the training input values. The ANN training process is illustrated in Fig. 8. Figure 9 shows the process of measuring and processing data in connection with the BACnet technology used in the SHC.

Block diagram of the ANN learning process in training mode

Simplified block scheme of utilized technology in SHC with prediction of CO2
For the actual testing, normalized measured data was used for precisely defined time intervals of short experiments per 1000 samples from days:
-
16.6.2015 (6:40–23:18),
-
18.2.2014 (7:00–23:40),
-
7.2.2017 (12:29)–8.2.2017 (5:09).
The test set is created directly from the measured values of temperature Ti (°C), relative humidity rH (%) in room R104 and outdoor temperature To (°C). The output (target) dataset is created by the measured values of CO2 (ppm). The data was tested on trained ANN (1.6.2015–30.6.2015) and ANN (1.2.2014–27.2.2014). That means that for the ANN LMA trained on measured values from June 2015 (Table 2) the test data was the measured values in the period 16.6.2015 (6:40–23:20), (Table 6), and for the ANN LMA trained on measured values from February 2014 (Table 4) the test data was the measured values in the period 18.2.2014 (7:00–23:40), (Table 7).
Choice of diagnostic tools, their application and evaluation
The quality of diagnostic tools that are presented by Artificial Intelligence methods can be specified by many different requirements. Quality is usually measured using mean squared error (MSE), mean absolute percentage error (MAPE), and root mean squared error (RMSE). The mean squared error (MSE) is given by the equation:
where n is the number of measurements, y i represents the measured data (responses) of a real system and y i* is the model response.
The average absolute percentage error (MAPE) is calculated from relation
The root mean squared error (RMSE) is calculated from relation
The force of (linear) dependence between two measured non-electrical quantities has been evaluated by means of the value of the Pearson´s correlation coefficient
The correlation coefficient \(R_{x,y}\) can take values from the closed interval 〈−1, +1〉. The more the absolute value of the correlation coefficient approaches 1, the stronger the dependence of the random quantities is.
Backpropagation algorithm
The backpropagation algorithm is a gradient algorithm with which multilayer forward networks are adapted. Backpropagation is like a teacher’s instruction when the calculated output of the network is compared to the desired output. Subsequently, with the backward propagation of the signal, the weights are adjusted so that the net responds with the desired output to the pattern. It has been shown that such networks are able to approximate any continuous function with the required accuracy and therefore have a wide use, for example, for regression analysis [59]. In general, backpropagation is the most widely used algorithm in the field of neural networks in general. It is used in approximately 80–90% of applications [60]. The backpropagation optimization process is used for forward neural networks with hidden layers and is designed to classify data that is generally not linearly separable [61].
The learning process (Fig. 8) of backpropagation can be divided into four main parts [88]:
-
1.
Initialization: All weights in the network are set to random values within the recommended range 〈−0.3; 0.3〉.
-
2.
Pattern introduction: A pattern from the training set is selected and presented to the input of the neuron network. The output of the individual neurons is then calculated by the layers from the input to the network outputs.
-
3.
Comparison: In this step the energy is calculated from the equation
$$E = \frac{1}{2}\mathop \sum \limits_{i = 1}^{n} \left( {y_{i} - d_{i} } \right)^{2} ,$$(6)which is to be minimized by the gradient method. The increment vector is calculated from the equation
$$\Delta \bar{w} = - \lambda \cdot \nabla {\text{E}} .$$(7)The increment vector is valid for all weights in the ANN. The weights are adjusted by a λ multiple of a negative gradient value because the gradient is oriented towards the apex (to the maximum).
-
4.
Error backpropagation and weight modification (in hidden layers): Weights and thresholds in hidden layers are calculated in a similar way to the output layer weights. The error backpropagation and weight modification step is calculated for all hidden layers of the neural network away from the output layer to the input layer. In addition to the basic replication algorithm, there are a number of modifications that modify the weight and threshold values of the neurons in different ways. Algorithms can be divided into two groups. The first group includes algorithms that use variability of momentum or learning step, while the second group is based on standard optimization techniques such as Newton’s method, Gauss–Newton method, Levenberg–Marquardt method and others.
Levenberg–Marquardt algorithm (LMA)
LMA algorithm was designed to approach second-order training speed without having to compute the Hessian matrix. When the performance function has the form of a sum of squares (as is typical in training feedforward networks), then the Hessian matrix can be approximated as and the gradient can be computed as where is the Jacobian matrix that contains first derivatives of the network errors with respect to the weights and biases, and e is a vector of network errors. The Jacobian matrix can be computed through a standard backpropagation technique that is much less complex than computing the Hessian matrix. The Levenberg–Marquardt algorithm uses this approximation to the Hessian matrix in the following Newton-like update: when the scalar λ is zero, this is just Newton’s method, using the approximate Hessian matrix. When λ is large, this becomes gradient descent with a small step size. Newton’s method is faster and more accurate near an error minimum, so the aim is to shift towards Newton’s method as quickly as possible. Thus, λ is decreased after each successful step (reduction in performance function) and is increased only when a tentative step would increase the performance function. In this way, the performance function will always be reduced at each iteration of the algorithm [62].
The LMA adaptively changes when the parameter upgrades between the gradient descent updating and the Gauss–Newton updating,
where the small values of the algorithmic parameter λ cause a Gauss–Newton updating and the large values of the algorithmic parameter λ cause a gradient descent updating. The parameter λ is initiated to be large so that the first updates represent small steps in the steepest descent direction. If any iteration results in a worse approximation \((x^{2} (p + h_{lm} ) > x^{2} (p))\), then λ is increased. In other words, as the solution improves, λ is decreased, the LMA method approaches the Gauss–Newton method, and the solution distinctively speeds up to the local minimum. In Marquardt´s updated relationship [57]:
The values of λ are normalized to the values of JT. The Levenberg–Marquardt’s algorithm was implemented in the MATLAB function.
Implementation of the practical part
Practical procedure of ANN implementation and learning along with the verification of the learned ANN LMA on test data is performed in the following steps:
-
1.
Step—measurement of non-electrical quantities Ti, T 0, rH and CO2 in room R104 in the period 1.2.2014–27.2.2014 (transition winter–spring), 1.6.2015–30.6.2015 (transition spring–summer), 7.2.2015 using sensors connected to the BACnet technology in the SHC.
-
2.
Data preprocessing–normalization.
-
3.
Design of the prediction system.
-
4.
Implementation of ANN, LMA.
-
5.
Training of ANN, LMA for neuron counts in the range 10–700, measurement of time t(s) of ANN learning, calculation of MSE and correlation coefficient R.
-
6.
Prediction of test data–generalization.
-
7.
Graphic view of results.
-
8.
Calculation of RMSE, MAPE, correlation coefficient R.
-
9.
Evaluation of achieved results.
Results with ANN (1.6.2015–30.6. 2015)
To objectively assess the prediction quality (criterion for the LMA optimization), we used parameters of RMSE (Room Mean Square Error) and correlative coefficients (R). We continually configured the LMA values regarding numbers of neurons N from 10 to 700. We also assessed the time necessary for N to learn to cooperate with LMA algorithm. The minimum value of MSE = 2.176 × 10⁻⁴ was calculated for ANN with the LMA where the configured number of neurons was 600 and the learning time was 1:20:51 (Table 2).
The learning time of ANN LMA is not directly proportional to the number of configured neurons. For the network of ANN LMA with 600 neurons, we carried out a prediction of CO2 based on the measured temperature T i, T o and relative air humidity rH obtained from June 1, 2015 to 30 June 2015. Figure 10 shows the period (14 days) from 4 June 2015 to 18 June 2015 to clarify the discussed issue.

Long-term experiment. A The measurement of CO2 concentration in a room of SHC—ZOOM (1 coming, 2 leaving, 3 coming, 4 leaving, 5 coming, 6 leaving, 7 coming, 8 leaving), B prediction error during transient phase—coming of a subject into SHC, C coming of a subject into the room of SHC, D prediction error during the transient phase—coming of a subject into SHC, E leaving of a subject from a room of SHC, F coming of a subject into a room of SHC, G leaving of subjects from a room of SHC, H coming, I leaving). Figure 12 shows the prediction and measured concentration of CO2 (ppm) within the short-term experiment (16 June 2015)
Within the realized experiment, optimal input parameters ANN for the number of neurons (600) of LMA were found on the basis of MSE parameters (2.176 × 10⁻⁴), R-taining (0.967) and training time t (1:20: 51), (Table 2).
With the use of a trained network ANN, we carried out strictly controlled short-term experiment (7 h), (Fig. 11), without the use of CO2 sensor (according to a prepared scenario) under the following conditions that had to be fulfilled: SHC in a passive standard, closed windows and doors during t 1 time period, switched off air-conditioning and heating, precisely defined coming and presence in the room t 1(s) and leaving t 3(s) of subjects, etc. (Fig. 11).

Short-term experiment. t 1(s)—time of subjects’ stay in a particular room of SHC, t 2(s)—time of the measurement of CO2 concentration in a particular room of SHC, t 3(s)—time without a presence of subjects in a room—dispersion of CO2 concentration in a room of SHC with a closed window and switched off forced ventilation, A the transient phase of a prediction at the moment of subject´s coming into a room of SHC, B the transient phase of a prediction at the moment of subjects´ leaving from a room of SHC, C dispersion of CO2 when a room is empty. Table 2 shows calculated values of RMSE parameters and R Training and measured time of learning ANN for a configured number of neurons ANN LMA for the time period 1 June to 30 June 2015
In order to compare the differences between the reference and predicted signal, the Bland–Altman plot was utilized [63]. The differences between the predicted signal and the reference traces, x1 – x2, are plotted against the average, (x1 + x2)/2. The reproducibility is considered to be good if 95% of the results lie within a ±1.96 SD (standard deviation) range.
Figure 12 shows the Bland–Altman graph for the verification of prediction quality ANN LMA (600) neurons in the long-term experiment (Fig. 10), (4 June 2015–18 June 2015). For the entire data set, 98.06% of the values lie within the ±1.96 SD range for the determination of human detection.

The Bland–Altman graph—the long-term experiment
The result of the Bland–Altman graph in Fig. 13 shows a higher number of outlying measurements in intervals from 600 to 800 (ppm) and partially in the interval from 1300 to 1400 (ppm), which is caused by changes (transient phases) within predictions in connection with the coming and leaving of a subject into a room of SHC. The majority of values are shown in the interval from 500 to 600 (ppm), which demonstrates the absence of subjects in a monitored space. Figure 13 shows the Bland–Altman graph for the verification of prediction quality of ANN LMA (600) neurons in the short-term experiment (Fig. 11), (16 June 2015). For the entire data set, 96.00% of the values lie within the ±1.96 SD range for the determination of human detection.

The Bland–Altman graph—the short-term experiment
Results with ANN (1.2.2014–27.2. 2014)
Table 3 shows the calculated values of MAPE, RMSE and R for predicted courses of CO2 on trained ANN LMA (1.6.2015–30.6.2015) for neuron counts in range 10–700. Comparison with Table 2 confirms that the best calculated parameters MAPE (81.52%), RMSE (0.0165), R coefficient (0.96), (Table 3) for predicted courses of CO2 are for trained ANN LMA with 600 neurons.
Table 4 shows the measured and calculated values of MSE, correlation coefficient R, time t(s) of learning process of ANN LMA (for neuron counts in the range 10–700) for measured values Ti, T 0, rH and CO2 in room R104 of the SHC in the period 1.2.2014–27.2.2014. ANN LMA exhibited the best learning parameters for 500 neurons (MSE = 6.188.10–4, R = 0.950).
Table 5 shows the calculated values of MAPE, RMSE and R for predicted courses of CO2 on trained ANN LMA (1.6.2015–30.6.2015) for neuron counts in range 10–700. Comparison with Table 4 confirmed that the best calculated parameters of MAPE (70.89%), RMSE (0.025), R coefficient (0.95), (Table 5) for predicted courses of CO2 are for trained ANN LMA with 500 neurons.
Results—testing of ANN LMA
For trained ANN LMA in the period 1.6.2015–30.6.2015 (Table 2) we used the measured data in the period 16.6.2015 (6:40–23:18), (1000 samples) for testing within a short experiment. The results are in Table 6.
Comparison with Table 2 shows that for calculated parameters RMSE (0.02), R coefficient (0.93), (Table 6) for predicted courses of CO2 are the best for trained ANN LMA (in the period 1.6.2015–30.6.2015) with 500 neurons.
For trained ANN LMA in the period 1.2.2014–27.2.2014 (Table 3) we used the measured data in the period 18.2.2014 (7:00–23:40), (1000 samples) for testing within a short experiment. The results are in Table 7.
Comparison with Table 4 shows that for calculated parameters RMSE (0.049), R coefficient (0.67), (Table 7) for predicted courses of CO2 are the best for trained ANN LMA (in the period 1.2.2014–27.2.2014) with 300 neurons.
Discussion
The second part of the paper describes and experimentally documents the procedure for the use of a multilayer forward ANN to predict the course of CO2 concentration from the measured Ti (°C), relative humidity rH (%) in the interior of the selected room R104 of the SHC and from the outdoor temperature To (°C), with the gradient error propagation algorithm using the Levenberg–Marquardt predictive method (LMA). For the classification of prediction quality, a correlation analysis (correlation coefficient R), calculated RMSE (Root Mean Square Error) and MAPE (Mean Absolute Percent Error) and Black-Altman method were used. The best results were achieved by ANN LMA trained on the measured values in the period 1.6.2015–30.6.2015. The achieved results approached R >95% for 600 neurons (Tables 2, 3), or during the actual test R = 0.93 for 500 neurons (Table 6). ANN LMA, trained for measured values in the period (1.2.2015–27.2.2015), achieved comparable results (R = 0.95) for the number of neurons 500 (Tables 4, 5). The results of prediction testing of ANN LMA (1.2.2015–27.2.2015) however, were not as successful (R = 0.67) for 300 neurons (Table 7).
Third part—implementation voice communication in SHC with KNX technology
For voice communication with the control system aimed at control of operating technical functions and electric appliances [64, 65, 66, 67–69] in SHC and in intelligent buildings, it is necessary to provide for an application with a visualization platform employing the existing high-quality speech command recognizer with high efficiency of recognition in the real SHC environment with additive noise, which can be used to support the independent living of seniors in their home environment. Brooks confirmed that user—centered design and the use of technology—Smart furniture with voice interaction, which can be used to enhance daily living [70]. Hamill describes the development and testing of an automated, hands-free, dialogue-based speech recognition interface for personal emergency response systems—PERS prototype with the mounted microphone array, an open-source automatic speech recognition engine, and a ‘yes’ and ‘no’ response dialog modeled after an existing call center protocol [71]. Hossain proposes smart home health care system for the realization of smart cities to full fill the needs of elderly people, where a patient’s condition is monitored by using multimodal inputs, specifically, speech and video. Video cameras and microphones are installed in the SHC; these sensors constantly capture video and speech of the patient and transmit them to a dedicated cloud [72]. Johnson in the study, where was described older adults’ perceptions and reactions to SHC technologies/applications at the Gator-Tech SHC has followed results: Overall, most participants responded favorably toward the smart door and voice activation than any other smart technology/application [73]. Portet was aiming at testing the four important aspects in SHC: voice control, communication with the outside world, domotics system interruption human activity and electronic agenda. Portet said that voice interface seemed to have great potential to ease the daily life of the elderly and weak people and would be better received than the more intrusive solution [74]. Tang was describing how they implemented augmented reality of voice control & web server to control SHC and electrical appliances for elderlies and disabled [75]. Vanus designed [76] and tested [77] the voice communication with the control system in SHC. Zhuang et al. [78] described a fall detection system to distinguish noise coming from falls from other noise in the smart home environment. In their system, they only use a far-field microphone to identify various sounds. Then a Gaussian Mixture Models (GMM) Super vector is used to model each fall or noise segment by applying Euclidean distance to measure the pairwise difference between audio segments. A Support Vector Machine built on a GMM Super vector kernel is used to classify audio segments into falls and various types of noise [79].
In this part of the paper is described the practical implementation of the newly developed visualization desktop application HESTIA, type Universal Windows Platform (UWP), for Windows 10 implemented on the wooden house (SHC) at VŠB-TU Ostrava for voice control of operating technical functions by means of the KNX technology with detection of occupancy of the room R104 using CO2 sensor.
Implementation of the created HESTIA visualization application
The practical implementation is dedicated to the implementation of own created application Hestia 10 which allows the voice control of operating and technical functions in the SHC fitted with KNX bus system. The application supports voice control and a few settings of the user environment. Universal Windows Platform technology and C# programming language were selected to develop the application. The implementation was based on the MVVM (Model, View a ViewModel) architectural pattern which is briefly described below.
HESTIA application description
Application Hestia consists of several screens. For users, the most important screen is that with controls; this screen contains a list of rooms and visualizes individual pre-configured devices/appliances. The controls are depicted based on the configuration screen. In the case of lighting, the lights can be switched on and off. It is also possible to change their brightness using buttons for dimming. As for furnishings of sunblind type, the screen depicts a control which may include several functions. Another important screen serves for setting the application. Here, the users can adjust some application parameters in order to adapt it to their individual needs. It is possible to set the language (Czech or English). Furthermore, the users can choose from two color schemes, light and dark. The last setting allows them to change the font size; this facilitates the work with the application mostly for seniors. There are three font sizes to choose from—small, medium and large. A prerequisite for the proper functioning of the application is configuration. It runs on a separate screen which can be accessed from the application settings. For the purpose of better clarity, a list of rooms in the building is created in the first instance. A list of devices for each room is created afterwards. When creating devices, it is necessary to select the device type and enter at least one group address of some of the possible functions. Configuration should be performed by a person familiar with the KNX bus system and specific bus programming. It is necessary to know group addresses and device types occurring in the topology (Fig. 14).

Group addresses created in the ETS 5 SW tool for parameterization of the individual KNX modules
Without this knowledge, it is not possible to provide control functionality. The application consists of several components (Fig. 15); the basic components are Hestia.View, Hestia.Model and Hestia.ViewModel, forming the frame of the MVVM architectural pattern.

Diagram of components
This is described hereinafter. Another component is KNXLib.Portable. It is a freely available library for communication with the KNX bus. Hestia.Speech provides voice recognition logic and passes the information further in the application. Hestia. Common is a shared component that contains global variables and methods used across the application.
Voice control
For speech recognition, the SW tool of Microsoft Speech Platform SDK 11 is employed. The voice recognition function consists in the conversion of the input sound track to a text by the Speech Recognition Engine. The sound input is divided into segments processed as a speech signal and subsequently converted to digital form. The input data adapted in this manner is further evaluated by means of three databases—(a) Acoustic model, (b) Lexicon, and (c) Language model. The acoustic model, representing the acoustic language expression, can be adapted to recognize specific speech traits of the individual users. The lexicon contains a large number of words in the given language, providing information on their pronunciation. The language model provides information on the ways in which words can be combined. The sequence diagram in Fig. 16 describes a situation where the user vocally enters a group address in the configuration tool.

Sequence diagram describing processing of a voice command
Description of voice control implementation in SHC
For the implementation of voice control in SHC at VŠB–Technical University of Ostrava, where KNX and BACnet technologies are used to control the operating and technical functions, while interoperability between technologies is ensured. To control lighting, blinds, and sockets, KNX modules are used (Fig. 17).

Switchboard with the KNX technology components connected to the HESTIA application created for voice control of operating-technical functions in SHC
For communication with the KNX bus, it is necessary to connect KNXnet/IP router to the bus; the router allows sending information between the device and the bus using the IP protocol. In the case of wireless communication, the KNXnet/IP router must be connected to a wireless router and the device (computer, mobile phone) used for requesting the communication with the bus must be connected to the same network as the KNXnet/IP router (Fig. 18).

Principle block diagram of interconnection of the individual KNX bus modules ready for voice control by means of the HESTIA SW application created
Adaptation to smartphone
The HESTIA visualization application created for Windows 10 shares a common code. The application with a PC-connected microphone is not suitable for the speaker’s mobility within SHC. Therefore, the user interface must be adapted to be displayed on various devices (mobile appliances). This can be achieved by using the VisualStateManager class. The screen of the mobile device used to control the building is composed on the left part with a list of rooms and the right part with details of the individual rooms including the device list. If the width of a window with the running application is reduced to under 720 pixels, only a room list is displayed; after clicking on a specific room, the user is redirected to a new screen with the room details. This functionality is implemented by the VisualStateManager element defined in ControlView.xaml. Two states are created in it by means of the VisualState element—the default and reduced states. By means of the AdaptiveTrigger element, conditions of using the individual states can be defined; by means of the Setter element, it is possible to change the values of existing elements and their attributes in the XAML file. VisualStateManager (Listing 1) can respond to a change both in the width and in the height.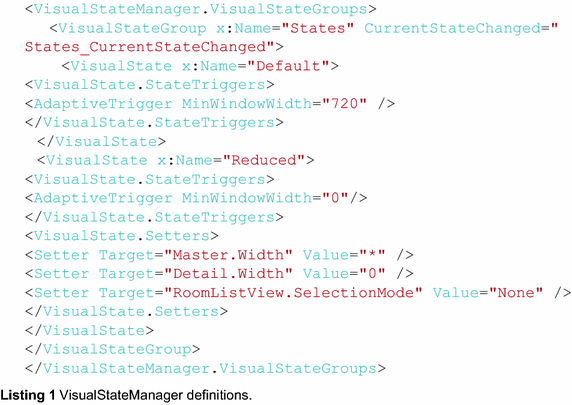
Therefore, it is possible to use in the AdaptiveTrigger element either the MinWindowWidth or MinWindowHeight element. For a window width over 720 pixels, the screen appearance changes according to the attributes set in the VisualState element called Default. For a window width of 0–720 pixels, on the contrary, in the VisualState element called Reduced. If the application is displayed in a device with a width lower than 720 pixels or if the application window has been reduced, the width of the left part of the screen with the room listing is set to the full window width. By contrast, the width of the right part with the room detail listing the devices is set to zero value, thus not being displayed at all. If a room is selected at full display, that is, over 720 pixels, no room listing is displayed if the window is reduced, but the details of the room selected. In this case, it is necessary to change the currently displayed ControlView in the ControlDetailView directly. This must be programmed explicitly, which can be achieved from code-behind upon call of the CurrentStateChanged event. This can be called if the conditions of an adaptive trigger are met.
Testing the visualization part of the HESTIA application
The application was tested on the wooden house in Room 104 of SHC. The KNX technology is used here to control lighting and blinds, and switch off the power supply of sockets. During the test of the control of operating-technical functions on the wooden house at VŠB-TU Ostrava, the functions of switching on/off the lighting and dimming were tested. For control of the blinds, the control of the upward/downward movement of the blinds, movement of the blinds to a certain height and change in the inclination of the blind slats were tested. In the case of testing the lighting switch-on/off, the Boolean values of true/false were sent to the group address of the KNX switching actuator. Sending these values can be activated by pushing the on/off button on the control screen. These buttons are available at the display of a room containing a device with a group address entered for this function. When the on button was pushed, a telegram with the target group address and the true value was sent to the bus. Overhearing the telegram, the actuator with this group address switched on the corresponding light in the SHC room. Switch-off of the lights was tested similarly; the false value was sent to the bus, whereupon the light went out. For the dimming function (designated as dimming object in ETS), the control elements include buttons marked minus (−) and plus (+). If the plus button is pushed, a positive predefined value is sent to the bus and the lighting brightness increases in SHC. If the minus button is pushed, a negative predefined value is sent to the dimming actuator group address, whereupon the lighting brightness decreases. In the case of verification of the upward/downward movement of the blinds (designated as movement object for manual mode in ETS), the buttons for upward or downward movement were pushed in the control application section. The same actions occurred on the bus as in the case of switching the lights on/off. If the blinds are moved to a certain height (designated as height position in manual mode in ETS) or inclination of the slats is adjusted (designated as slat in manual mode in ETS), a value within the range of 0–100% is entered in the application. This value is converted to a number within the interval of 0–255; subsequently, this data is sent to the address configured for the given function. All of the control functions provided by the application were tested with one hundred per cent reliability.
Voice control testing
For correct recognition of the voice command, the distance from the microphone was important, as well as silence in the room and correct pronunciation of English terms. The list of the speech commands used for control of the HESTIA SW application is as follows (Fig. 19): “Go to control page”, “Select room 0–9”, “Select device 0–9”, “Light on”, “Light off”, “Blind up”, “Blind down”, “Change blind height”, “Write height value 0–100”. During application testing, influence of the additive noise in the real environment took effect in SHC. The results indicated below of the efficiency of recognition of voice commands (Fig. 19) fall within the range from 71 to 95%.

Graph of efficiency of recognition of voice commands in SHC
The sources of additive noise in SHC include electric appliances commonly used in the household, such as radio, TV set, refrigerator, fume hood, vacuum cleaners, noise from the fan, air conditioning, etc., as well as cooking, children’s noise, flushing of toilets, door slamming, people talking, outdoor traffic noise in the town, etc. At present, scientific workplaces worldwide are trying to solve the implementation of suitable platforms for voice control of automation in the real environment of intelligent buildings [80–83] with the use of suitable methods of additive noise suppression in the real SHC environment. The actual design and solution by the authors of additive noise suppression in the real SHC environment by the implementation of adaptive algorithms and Soft Computing methods in conformity with the block diagram in Fig. 18 are indicated in publications [84–87, 23].
Experimental part
In the last part of the paper, an experiment is conducted to determine indirect detection of the presence of persons in the monitored area of the SHC (room R104) by measuring the concentration of CO2 in the monitored area of R104 of the SHC in combination with a microphone for voice control of operational–technical functions in the SHC using the HESTIA visual desktop application on 7.2.2017 from 12:30 to 15:00. Arrival in the room was recorded on 7.2.2017 at 12:45:00 on the basis of an increase in CO2 concentration (Fig. 20). Departure from the room was recorded at 14:22:00 on the basis of evaluation of a decrease in CO2 concentration (Fig. 20).

The course of the measured values of CO2 (ppm) in room R104 during the test of voice-controlled operational–technical functions (blinds, lighting)
Figure 21 shows the course of the measured values of rH and T in the interior of R104.

The course of the measured values of rH (%) and T (°C) in room R 104 during the test of voice-controlled operational–technical functions (blinds, lighting)
Figure 22 shows the course of predicted values of CO2 with ANN LMA. From the predicted course of CO2, it is possible to determine arrival in the room (7.2.2017 at 12:45:00) based on an increase in concentration of the predicted course of CO2. Departure from the room was recorded at 14:22:00 on the basis of evaluation of a decrease in CO2 concentration (Fig. 20).

The course of predicted values of CO2 (ppm) with ANN LMA in room R104
Figure 23 shows controlling of blinds with voice commands in room R104 (Figs. 3, 17) with indicated and confirmed times of arrival and departure in/from room R104.

The course of the monitored positions of slats and blinds based on the execution of voice commands (blinds up/down) in room R 104 SB slats position, BP blinds position
Figure 24 shows controlling of lighting with voice commands in room R104 (Figs. 3, 17) with indicated and confirmed times of arrival and departure in/from room R104.

The course of the monitored states of lights based on the execution of voice commands (lights on/off) in room R 104
Discussion
For detecting the ADL of SHC residents, the microphone for detection speech activity and SW Tool HESTIA for the recognition of voice commands in combination with CO2, temperature and humidity sensors to detect the presence of people in the SHC monitored area has been used in this article part. Furthermore, for detecting ADL, the article describes the experimental application of speech control of operating and technical functions in SHC with support to indirect monitoring of the presence of people in the area of SHC using CO2 prediction from the measured values of temperature and humidity within the operating measuring of the quality of the indoor environment.
Conclusions
The paper describes new approaches to the technical solution for monitoring the presence of persons in the selected room R104 of the SHC to determine the occupancy of the monitored spaces with the possibility of using the obtained information to determine the ADL using existing technological systems that can be employed in the SHC.
The first part of the paper demonstrates the possibility of use of indirect measurement of CO2 concentration (ppm) with operational CO2 sensors (ppm) to obtain a view of occupancy of R 104 in the SHC (time of arrival, departure, number of persons).
In second part of the paper are described the short-term and long-term experiments verifying a proposed method of LMA implementation for the detection of human presence in a room of SHC with the use of prediction of CO2 concentration from the measured temperature Ti, To and relative air humidity rH for ANN trained with LMA for 600 neurons with a high degree of correlative coefficient R = 0.967 (Table 2). Experiment verified the utilization of a method for the detection of a presence of subjects in rooms of SHC for ADL monitoring. With regard to the short-term and long-term experiments (closed windows, switched off forced ventilation, switched off heating, etc.), the proposed method is suitable for its utilization in SHC of a passive standard due to a smaller number of changes in the quality of internal environment of SHC (switch-on/switch-off of HVAC, window and door opening). The advantage of the proposed method is a lower investment cost of IB (e.g. office building) equipment regarding sensors for the monitoring of a presence of subjects in separate rooms of IB. The disadvantage is an instability of predictions in transient phases of technology (window opening, HVAC switch-on/switch-off). To decrease the investment costs connected with the installation of missing sensors for the monitoring of CO2 concentrations in big buildings or in huge residential dwellings, it is possible to use our proposed method for the prediction of CO2 from the measurements of temperature T i, T o and air humidity rH, which are very often included in the standard equipment of IB.
The third part of the paper deals with the development of the application for voice control of operating-technical functions in SHC, equipped with the KNX bus system. The resultant universal application for Windows 10 can be run on both the desktop system version and the mobile version of the Windows 10 operating system. The paper describes utilization of the MVVM architectural pattern for UWP development. The application has incorporated voice control, available in the English language, which is used to facilitate the application control not only for the elderly and handicapped. The application includes several settings facilitating work with the application for both seniors and other users. The functionality of the HESTIA application was verified in SHC, where the control of lighting and blinds were tested. In comparison with other works dealing with the creation of the environment for control of an intelligent building, the resultant application can be configured and thus used for any building equipped with the KNX bus system. Voice control implementation is an in-house solution; no third-party software is used here. In this part of the paper, practical verification of the possibility of use of a combination of a CO2 sensor and a microphone for determination of ADL took place in room R104 of SHC..
Next experiments will be focused on the clarification of the proposed method by adding other variables (sunshine, wind …). The above-described technological methods for ADL monitoring of residents SHC will be in additional work used for classification and recognition of daily patterns and habits of the elderly in the SHC.
References
Debes C, Merentitis A, Sukhanov S, Niessen M et al (2016) Monitoring activities of daily living in smart homes understanding human behavior. IEEE Signal Process Mag 33(2):81–94
Fahad LG, Khan A, Rajarajan M (2015) Activity recognition in smart homes with self verification of assignments. Neurocomputing 149:1286–1298
Garcia-Rodriguez C, Martinez-Tomas R, Cuadra-Troncoso JR, Rincon M et al (2015) A simulation tool for monitoring elderly who suffer from disorientation in a smart home. Expert Syst 32(6):676–687
Hussain, M, Afzal M, Khan WA, Lee S, et al. (2012) Clinical decision support service for elderly people in smart home environment. In: 2012 12th International conference on control, automation, robotics & vision (ICARCV). pp 678–683
Jalal A, Kamal S (2014a) IEEE real-time life logging via a depth silhouette-based human activity recognition system for smart home services. In: 2014 11th IEEE international conference on advanced video and signal based surveillance (AVSS). pp 74–80
Jalal A, Sarif N, Kim JT, Kim TS (2013) Human activity recognition via recognized body parts of human depth silhouettes for residents monitoring services at smart home. Indoor Built Environ 22(1):271–279
Konda KR, Rosani A, Conci N, DE Natale FGB (2015) Smart Camera Reconfiguration in Assisted Home Environments for Elderly Care. In: Agapito L, BRONSTEIN M, Rother C (eds). Computer Vision—Eccv 2014 Workshops pt IV. Springer, Berlin, pp 45-58
Magherini T, Fantechi A, Nugent CD, Vicario DE (2013) using temporal logic and model checking in automated recognition of human activities for ambient-assisted living. IEEE Transac Hum Mach Syst 43(6):509–521
Medjahed H, Istrate D, Boudy J, Dorizzi B, et al. (2001) Human activities of daily living recognition using fuzzy logic for elderly home monitoring, edn. IEEE 2009, New York. ISBN 978-1-4244-3596-8
Mocanu I, Florea AM (2011) A multi-agent system for human activity recognition in smart environments. In: Brazier FMT, Nieuwenhuis K, Pavlin G, Warnier M, Badica C (eds) Intelligent distributed computing, vol 382. Springer, Berlin, pp 291–301
Ridi A, Zarkadis N, Gisler C, Hennebert J (2015) Duration models for activity recognition and prediction in buildings using hidden markov models. In: Proceedings of the 2015 IEEE international conference on data science and advanced analytics (IEEE Dsaa 2015). p 26–35
Ueda K, Tamai M, Yasumoto K (2015) IEEE a method for recognizing living activities in homes using positioning sensor and power meters. In: 2015 IEEE international conference on pervasive computing and communication workshops (Percom Workshops). p 354–359
Vandewiele F, Motamed C (2011) IEEE PhD Forum: A data mining approach for human activity learning in a multi-modal sensor system. In: 2011 Fifth ACM/IEEE international conference on distributed smart cameras (ICDSC). p 2
Zolfaghari S, Keyvanpour MR (2016) SARF: Smart activity recognition framework in ambient assisted living. In: Ganzha M, Maciaszek L, Paprzycki M (eds). In: Proceedings of the 2016 federated conference on computer science and information systems. IEEE, New York, pp 1435–1443
Zolfaghari SR, Zall MR (2016) keyvanpour and ieee sonAr: smart ontology activity recognition framework to fulfill semantic web in smart homes. In: 2016 Second international conference on web research (ICWR). pp 139–144
Libal V, Ramabhadran B, Mana N, Pianesi F et al (2009) Multimodal classification of activities of daily living inside smart homes. In: Omatu S, Rocha MP, Bravo J, Fernandez F, Corchado E, Bustillo A, Corchado JM (eds). Distributed computing, artificial intelligence, bioinformatics, soft computing, and ambient assisted living, pt II, proceedings, vol 5518. Springer, Berlin, p 687
Ni Q, Garcia Hernando AB, de la Cruz IP (2015) The Elderly’s independent living in smart homes: a characterization of activities and sensing infrastructure survey to facilitate services development. Sensors 15(5):11312–11362
Abidine MB, Fergani B (2015) Comparing HMM, LDA, SVM and Smote-SVM algorithms in classifying human activities. In: Eloualkadi A, Choubani F, Elmoussati A (eds) Proceedings of the Mediterranean conference on information and communication technologies 2015, vol 381. Springer, New York; pp 639–644
Martinek R, et al (2015) Control methods of active power filters using soft computing techniques. In: 8th International scientific symposium on electrical power engineering (Elektroenergetika), Stara Lesna, Slovakia, pp 363–366
Martinek R et al (2015) A robust approach for acoustic noise suppression in speech using ANFIS. J Elect Eng 66(6):301–310
Alsinglawi B, Liu T, Nguyen QV, Gunawardana U et al (2016) Passive RFID localization framework in smart homes healthcare settings. In: Maeder AJ, Ho K, Marcelo A, Warren J (eds) Promise of new technologies in an age of new health challenges, vol 231. Ios Press, Amsterdam, pp 1–8
Amri MH, Becis Y, Aubry D, Ramdani N, et al. (2015) Indoor human/robot localization using robust multi-modal data fusion. In: 2015 IEEE international conference on robotics and automation. IEEE Computer Soc, Los Alamitos, pp 3456–3463
Vanus J, Styskala V (2010) Application of optimal settings of the LMS adaptive filter for speech signal processing. In: Proceedings of the international multiconference on computer science and information technology. p 767–774. doi:10.1109/IMCSIT.2010.5679739. ISBN 978-1-4244-6432-6
Barger TS, Brown DE, Alwan M (2005) Health-status monitoring through analysis of behavioral patterns. In: IEEE transactions on systems man and cybernetics part a—systems and humans, vol 35 issue 1. pp 22–27
Jalal A, Kamal S, Kim D (2014) A depth video sensor-based life-logging human activity recognition system for elderly care in smart indoor environments. Sensors 14(7):11735–11759
Benmansour A, Bouchachia A, Feham M (2015) IEEE human activity recognition in pervasive single resident smart homes: state of art. In: 2015 12th IEEE international conference on programming and systems (ISPS). p 276–284
Dersingh A (2014) IEEE Human Movement Detection using Home Network Information and Events on Smartphones. In: 2014 international conference on electronics, information and communications (ICEIC), 2
Prado M, Roa LM, Reina-Tosina J, Rovayo M (2005) Wearable human movement monitoring device aimed at providing personalized support in healthcare. In: Cane C, Chiao JC, verdu FV (eds) Smart Sensors, Actuators, and MEMS II, vol 5836. Spie-Int Soc Optical Engineering, Bellingham, pp 570–578
Charlon Y, Fourty N, Bourennane W, Campo E (2013) Design and evaluation of a device worn for fall detection and localization: application for the continuous monitoring of risks incurred by dependents in an Alzheimer’s care unit. Expert Syst Appl 40(18):7316–7330
Noury N, Herve T, Rialle V, Virone G, et al. (2000) Monitoring behavior in home using a smart fall sensor and position sensors. In: Dittmar A, Beebe D (eds). IEEE, New York. ISBN 0-7803-6603-4
Coradeschi S, Cesta A, Cortellessa G, Coraci L, et al. GiraffPlus: combining social interaction and long term monitoring for promoting independent living. In: Paja WA, Wilamowski BM (eds) 2013 6th international conference on human system interactions. IEEE, New York, pp 578–585
Cunha M, Fuks H AmbLEDs Collaborative Healthcare for AAL Systems. In: Proceedings of the 2015 IEEE 19th international conference on computer supported cooperative work in design (CSCWD). pp 626–631
Yuan MY, Green JR, Goubran R (2013) Thermal imaging for assisted living at home: improving kitchen safety. J Med Biol Eng 33(4):380–387
Inomata A, Yaginuma Y (2014) Hassle-free sensing technologies for monitoring daily health changes. Fujitsu Sci Tech J 50(1):78–83
Liu J, Augusto JC, Wang H (2006) Considerations on uncertain spatio-temporal reasoning in smart home systems. In: Dhondt P, Fantoni PF, Decock M, Nachtegael M, Kerre EE (eds) Ruan D. World Scientific Publ Co Pte Ltd, Singapore. ISBN 981-256-690-2
Noury N, Berenguer M, Teyssier H, Bouzid MJ et al (2011) Building an index of activity of inhabitants from their activity on the residential electrical power line. IEEE Trans Inf Technol Biomed 15(5):758–766
Yang L, Ge YH, Li WF, Rao WB, et al. (2014) A home mobile healthcare system for wheelchair users. In: Proceedings of the 2014 IEEE 18th international conference on computer supported cooperative work in design (CSCWD). pp 609–614
Vafek Z Možnosti měření oxidu uhličitého – měřicí přístroje a čidla. (Download 15.6.2017 from http://vetrani.tzb-info.cz/vnitrni-prostredi/13910-moznosti-mereni-oxidu-uhliciteho-merici-pristroje-a-cidla)
Šubrt R, Mikroklima ve veřejných budovách jako důvod instalace rekuperace (15.6.2017 www.eduin.cz/wp-content/uploads/2015/…/Studie-Koncentrace-CO2-ve-skolach.pdf)
Ni Q, García AB, de la Hernando IP, Cruz P (2015) The Elderly’s independent living in smart homes: a characterization of activities and sensing infrastructure survey to facilitate services development. Sensors 15(5):11312–11362
Alshahrany F, Abbod M, Moualek I (2015) WSN and RFID integration to support intelligent monitoring in smart buildings using hybrid intelligent decision support systems. Acta Phys Pol A 128:B152–B159. doi:10.12693/APhysPolA.128.B-152
Yang Z, Li N, Becerik-Gerber B, Orosz M (2014) A systematic approach to occupancy modeling in ambient sensor-rich buildings. Simulation 90(8):960–977. doi:10.1177/0037549713489918
Zhao Z, Xu W, Chen D (2014) EM-LDA model of user behavior detection for energy efficiency. In: 2014 IEEE international conference on system science and engineering (ICSSE). pp 295–300. doi:10.1109/ICSSE.2014.6887952. ISBN 978-1-4799-4367-8
Dong B, Andrews B, Lam KP, Höynck M, Zhang R, Chiou Y-S, Benitez D (2010) An information technology enabled sustainability test-bed (ITEST) for occupancy detection through an environmental sensing network. Energy Build 42(7):1038–1046. doi:10.1016/j.enbuild.2010.01.016
Dong B, Lam KP (2011) Building energy and comfort management through occupant behaviour pattern detection based on a large-scale environmental sensor network. J Build Perform Simul 4(4):359–369. doi:10.1080/19401493.2011.577810
Vanus J, Martinek R, Bilik P, Zidek J, Dohnalek P, Gajdos P (2016) New method for accurate prediction of CO2 in the Smart Home. In: 2016 IEEE international instrumentation and measurement technology conference proceedings. pp 1–5. doi:10.1109/I2MTC.2016.7520562. ISBN 978-1-4673-9220-4
Liu D, Guan X, Du Y, Zhao Q (2013) Measuring indoor occupancy in intelligent buildings using the fusion of vision sensors. Meas Sci Technol 24(7):074023. doi:10.1088/0957-0233/24/7/074023
Chahuara P, Fleury A, Portet F, Vacher M (2016) On-line human activity recognition from audio and home automation sensors: comparison of sequential and non-sequential models in realistic smart homes. J Ambient Intell Smart Environ 8:399–422
Biswas MAR, Robinson MD, Fumo N (2016) Prediction of residential building energy consumption: a neural network approach. Energy 117:84–92
Pantazaras A, Lee SE, Santamouris M, Yang JJ (2016) Predicting the CO2 levels in buildings using deterministic and identified models. Energy Build 127:774–785
Leung MC, Tse NCF, Lai LL, Chow TT (2012) The use of occupancy space electrical power demand in building cooling load prediction. Energy Build 55:151–163
Moon JW, Yoon Y, Jeon YH, Kim S (2017) Prediction models and control algorithms for predictive applications of setback temperature in cooling systems. Appl Therm Eng 113:1290–1302
Mba L, Meukam P, Kemajou A (2016) Application of artificial neural network for predicting hourly indoor air temperature and relative humidity in modern building in humid region. Energy Build 121:32–42
Lv DH, Zhong BC, Luo J (2015) Application of GLBP algorithm in the prediction of building energy consumption. Int J Adv Comput Sci Appl 6(6):45–48
Zhong BC, Lu K, Lv DH, Luo J, et al (2015) Short-term prediction of building energy consumption based on GALM neural network. In: Liu M, Zhang X (eds) Proceedings of the international conference on advances in mechanical engineering and industrial informatics, vol 15. Atlantis Press, Paris, pp 867–871
Yuce B, LI HJ, Rezgui Y, Petri I et al (2014) Utilizing artificial neural network to predict energy consumption and thermal comfort level: an indoor swimming pool case study. Energy Build 80:45–56
Gavin H (2011) The Levenberg–Marquardt method for nonlinear least squares curve-fitting problems
Lera G, Pinzolas M (2002) Neighborhood based Levenberg–Marquardt algorithm for neural network training. In: IEEE transactions on neural networks, vol 13 issue 5. pp 1200–1203. doi:10.1109/TNN.2002.1031951. ISSN 1045-9227
Kvasnička V (1997) Úvod do teórie neurónových sietí. Slovenská republika, IRIS. ISBN 80-887-7830-1
Šíma J, Neruda R (1996) Teoretické otázky neuronových sítí. MATFYZPRESS, Praha. ISBN 80-85863-18-9
Karsoliya S (2012) Approximating number of hidden layer neurons in multiple hidden layer BPNN architecture. In: International of engineering trends and technology, vol 3 issue 6. ISSN 2231-5381
Icer S, Kara S, Guven A (2006) Comparison of multilayer perceptron training algorithms for portal venous doppler signals in the cirrhosis disease. Expert Syst Appl 31(2):406–413
Bland JM, Altman DG (1999) Measuring agreement in method comparison studies. Stat Methods Med Res 8(2):135–160. doi:10.1177/096228029900800204
Garate A, Lucas I, Herrasti N, Lopez A (2005) Ambient intelligence as paradigm of a full automation process at home in a real application. In: 2005 International symposium on computational intelligence in robotics and automation. IEEE, pp 475–479. doi:10.1109/CIRA.2005.1554322. ISBN 0-7803-9355-4
Hsu CL, Chen K-Y (2009) Practical design of intelligent remote-controller with speech-recognition and self-learning function. In: IEEE 2009 International conference on machine learning and cybernetics. pp 3361–3368. doi:10.1109/ICMLC.2009.5212758. ISBN 978-1-4244-3702-3
Lee SJ, Ko I, Kil MW (2007) A user interface for controlling information appliances in smart homes. p 875 . doi:10.1007/978-3-540-72830-6_92
Mittal Y, Toshniwal P, Sharma S, Singhal D, Gupta R, Mittal VK (2015) A voice-controlled multi-functional smart home automation system. In: 2015 Annual IEEE India conference (INDICON). pp 1–6. doi:10.1109/INDICON.2015.7443538. ISBN 978-1-4673-7399-9
Möller S, Krebber J, Smeele P (2006) Evaluating the speech output component of a smart-home system. Speech Commun 48(1):1–27. doi:10.1016/j.specom.2005.05.004
Wilde A, Ojuroye O, Torah R, IEEE (2015) Prototyping a voice-controlled smart home hub wirelessly integrated with a wearable device. In: 2015 9th international conference on sensing technology p 71–75
Brooks JO, Smolentzov L, Dearment A, Logan W et al (2011) Toward a “Smart” nightstand prototype: an examination of nightstand table contents and preferences. Herd Health Environ Res Des J 4(2):91–108
Hamill M, Young V, Boger J, Mihailidis A (2009) Development of an automated speech recognition interface for personal emergency response systems. J Neuroeng Rehabil 6:26
Hossain MS, IEEE Patient Status Monitoring For Smart Home Healthcare (2016) In: IEEE international conference on multimedia & expo workshops (ICMEW), Seattle
Johnson JL, Davenport R, Mann WC (2007) Consumer feedback on smart home applications. Topics Geriatr Rehabil 23(1):60–72
Portet F, Vacher M, Golanski C, Roux C et al (2013) Design and evaluation of a smart home voice interface for the elderly: acceptability and objection aspects. Pers Ubiquit Comput 17(1):127–144
Tang LZ, Ang KS, Yusoff M, Tng CK, et al. (2015) Augmented reality control home (ARCH) for disabled and elderlies. In: 2015 IEEE Tenth international conference on intelligent sensors, sensor networks and information processing (ISSNIP)
Vanus J, Koziorek J, Hercik R (2013) The design of the voice communication in smart home care. In: Herencsar N, Molnar K (eds). ISBN 978-1-4799-0402-0; 978-1-4799-0403-7
Vanus J, Smolon M, Martinek R, Koziorek J et al (2015) Testing of the voice communication in smart home care. Hum Cent Comput Inform Sci 5:1–22
Zhuang XD, Huang J, Potamianos G, Hasegawa-Johnson M, et al (2009) Acoustic fall detection using gaussian mixture models and GMM supervectors. In: IEEE international conference on acoustics, speech and signal processing. Taipei, p 69
Ni Q, García Hernando AB, de la Cruz IP (2015) The Elderly’s independent living in smart homes: a characterization of activities and sensing infrastructure survey to facilitate services development. Sensors 15(5):11312–11362
Agarwalla S, Sarma KK (2016) Machine learning based sample extraction for automatic speech recognition using dialectal Assamese speech. Neural Netw 78:97–111. doi:10.1016/j.neunet.2015.12.010
Asano F, Motomura Y, Nakamura S (2003) Fusion of audio and video information for detecting speech events. In: Sixth international conference of information fusion proceedings of the IEEE. p 386–393. doi:10.1109/ICIF.2003.177472. ISBN 0-9721844-4-9
Czyżewski A, Królikowski R (2001) Neuro-rough control of masking thresholds for audio signal enhancement. Neurocomputing 36(1–4):5–27. doi:10.1016/S0925-2312(00)00333-7
Du K-L, Swamy MN (2006) Neural networks in a softcomputing framework. Springer, London. ISBN 978-1-84628-303-1
Martinek R, Kelnar M, Vanus J, Koudelka P, Bilik P, Koziorek J, Zidek J (2015) Adaptive noise suppression in voice communication using a neuro-fuzzy inference system. In: 2015 38th International conference on telecommunications and signal processing (TSP) IEEE. pp 382-386. doi:10.1109/TSP.2015.7296288. ISBN 978-1-4799-8498-5
Vanus J (2011) The use of the adaptive noise cancellation for voice communication with the control system. Int J Comput Sci Appl 8(1):54–70
Vanus J, Koziorek J, Hercik R (2013) The design of the voice communication in smart home care. In: 2013 36th International Conference on Telecommunications and Signal Processing, TSP 2013. Department of Cybernetics and Biomedical Engineering, VSB TU Ostrava, 17.listopadu 15, 708 33, Ostrava. pp 561–564. doi:10.1109/TSP.2013.6613996. ISBN 9781479904044
Vanus J, Smolon R, Martinek J, Koziorek J, Zidek A, Bilik P (2015) Testing of the voice communication in smart home care. Human-centric Computing and Information Sciences. Department of Cybernetics and Biomedical Engineering, VSB–Technical University of Ostrava, 17. listopadu, 15/2172, Ostrava, vol 5 issue 1. Springer, Berlin. doi:10.1186/s13673-015-0035-0. ISSN 21921962
Hammer M (2009) Metody umělé inteligence v diagnostice elektrických strojů. BEN-technická literatura, Praha. ISBN 978-80-7300-231-2
Authors’ contributions
JV proposed the system idea, performed the experiments and wrote the manuscript. JV, RM, JN and MF edited the manuscript, designed and implemented the classification methods to adequately evaluate the proposed experiments. JB developed, tested and validated the HESTIA software. JV, PB and JZ critically evaluated the scientific validity of the proposed system and acquired the vital data and performed its final edits. All authors read and approved the final manuscript.
Acknowledgements
This paper has been elaborated in the framework of the projects SP2017/128 of Student Grant System, VSB-TU Ostrava and “Promotion of Development of NEK activities in the field of energy saving energy concept” Reg.n. CZ.01.1.02/0.0/0.0/15_012/0002294.
Competing interests
The authors declare that they have no competing interests.
Publisher’s Note
Springer Nature remains neutral with regard to jurisdictional claims in published maps and institutional affiliations.
Author information
Authors and Affiliations
Corresponding author
Rights and permissions
Open Access This article is distributed under the terms of the Creative Commons Attribution 4.0 International License (http://creativecommons.org/licenses/by/4.0/), which permits unrestricted use, distribution, and reproduction in any medium, provided you give appropriate credit to the original author(s) and the source, provide a link to the Creative Commons license, and indicate if changes were made.
About this article

Cite this article
Vanus, J., Belesova, J., Martinek, R. et al. Monitoring of the daily living activities in smart home care. Hum. Cent. Comput. Inf. Sci. 7, 30 (2017). https://doi.org/10.1186/s13673-017-0113-6
Received:
Accepted:
Published:
DOI: https://doi.org/10.1186/s13673-017-0113-6