
Abstract
Diabetes Mellitus is a severe, chronic disease that occurs when blood glucose levels rise above certain limits. Over the last years, machine and deep learning techniques have been used to predict diabetes and its complications. However, researchers and developers still face two main challenges when building type 2 diabetes predictive models. First, there is considerable heterogeneity in previous studies regarding techniques used, making it challenging to identify the optimal one. Second, there is a lack of transparency about the features used in the models, which reduces their interpretability. This systematic review aimed at providing answers to the above challenges. The review followed the PRISMA methodology primarily, enriched with the one proposed by Keele and Durham Universities. Ninety studies were included, and the type of model, complementary techniques, dataset, and performance parameters reported were extracted. Eighteen different types of models were compared, with tree-based algorithms showing top performances. Deep Neural Networks proved suboptimal, despite their ability to deal with big and dirty data. Balancing data and feature selection techniques proved helpful to increase the model’s efficiency. Models trained on tidy datasets achieved almost perfect models.
Introduction
Diabetes mellitus is a group of metabolic diseases characterized by hyperglycemia resulting from defects in insulin secretion, insulin action, or both [1]. In particular, type 2 diabetes is associated with insulin resistance (insulin action defect), i.e., where cells respond poorly to insulin, affecting their glucose intake [2]. The diagnostic criteria established by the American Diabetes Association are: (1) a level of glycated hemoglobin (HbA1c) greater or equal to 6.5%; (2) basal fasting blood glucose level greater than 126 mg/dL, and; (3) blood glucose level greater or equal to 200 mg/dL 2 h after an oral glucose tolerance test with 75 g of glucose [1].
Diabetes mellitus is a global public health issue. In 2019, the International Diabetes Federation estimated the number of people living with diabetes worldwide at 463 million and the expected growth at 51% by the year 2045. Moreover, it is estimated that there is one undiagnosed person for each diagnosed person with a diabetes diagnosis [2].
The early diagnosis and treatment of type 2 diabetes are among the most relevant actions to prevent further development and complications like diabetic retinopathy [3]. According to the ADDITION-Europe Simulation Model Study, an early diagnosis reduces the absolute and relative risk of suffering cardiovascular events and mortality [4]. A sensitivity analysis on USA data proved a 25% relative reduction in diabetes-related complication rates for a 2-year earlier diagnosis.
Consequently, many researchers have endeavored to develop predictive models of type 2 diabetes. The first models were based on classic statistical learning techniques, e.g., linear regression. Recently, a wide variety of machine learning techniques has been added to the toolbox. Those techniques allow predicting new cases based on patterns identified in training data from previous cases. For example, Kälsch et al. [5] identified associations between liver injury markers and diabetes and used random forests to predict diabetes based on serum variables. Moreover, different techniques are sometimes combined, creating ensemble models to surpass the single model’s predictive performance.
The number of studies developed in the field creates two main challenges for researchers and developers aiming to build type 2 diabetes predictive models. First, there is considerable heterogeneity in previous studies regarding machine learning techniques used, making it challenging to identify the optimal one. Second, there is a lack of transparency about the features used to train the models, which reduces their interpretability, a feature utterly relevant to the doctor.
This review aims to inform the selection of machine learning techniques and features to create novel type 2 diabetes predictive models. The paper is organized as follows. “Background” section provides a brief background on the techniques used to create predictive models. “Methods” section presents the methods used to design and conduct the review. “Results” section summarizes the results, followed by their discussion in “Discussion” section, where a summary of findings, the opportunity areas, and the limitations of this review are presented. Finally, “Conclusions” section presents the conclusions and future work.
Background
Machine learning and deep learning
Over the last years, humanity has achieved technological breakthroughs in computer science, material science, biotechnology, genomics, and proteomics [6]. These disruptive technologies are shifting the paradigm of medical practice. In particular, artificial intelligence and big data are reshaping disease and patient management, shifting to personalized diagnosis and treatment. This shift enables public health to become predictive and preventive [6].
Machine learning is a subset of artificial intelligence that aims to create computer systems that discover patterns in training data to perform classification and prediction tasks on new data [7]. Machine learning puts together tools from statistics, data mining, and optimization to generate models.
Representational learning, a subarea of machine learning, focuses on automatically finding an accurate representation of the knowledge extracted from the data [7]. When this representation comprises many layers (i.e., a multi-level representation), we are dealing with deep learning.
In deep learning models, every layer represents a level of learned knowledge. The nearest to the input layer represents low-level details of the data, while the closest to the output layer represents a higher level of discrimination with more abstract concepts.
The studies included in this review used 18 different types of models:
-
Deep Neural Network (DNN): DNNs are loosely inspired by the biological nervous system. Artificial neurons are simple functions depicted as nodes compartmentalized in layers, and synapses are the links between them [8]. DNN is a data-driven, self-adaptive learning technique that produces non-linear models capable of real-world modeling problems.
-
Support Vector Machines (SVM): SVM is a non-parametric algorithm capable of solving regression and classification problems using linear and non-linear functions. These functions assign vectors of input features to an n-dimensional space called a feature space [9].
-
k-Nearest Neighbors (KNN): KNN is a supervised, non-parametric algorithm based on the “things that look alike” idea. KNN can be applied to regression and classification tasks. The algorithm computes the closeness or similarity of new observations in the feature space to k training observations to produce their corresponding output value or class [9].
-
Decision Tree (DT): DTs use a tree structure built by selecting thresholds for the input features [8]. This classifier aims to create a set of decision rules to predict the target class or value.
-
Random Forest (RF): RFs merge several decision trees, such as bagging, to get the final result by a voting strategy [9].
-
Gradient Boosting Tree (GBT) and Gradient Boost Machine (GBM): GBTs and GBMs join sequential tree models in an additive way to predict the results [9].
-
J48 Decision Tree (J48): J48 develops a mapping tree to include attribute nodes linked by two or more sub-trees, leaves, or other decision nodes [10].
-
Logistic and Stepwise Regression (LR): LR is a linear regression technique suitable for tasks where the dependent variable is binary [8]. The logistic model is used to estimate the probability of the response based on one or more predictors.
-
Linear and Quadratic Discriminant Analysis (LDA): LDA segments an n-dimensional space into two or more dimensional spaces separated by a hyper-plane [8]. The aim of it is to find the principal function for every class. This function is displayed on the vectors that maximize the between-group variance and minimizes the within-group variance.
-
Cox Hazard Regression (CHR): CHR or proportional hazards regression analyzes the effect of the features to occur a specific event [11]. The method is partially non-parametric since it only assumes that the effects of the predictor variables on the event are constant over time and additive on a scale.
-
Least-Square Regression: (LSR) method is used to estimate the parameter of a linear regression model [12]. LSR estimators minimize the sum of the squared errors (a difference between observed values and predicted values).
-
Multiple Instance Learning boosting (MIL): The boosting algorithm sequentially trains several weak classifiers and additively combines them by weighting each of them to make a strong classifier [13]. In MIL, the classifier is logistic regression.
-
Bayesian Network (BN): BNs are graphs made up of nodes and directed line segments that prohibit cycles [14]. Each node represents a random variable and its probability distribution in each state. Each directed line segment represents the joint probability between nodes calculated using Bayes’ theorem.
-
Latent Growth Mixture (LGM): LGM groups patients into an optimal number of growth trajectory clusters. Maximum likelihood is the approach to estimating missing data [15].
-
Penalized Likelihood Methods: Penalizing is an approach to avoid problems in the stability of the estimated parameters when the probability is relatively flat, which makes it difficult to determine the maximum likelihood estimate using simple methods. Penalizing is also known as shrinkage [16]. Least absolute shrinkage and selection operator (LASSO), smoothed clipped absolute deviation (SCAD), and minimax concave penalized likelihood (MCP) are methods using this approach.
-
Alternating Cluster and Classification (ACC): ACC assumes that the data have multiple hidden clusters in the positive class, while the negative class is drawn from a single distribution. For different clusters of the positive class, the discriminatory dimensions must be different and sparse relative to the negative class [17]. Clusters are like “local opponents” to the complete negative set, and therefore the “local limit” (classifier) has a smaller dimensional subspace than the feature vector.
Some studies used a combination of multiple machine learning techniques and are subsequently labeled as machine learning-based method (MLB).
Systematic literature review methodologies
This review follows two methodologies for conducting systematic literature reviews: the Preferred Reporting Items for Systematic Reviews and Meta-Analyses (PRISMA) statement [18] and the Guidelines for performing Systematic Literature Reviews in Software Engineering [19]. Although these methodologies hold many similarities, there is a substantial difference between them. While the former was tailored for medical literature, the latter was adapted for reviews in computer science. Hence, since this review focuses on computer methods applied to medicine, both strategies were combined and implemented. The PRISMA statement is the standard for conducting reviews in the medical sciences and was the principal strategy for this review. It contains 27 items for evaluating included studies, out of which 23 are used in this review. The second methodology is an adaptation by Keele and Durham Universities to conduct systematic literature reviews in software engineering. The authors provide a list of guidelines to conduct the review. Two elements were adopted from this methodology. First, the protocol’s organization in three stages (planning, conducting, and reporting). Secondly, the quality assessment strategy to select studies based on the information retrieved by the search.
Related works
Previous reviews have explored machine learning techniques in diabetes, yet with a substantially different focus. Sambyal et al. conducted a review on microvascular complications in diabetes (retinopathy, neuropathy, nephropathy) [20]. This review included 31 studies classified into three groups according to the methods used: statistical techniques, machine learning, and deep learning. The authors concluded that machine learning and deep learning models are more suited for big data scenarios. Also, they observed that the combination of models (ensemble models) produced improved performance.
Islam et al. conducted a review with meta-analysis on deep learning models to detect diabetic retinopathy (DR) in retinal fundus images [21]. This review included 23 studies, out of which 20 were also included for meta-analysis. For each study, the authors identified the model, the dataset, and the performance metrics and concluded that automated tools could perform DR screening.
Chaki et al. reviewed machine learning models in diabetes detection [22]. The review included 107 studies and classified them according to the model or classifier, the dataset, the features selection with four possible kinds of features, and their performance. The authors found that text, shape, and texture features produced better outcomes. Also, they found that DNNs and SVMs delivered better classification outcomes, followed by RFs.
Finally, Silva et al. [23] reviewed 27 studies, including 40 predictive models for diabetes. They extracted the technique used, the temporality of prediction, the risk of bias, and validation metrics. The objective was to prove whether machine learning exhibited discrimination ability to predict and diagnose type 2 diabetes. Although this ability was confirmed, the authors did not report which machine learning model produced the best results.
This review aims to find areas of opportunity and recommendations in the prediction of diabetes based on machine learning models. It also explores the optimal performance metrics, the datasets used to build the models, and the complementary techniques used to improve the model’s performance.
Methods
Objective of the review
This systematic review aims to identify and report the areas of opportunity for improving the prediction of diabetes type 2 using machine learning techniques.
Research questions
-
1.
Research Question 1 (RQ1): What kind of features make up the database to create the model?
-
2.
Research Question 2 (RQ2): What machine learning technique is optimal to create a predictive model for type 2 diabetes?
-
3.
Research Question 3 (RQ3): What are the optimal validation metrics to compare the models’ performance?
Information sources
Two search engines were selected to search:
-
PubMed, given the relationship between a medical problem such as diabetes and a possible computer science solution.
-
Web of Science, given its extraordinary ability to select articles with high affinity with the search string.
These search engines were also considered because they search in many specialized databases (IEEE Xplore, Science Direct, Springer Link, PubMed Central, Plos One, among others) and allow searching using keywords combined with boolean operators. Likewise, the database should contain articles with different approaches to predictive models and not specialized in clinical aspects. Finally, the number of articles to be included in the systematic review should be sufficient to identify areas of opportunity for improving models’ development to predict diabetes.
Search strategy
Three main keywords were selected from the research questions. These keywords were combined in strings as required by each database in their advanced search tool. In other words, these strings were adapted to meet the criteria of each database Table 1.
Eligibility criteria
Retrieved records from the initial search were screened to check their compliance with eligibility criteria.
Firstly, papers published from 2017 to 2021 only were considered. Then, two rounds of screening were conducted. The first round focused mainly on the scope of the reported study. Articles were excluded if the study used genetic data to train the models, as this was not a type of data of interest in this review. Also, articles were excluded if the full text was not available. Finally, review articles were also excluded.
In the second round of screening, articles were excluded when machine learning techniques were not used to predict type 2 diabetes but other types of diabetes, treatments, or diseases associated with diabetes (complications and related diseases associated with metabolic syndrome). Also, studies using unsupervised learning were excluded as they cannot be validated using the same performance metrics as supervised learning models, preventing comparison.
Quality assessment
After retrieving the selected articles, three parameters were selected, each one generated by each research question. The eligibility criteria are three possible subgroups according to the extent to which the article satisfied it.
-
QA1.
The dataset contains sociodemographic and lifestyle data, clinical diagnosis, and laboratory test results as attributes for the model.
-
1.1.
Dataset contains only one kind of attributes.
-
1.2.
Dataset contains similar kinds of attributes.
-
1.3.
Dataset uses EHRs with multiple kinds of attributes.
-
1.1.
-
QA2.
The article presents a model with a machine learning technique to predict type 2 diabetes.
-
2.1.
Machine Learning methods are not used at all.
-
2.2.
The prediction method in the model is used as part of the prepossessing for the data to do data mining.
-
2.3.
Model used a machine learning technique to predict type 2 diabetes.
-
2.1.
-
QA3.
The authors use supervised learning with validation metrics to contrast their results with previous work.
-
3.1.
The authors used unsupervised methods.
-
3.2.
The authors used a supervised method with one validation metric or several methods with supervised and unsupervised learning.
-
3.3.
The authors used supervised learning with more than one metric to validate the model (accuracy, specificity, sensitivity, area under the ROC, F1-score).
-
3.1.
Data extraction
After assessing the papers for quality, the intersection of the subgroups QA2.3 and QA1.1 or QA1.2 or QA1.3 and QA3.2 or QA3.3 were processed as follows.
First, the selected articles were grouped in two possible ways according to the data type (glucose forecasting or electronic health records). The first group contains models that screen the control levels of blood glucose, while the second group contains models that predict diabetes based on electronic health records.
The second classification was more detailed, applying for each group the below criteria.
The data extraction criteria are:
-
Machine learning model (specify which machine learning method use)
-
Validation parameter (accuracy, sensitivity, specificity, F1-score, AUC (ROC))
-
Complementary techniques (complementary statistics and machine learning techniques used for the models)
-
Data sampling (cross-validation, training-test set, complete data)
-
Description of the population (age, balanced or imbalance, population cohort size).
Risk of bias analyses
Risk of bias in individual studies
The risk of bias in individual studies (i.e., within-study bias) was assessed based on the characteristics of the sample included in the study and the dataset used to train and test the models. One of the most common risks of bias is when the data is imbalanced. When the dataset has significantly more observations for one label, the probability of selecting that label increases, leading to misclassification.
The second parameter that causes a risk of bias is the age of participants. In most cases, diabetes onset would be in older people making possible bound between 40 to 80 years. In other cases, the onset occurs at early age generating another dataset with a range from 21 to 80.
A third parameter strongly related to age is the early age onset. Complications increase and appear early when a patient lives more time with the disease, making it harder to develop a model only for diabetes without correlation of their complications.
Finally, as the fourth risk of bias, according to Forbes [24] data scientists spend 80% of their time on data preparation, and 60% of it is in data cleaning and organization. A well-structured dataset is relevant to generate a good performance of the model. That can be check in the results from the data items extraction the datasets like PIMA dataset that is already clean and organized well generate a model with the recall of 1 [25] also the same dataset reach an accuracy of 0.97 [26] in another model. Dirty data can not achieve values as good as clean data.
Risk of bias across studies
The items considered to assess the risk of bias across the studies (i.e., between-study bias) were the reported validation parameters and the dataset and complementary techniques used.
Validation metrics were chosen as they are used to compare the performance of the model. The studies must be compared using the same metrics to avoid bias from the validation methods.
The complementary techniques are essential since they can be combined with the primary approach to creating a better performance model. It causes a bias because it is impossible to discern if the combination of the complementary and the machine learning techniques produces good performance or if the machine learning technique per se is superior to others.
Results
Search results and reduction
The initial search generated 1327 records, 925 from PubMed and 402 from Web of Science. Only 130 records were excluded when filtering by publication year (2017–2021). Therefore, further searches were conducted using fine-tuned search strings and options for both databases to narrow down the results. The new search was carried out using the original keywords but restricting the word ‘diabetes’ to be in the title, which generated 517 records from both databases. Fifty-one duplicates were discarded. Therefore, 336 records were selected for further screening.
Further selection was conducted by applying the exclusion criteria to the 336 records above. Thirty-seven records were excluded since the study reported used non-omittable genetic attributes as model inputs, something out of this review’s scope. Thirty-eight records were excluded as they were review papers. All in all, 261 articles that fulfill the criteria were included in the quality assessment.
Figure 1 shows the flow diagram summarizing this process.

Flow diagram indicating the results of the systematic review with inclusions and exclusions
Quality assessment
The 261 articles above were assessed for quality and classified into their corresponding subgroup for each quality question (Fig. 2).

Percentage of each subgroup in the quality assessment. The criteria does not apply for two result for the Quality Assessment Questions 1 and 3
The first question classified the studies by the type of database used for building the models. The third subgroup represents the most desirable scenario. It includes studies where models were trained using features from Electronic Health Records or a mix of datasets including lifestyle, socio-demographic, and health diagnosis features. There were 22, 85, and 154 articles in subgroups one to three, respectively.
The second question classified the studies by the type of model used. Again, the third subgroup represents the most suitable subgroup as it contains studies where a machine learning model was used to predict diabetes onset. There were 46 studies in subgroup one, 66 in subgroup two, and 147 in subgroup three. Two studies were omitted from these subgroups: one used cancer-related model; another used a model of no interest to this review.
The third question clustered the studies based on their validation metrics. There were 25 studies in subgroup one (semi-supervised learning), 68 in subgroup two (only one validation metric), and 166 in subgroup three (\(>1\) validation parameters). The criteria are not applied to two studies as they used special error metrics, making it impossible to compare their models with the rest.
Data extraction excluded 101 articles from the quantitative synthesis for two reasons. twelve studies used unsupervised learning. Nineteen studies focused on diabetes treatments, 33 in other types of diabetes (eighteen type 1 and fifteen Gestational), and 37 associated diseases.
Furthermore, 70 articles were left out of this review as they focus on the prediction of diabetes complications (59) or tried to forecast levels of glucose (11), not onset. Therefore, 90 articles were chosen for the next steps.
Data extraction
Table 2 summarize the results of the data extraction. These tables are divided into two main groups, each of them corresponding to a type of data.
Risk of bias analyses
For the risk of bias in the studies: unbalanced data means that the number of observations per class is not equally distributed. Some studies applied complementary techniques (e.g., SMOTE) to prevent the bias produced by unbalance in data. These techniques undersample the predominant class or oversample the minority class to produce a balanced dataset.
Other studies used different strategies to deal with other risks for bias. For instance, they might exclude specific age groups or cases presenting a second disease that could interfere with the model’s development to deal with the heterogeneity in some cohorts’ age.
For the risk of bias across the studies: the comparison between models was performed on those reporting the most frequently used validation metrics, i.e., accuracy and AUC (ROC). The accuracy is estimated to homogenize the criteria of comparison when other metrics from the confusion matrix were calculated, or the population’s knowledge is known. The confusion matrix is a two-by-two matrix containing four counts: true positives, true negatives, false positives, and false negatives. Different validation metrics such as precision, recall, accuracy, and F1-score are computed from this matrix.
Two kinds of complementary techniques were found. Firstly, techniques for balancing the data, including oversampling and undersampling methods. Secondly, feature selection techniques such as logistic regression, principal component analysis, and statistical testing. A comparison still can be performed between them with the bias caused by the improvement of the model.
Discussion
This section discusses the findings for each of the research questions driving this review.
RQ1: What kind of features makes up the database to create the model?
Our findings suggest no agreement on the specific features to create a predictive model for type 2 diabetes. The number of features also differs between studies: while some used a few features, others used more than 70 features. The number and choice of features largely depended on the machine learning technique and the model’s complexity.
However, our findings suggest that some data types produce better models, such as lifestyle, socioeconomic and diagnostic data. These data are available in most but not all Electronic Health Records. Also, retinal fundus images were used in many of the top models, as they are related to eye vessel damage derivated from diabetes. Unfortunately, this type of image is no available in primary care data.
RQ2: What machine learning technique is optimal to create a predictive model for type 2 diabetes?
Figure 3 shows a scatter plot of studies that reported accuracy and AUC (ROC) values (x and y axes, respectively. The color of the dots represents thirteen of the eighteen types of model listed in the background. Dot labels represent the reference number of the study. A total of 30 studies is included in the plot. The studies closer to the top-right corner are the best ones, as they obtained high values for both validation metrics.

Scatterplot of AUC (ROC) vs. Accuracy for included studies. Numbers correspond to the number of reference and color dot the type of model, desired model has values of x-axis equal 1 and y-axis also equal 1
Figures 4 and 5 show the average accuracy and AUC (ROC) by model. Not all models from the background appear in both graphs since not all studies reported both metrics. Notably, most values represent a single study or the average of two studies. The exception is the average values for SVMs, RFs, GBTs, and DNNs, calculated with the results reported by four studies or more. These were the most popular machine learning techniques in the included studies.
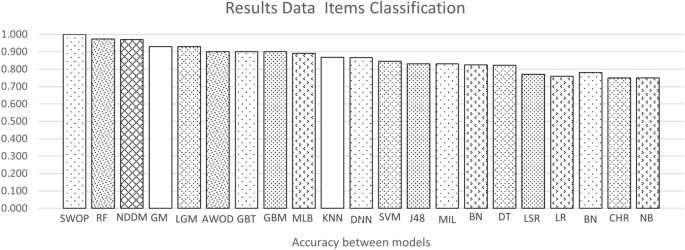
Average accuracy by model. For papers with more than one model the best score is the model selected to the graph. A better model has a higher value
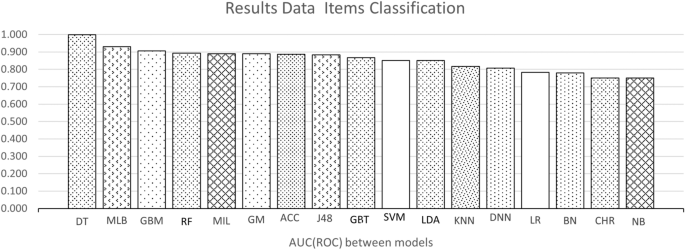
Average AUC (ROC) by model. For papers with more than one model the best score is the model selected to the graph. A better model has a higher value
RQ3: Which are the optimal validation metrics to compare the models’ improvement?
Considerable heterogeneity was found in this regard, making it harder to compare the performance between the models. Most studies reported some metrics computed from the confusion matrix. However, studies focused on statistical learning models reported hazard ratios and the c-statistic.
This heterogeneity remains an area of opportunity for further studies. To deal with it, we propose reporting at least three metrics from the confusion matrix (i.e., accuracy, sensitivity, and specificity), which would allow computing the rest. Additionally, the AUC (ROC) should be reported as it is a robust performance metric. Ideally, other metrics such as the F1-score, precision, or the MCC score should be reported. Reporting more metrics would enable benchmarking studies and models.
Summary of the findings
-
Concerning the datasets, this review could not identify an exact list of features given the heterogeneity mentioned above. However, there are some findings to report. First, the model’s performance is significantly affected by the dataset: the accuracy decreased significantly when the dataset became big and complex. Clean and well-structured datasets with a few numbers of samples and features make a better model. However, a low number of attributes may not reflect the real complexity of the multi-factorial diseases.
-
The top-performing models were the decision tree and random forest, with an similar accuracy of 0.99 and equal AUC (ROC) of one. On average, the best models for the accuracy metric were Swarm Optimization and Random Forest with a value of one in both cases. For AUC (ROC) decision tree with an AUC (ROC) of 0.98, respectively.
-
The most frequently-used methods were Deep Neural Networks, tree-type (Gradient Boosting and Random Forest), and support vector machines. Deep Neural Networks have the advantage of dealing well with big data, a solid reason to use them frequently [27, 28]. Studies using these models used datasets containing more than 70,000 observations. Also, these models deal well with dirty data.
-
Some studies used complementary techniques to improve their model’s performance. First, resampling techniques were applied to otherwise unbalanced datasets. Second, feature selection techniques were used to identify the most relevant features for prediction. Among the latter, there is principal component analysis and logistic regression.
-
The model that has a good performance but can be improved is the Deep Neural Network. As shown in Figure 4, their average accuracy is not top, yet some individual models achieved 0.9. Hence, they represent a technique worth further exploration in type 2 diabetes. They also have the advantage that can deal with large datasets. As shown in Table 2 many of the datasets used for DNN models were around 70,000 or more samples. Also, DNN models do not require complementary techniques for feature selection.
-
Finally, model performance comparison was challenging due to the heterogeneity in the metrics reported.
Conclusions
This systematic review analyzed 90 studies to find the main opportunity areas in diabetes prediction using machine learning techniques.
Findings
The review finds that the structure of the dataset is relevant to the accuracy of the models, regardless of the selected features that are heterogeneous between studies. Concerning the models, the optimal performance is for tree-type models. However, even tough they have the best accuracy, they require complementary techniques to balance data and reduce dimensionality by selecting the optimal features. Therefore, K nearest neighborhoods, and Support vector machines are frequently preferred for prediction. On the other hand, Deep Neural Networks have the advantage of dealing well with big data. However, they must be applied to datasets with more than 70,000 observations. At least three metrics and the AUC (ROC) should be reported in the results to allow estimation of the others to reduce heterogeneity in the performance comparison. Therefore, the areas of opportunity are listed below.
Areas of opportunity
First, a well-structured, balanced dataset containing different types of features like lifestyle, socioeconomically, and diagnostic data can be created to obtain a good model. Otherwise, complementary techniques can be helpful to clean and balance the data.
The machine learning model will depend on the characteristics of the dataset. When the dataset contains a few observations, machine learning techniques present a better performance; when observations are more than 70,000, Deep Learning has a good performance.
To reduce the heterogeneity in the validation parameters, the best way to do it is to calculate a minimum of three parameters from the confusion matrix and the AUC (ROC). Ideally, it should report five or more parameters (accuracy, sensitivity, specificity, precision, and F1-score) to become easier to compare. If one misses, it can be estimated from the other ones.
Limitations of the study
The study’s limitations are observed in the heterogeneity between the models that difficult to compare them. This heterogeneity is present in many aspects; the main is the populations and the number of samples used in each model. Another significant limitation is when the model predicts diabetes complications, not diabetes.
Availability of data and materials
All data generated or analysed during this study are included in this published article and its references.
Abbreviations
- DNN:
-
Deep Neural Network
- RF:
-
Random forest
- SVM:
-
Support Vector Machine
- KNN:
-
k-Nearest Neighbors
- DT:
-
Decision tree
- GBT:
-
Gradient Boosting Tree
- GBM:
-
Gradient Boost Machine
- J48:
-
J48 decision tree
- LR:
-
Logistic regression and stepwise regression
- LDA:
-
Linear and quadratric discriminant analysis
- MIL:
-
Multiple Instance Learning boosting
- BN:
-
Bayesian Network
- LGM:
-
Latent growth mixture
- CHR:
-
Cox Hazard Regression
- LSR:
-
Least-Square Regression
- LASSO:
-
Least absolute shrinkage and selection operator
- SCAD:
-
Smoothed clipped absolute deviation
- MCP:
-
Minimax concave penalized likelihood
- ACC:
-
Alternating Cluster and Classification
- MLB:
-
Machine learning-based method
- SMOTE:
-
Synthetic minority oversampling technique
- AUC (ROC):
-
Area under curve (receiver operating characteristic)
- DR:
-
Diabetic retinopathy
- GM:
-
Gaussian mixture
- NB:
-
Naive Bayes
- AWOD:
-
Average weighted objective distance
- SWOP:
-
Swarm Optimization
- NDDM:
-
Newton’s Divide Difference Method
- RMSE:
-
Root-mean-square error
References
AD Association. Classification and diagnosis of diabetes: standards of medical care in diabetes-2020. Diabetes Care. 2019. https://doi.org/10.2337/dc20-S002.
International Diabetes Federation. Diabetes. Brussels: International Diabetes Federation; 2019.
Gregg EW, Sattar N, Ali MK. The changing face of diabetes complications. Lancet Diabetes Endocrinol. 2016;4(6):537–47. https://doi.org/10.1016/s2213-8587(16)30010-9.
Herman WH, Ye W, Griffin SJ, Simmons RK, Davies MJ, Khunti K, Rutten GEhm, Sandbaek A, Lauritzen T, Borch-Johnsen K, et al. Early detection and treatment of type 2 diabetes reduce cardiovascular morbidity and mortality: a simulation of the results of the Anglo-Danish-Dutch study of intensive treatment in people with screen-detected diabetes in primary care (addition-Europe). Diabetes Care. 2015;38(8):1449–55. https://doi.org/10.2337/dc14-2459.
Kälsch J, Bechmann LP, Heider D, Best J, Manka P, Kälsch H, Sowa J-P, Moebus S, Slomiany U, Jöckel K-H, et al. Normal liver enzymes are correlated with severity of metabolic syndrome in a large population based cohort. Sci Rep. 2015;5(1):1–9. https://doi.org/10.1038/srep13058.
Sanal MG, Paul K, Kumar S, Ganguly NK. Artificial intelligence and deep learning: the future of medicine and medical practice. J Assoc Physicians India. 2019;67(4):71–3.
Zhang A, Lipton ZC, Li M, Smola AJ. Dive into deep learning. 2020. https://d2l.ai.
Maniruzzaman M, Kumar N, Abedin MM, Islam MS, Suri HS, El-Baz AS, Suri JS. Comparative approaches for classification of diabetes mellitus data: machine learning paradigm. Comput Methods Programs Biomed. 2017;152:23–34. https://doi.org/10.1016/j.cmpb.2017.09.004.
Muhammad LJ, Algehyne EA, Usman SS. Predictive supervised machine learning models for diabetes mellitus. SN Comput Sci. 2020;1(5):1–10. https://doi.org/10.1007/s42979-020-00250-8.
Alghamdi M, Al-Mallah M, Keteyian S, Brawner C, Ehrman J, Sakr S. Predicting diabetes mellitus using smote and ensemble machine learning approach: the henry ford exercise testing (fit) project. PLoS ONE. 2017;12(7):e0179805. https://doi.org/10.1371/journal.pone.0179805.
Mokarram R, Emadi M. Classification in non-linear survival models using cox regression and decision tree. Ann Data Sci. 2017;4(3):329–40. https://doi.org/10.1007/s40745-017-0105-4.
Ivanova MT, Radoukova TI, Dospatliev LK, Lacheva MN. Ordinary least squared linear regression model for estimation of zinc in wild edible mushroom (Suillus luteus (L.) roussel). Bulg J Agric Sci. 2020;26(4):863–9.
Bernardini M, Morettini M, Romeo L, Frontoni E, Burattini L. Early temporal prediction of type 2 diabetes risk condition from a general practitioner electronic health record: a multiple instance boosting approach. Artif Intell Med. 2020;105:101847. https://doi.org/10.1016/j.artmed.2020.101847.
Xie J, Liu Y, Zeng X, Zhang W, Mei Z. A Bayesian network model for predicting type 2 diabetes risk based on electronic health records. Modern Phys Lett B. 2017;31(19–21):1740055. https://doi.org/10.1142/s0217984917400553.
Hertroijs DFL, Elissen AMJ, Brouwers MCGJ, Schaper NC, Köhler S, Popa MC, Asteriadis S, Hendriks SH, Bilo HJ, Ruwaard D, et al. A risk score including body mass index, glycated haemoglobin and triglycerides predicts future glycaemic control in people with type 2 diabetes. Diabetes Obes Metab. 2017;20(3):681–8. https://doi.org/10.1111/dom.13148.
Cole SR, Chu H, Greenland S. Maximum likelihood, profile likelihood, and penalized likelihood: a primer. Am J Epidemiol. 2013;179(2):252–60. https://doi.org/10.1093/aje/kwt245.
Brisimi TS, Xu T, Wang T, Dai W, Paschalidis IC. Predicting diabetes-related hospitalizations based on electronic health records. Stat Methods Med Res. 2018;28(12):3667–82. https://doi.org/10.1177/0962280218810911.
Moher D, Liberati A, Tetzlaff J, Altman DG. Preferred reporting items for systematic reviews and meta-analyses: the prisma statement. PLoS Med. 2009;6(7):e1000097. https://doi.org/10.1371/journal.pmed.1000097.
Kitchenham B, Brereton OP, Budgen D, Turner M, Bailey J, Linkman S. Systematic literature reviews in software engineering—a systematic literature review. Inf Softw Technol. 2009;51(1):7–15. https://doi.org/10.1016/j.infsof.2008.09.009.
Sambyal N, Saini P, Syal R. Microvascular complications in type-2 diabetes: a review of statistical techniques and machine learning models. Wirel Pers Commun. 2020;115(1):1–26. https://doi.org/10.1007/s11277-020-07552-3.
Islam MM, Yang H-C, Poly TN, Jian W-S, Li Y-CJ. Deep learning algorithms for detection of diabetic retinopathy in retinal fundus photographs: a systematic review and meta-analysis. Comput Methods Programs Biomed. 2020;191:105320. https://doi.org/10.1016/j.cmpb.2020.105320.
Chaki J, Ganesh ST, Cidham SK, Theertan SA. Machine learning and artificial intelligence based diabetes mellitus detection and self-management: a systematic review. J King Saud Univ Comput Inf Sci. 2020. https://doi.org/10.1016/j.jksuci.2020.06.013.
Silva KD, Lee WK, Forbes A, Demmer RT, Barton C, Enticott J. Use and performance of machine learning models for type 2 diabetes prediction in community settings: a systematic review and meta-analysis. Int J Med Inform. 2020;143:104268. https://doi.org/10.1016/j.ijmedinf.2020.104268.
Press G. Cleaning big data: most time-consuming, least enjoyable data science task, survey says. Forbes; 2016.
Prabhu P, Selvabharathi S. Deep belief neural network model for prediction of diabetes mellitus. In: 2019 3rd international conference on imaging, signal processing and communication (ICISPC). 2019. https://doi.org/10.1109/icispc.2019.8935838.
Albahli S. Type 2 machine learning: an effective hybrid prediction model for early type 2 diabetes detection. J Med Imaging Health Inform. 2020;10(5):1069–75. https://doi.org/10.1166/jmihi.2020.3000.
Maxwell A, Li R, Yang B, Weng H, Ou A, Hong H, Zhou Z, Gong P, Zhang C. Deep learning architectures for multi-label classification of intelligent health risk prediction. BMC Bioinform. 2017;18(S14):121–31. https://doi.org/10.1186/s12859-017-1898-z.
Nguyen BP, Pham HN, Tran H, Nghiem N, Nguyen QH, Do TT, Tran CT, Simpson CR. Predicting the onset of type 2 diabetes using wide and deep learning with electronic health records. Comput Methods Programs Biomed. 2019;182:105055. https://doi.org/10.1016/j.cmpb.2019.105055.
Arellano-Campos O, Gómez-Velasco DV, Bello-Chavolla OY, Cruz-Bautista I, Melgarejo-Hernandez MA, Muñoz-Hernandez L, Guillén LE, Garduño-Garcia JDJ, Alvirde U, Ono-Yoshikawa Y, et al. Development and validation of a predictive model for incident type 2 diabetes in middle-aged Mexican adults: the metabolic syndrome cohort. BMC Endocr Disord. 2019;19(1):1–10. https://doi.org/10.1186/s12902-019-0361-8.
You Y, Doubova SV, Pinto-Masis D, Pérez-Cuevas R, Borja-Aburto VH, Hubbard A. Application of machine learning methodology to assess the performance of DIABETIMSS program for patients with type 2 diabetes in family medicine clinics in Mexico. BMC Med Inform Decis Mak. 2019;19(1):1–15. https://doi.org/10.1186/s12911-019-0950-5.
Pham T, Tran T, Phung D, Venkatesh S. Predicting healthcare trajectories from medical records: a deep learning approach. J Biomed Inform. 2017;69:218–29. https://doi.org/10.1016/j.jbi.2017.04.001.
Spänig S, Emberger-Klein A, Sowa J-P, Canbay A, Menrad K, Heider D. The virtual doctor: an interactive clinical-decision-support system based on deep learning for non-invasive prediction of diabetes. Artif Intell Med. 2019;100:101706. https://doi.org/10.1016/j.artmed.2019.101706.
Wang T, Xuan P, Liu Z, Zhang T. Assistant diagnosis with Chinese electronic medical records based on CNN and BILSTM with phrase-level and word-level attentions. BMC Bioinform. 2020;21(1):1–16. https://doi.org/10.1186/s12859-020-03554-x.
Kim YD, Noh KJ, Byun SJ, Lee S, Kim T, Sunwoo L, Lee KJ, Kang S-H, Park KH, Park SJ, et al. Effects of hypertension, diabetes, and smoking on age and sex prediction from retinal fundus images. Sci Rep. 2020;10(1):1–14. https://doi.org/10.1038/s41598-020-61519-9.
Bernardini M, Romeo L, Misericordia P, Frontoni E. Discovering the type 2 diabetes in electronic health records using the sparse balanced support vector machine. IEEE J Biomed Health Inform. 2020;24(1):235–46. https://doi.org/10.1109/JBHI.2019.2899218.
Mei J, Zhao S, Jin F, Zhang L, Liu H, Li X, Xie G, Li X, Xu M. Deep diabetologist: learning to prescribe hypoglycemic medications with recurrent neural networks. Stud Health Technol Inform. 2017;245:1277. https://doi.org/10.3233/978-1-61499-830-3-1277.
Solares JRA, Canoy D, Raimondi FED, Zhu Y, Hassaine A, Salimi-Khorshidi G, Tran J, Copland E, Zottoli M, Pinho-Gomes A, et al. Long-term exposure to elevated systolic blood pressure in predicting incident cardiovascular disease: evidence from large-scale routine electronic health records. J Am Heart Assoc. 2019;8(12):e012129. https://doi.org/10.1161/jaha.119.012129.
Kumar PS, Pranavi S. Performance analysis of machine learning algorithms on diabetes dataset using big data analytics. In: 2017 international conference on infocom technologies and unmanned systems (trends and future directions) (ICTUS). 2017. https://doi.org/10.1109/ictus.2017.8286062.
Olivera AR, Roesler V, Iochpe C, Schmidt MI, Vigo A, Barreto SM, Duncan BB. Comparison of machine-learning algorithms to build a predictive model for detecting undiagnosed diabetes-ELSA-Brasil: accuracy study. Sao Paulo Med J. 2017;135(3):234–46. https://doi.org/10.1590/1516-3180.2016.0309010217.
Peddinti G, Cobb J, Yengo L, Froguel P, Kravić J, Balkau B, Tuomi T, Aittokallio T, Groop L. Early metabolic markers identify potential targets for the prevention of type 2 diabetes. Diabetologia. 2017;60(9):1740–50. https://doi.org/10.1007/s00125-017-4325-0.
Dutta D, Paul D, Ghosh P. Analysing feature importances for diabetes prediction using machine learning. In: 2018 IEEE 9th annual information technology, electronics and mobile communication conference (IEMCON). 2018. https://doi.org/10.1109/iemcon.2018.8614871.
Alhassan Z, Mcgough AS, Alshammari R, Daghstani T, Budgen D, Moubayed NA. Type-2 diabetes mellitus diagnosis from time series clinical data using deep learning models. In: artificial neural networks and machine learning—ICANN 2018 lecture notes in computer science. 2018. p. 468–78. https://doi.org/10.1007/978-3-030-01424-7_46.
Kuo K-M, Talley P, Kao Y, Huang CH. A multi-class classification model for supporting the diagnosis of type II diabetes mellitus. PeerJ. 2020;8:e9920. https://doi.org/10.7717/peerj.992.
Pimentel A, Carreiro AV, Ribeiro RT, Gamboa H. Screening diabetes mellitus 2 based on electronic health records using temporal features. Health Inform J. 2018;24(2):194–205. https://doi.org/10.1177/1460458216663023.
Talaei-Khoei A, Wilson JM. Identifying people at risk of developing type 2 diabetes: a comparison of predictive analytics techniques and predictor variables. Int J Med Inform. 2018;119:22–38. https://doi.org/10.1016/j.ijmedinf.2018.08.008.
Perveen S, Shahbaz M, Keshavjee K, Guergachi A. Metabolic syndrome and development of diabetes mellitus: predictive modeling based on machine learning techniques. IEEE Access. 2019;7:1365–75. https://doi.org/10.1109/access.2018.2884249.
Yuvaraj N, Sripreethaa KR. Diabetes prediction in healthcare systems using machine learning algorithms on Hadoop cluster. Cluster Comput. 2017;22(S1):1–9. https://doi.org/10.1007/s10586-017-1532-x.
Deo R, Panigrahi S. Performance assessment of machine learning based models for diabetes prediction. In: 2019 IEEE healthcare innovations and point of care technologies, (HI-POCT). 2019. https://doi.org/10.1109/hi-poct45284.2019.8962811.
Jakka A, Jakka VR. Performance evaluation of machine learning models for diabetes prediction. Int J Innov Technol Explor Eng Regular Issue. 2019;8(11):1976–80. https://doi.org/10.35940/ijitee.K2155.0981119.
Radja M, Emanuel AWR. Performance evaluation of supervised machine learning algorithms using different data set sizes for diabetes prediction. In: 2019 5th international conference on science in information technology (ICSITech). 2019. https://doi.org/10.1109/icsitech46713.2019.8987479.
Choi BG, Rha S-W, Kim SW, Kang JH, Park JY, Noh Y-K. Machine learning for the prediction of new-onset diabetes mellitus during 5-year follow-up in non-diabetic patients with cardiovascular risks. Yonsei Med J. 2019;60(2):191. https://doi.org/10.3349/ymj.2019.60.2.191.
Akula R, Nguyen N, Garibay I. Supervised machine learning based ensemble model for accurate prediction of type 2 diabetes. In: 2019 SoutheastCon. 2019. https://doi.org/10.1109/southeastcon42311.2019.9020358.
Xie Z, Nikolayeva O, Luo J, Li D. Building risk prediction models for type 2 diabetes using machine learning techniques. Prev Chronic Dis. 2019. https://doi.org/10.5888/pcd16.190109.
Lai H, Huang H, Keshavjee K, Guergachi A, Gao X. Predictive models for diabetes mellitus using machine learning techniques. BMC Endocr Disord. 2019;19(1):1–9. https://doi.org/10.1186/s12902-019-0436-6.
Abbas H, Alic L, Erraguntla M, Ji J, Abdul-Ghani M, Abbasi Q, Qaraqe M. Predicting long-term type 2 diabetes with support vector machine using oral glucose tolerance test. bioRxiv. 2019. https://doi.org/10.1371/journal.pone.0219636.
Sarker I, Faruque M, Alqahtani H, Kalim A. K-nearest neighbor learning based diabetes mellitus prediction and analysis for ehealth services. EAI Endorsed Trans Scalable Inf Syst. 2020. https://doi.org/10.4108/eai.13-7-2018.162737.
Cahn A, Shoshan A, Sagiv T, Yesharim R, Goshen R, Shalev V, Raz I. Prediction of progression from pre-diabetes to diabetes: development and validation of a machine learning model. Diabetes Metab Res Rev. 2020;36(2):e3252. https://doi.org/10.1002/dmrr.3252.
Garcia-Carretero R, Vigil-Medina L, Mora-Jimenez I, Soguero-Ruiz C, Barquero-Perez O, Ramos-Lopez J. Use of a k-nearest neighbors model to predict the development of type 2 diabetes within 2 years in an obese, hypertensive population. Med Biol Eng Comput. 2020;58(5):991–1002. https://doi.org/10.1007/s11517-020-02132-w.
Zhang L, Wang Y, Niu M, Wang C, Wang Z. Machine learning for characterizing risk of type 2 diabetes mellitus in a rural Chinese population: the Henan rural cohort study. Sci Rep. 2020;10(1):1–10. https://doi.org/10.1038/s41598-020-61123-x.
Haq AU, Li JP, Khan J, Memon MH, Nazir S, Ahmad S, Khan GA, Ali A. Intelligent machine learning approach for effective recognition of diabetes in e-healthcare using clinical data. Sensors. 2020;20(9):2649. https://doi.org/10.3390/s20092649.
Yang T, Zhang L, Yi L, Feng H, Li S, Chen H, Zhu J, Zhao J, Zeng Y, Liu H, et al. Ensemble learning models based on noninvasive features for type 2 diabetes screening: model development and validation. JMIR Med Inform. 2020;8(6):e15431. https://doi.org/10.2196/15431.
Ahn H-S, Kim JH, Jeong H, Yu J, Yeom J, Song SH, Kim SS, Kim IJ, Kim K. Differential urinary proteome analysis for predicting prognosis in type 2 diabetes patients with and without renal dysfunction. Int J Mol Sci. 2020;21(12):4236. https://doi.org/10.3390/ijms21124236.
Sarwar MA, Kamal N, Hamid W, Shah MA. Prediction of diabetes using machine learning algorithms in healthcare. In: 2018 24th international conference on automation and computing (ICAC). 2018. https://doi.org/10.23919/iconac.2018.8748992.
Zou Q, Qu K, Luo Y, Yin D, Ju Y, Tang H. Predicting diabetes mellitus with machine learning techniques. Front Genet. 2018;9:515. https://doi.org/10.3389/fgene.2018.00515.
Farran B, AlWotayan R, Alkandari H, Al-Abdulrazzaq D, Channanath A, Thanaraj TA. Use of non-invasive parameters and machine-learning algorithms for predicting future risk of type 2 diabetes: a retrospective cohort study of health data from Kuwait. Front Endocrinol. 2019;10:624. https://doi.org/10.3389/fendo.2019.00624.
Xiong X-L, Zhang R-X, Bi Y, Zhou W-H, Yu Y, Zhu D-L. Machine learning models in type 2 diabetes risk prediction: results from a cross-sectional retrospective study in Chinese adults. Curr Med Sci. 2019;39(4):582–8. https://doi.org/10.1007/s11596-019-2077-4.
Dinh A, Miertschin S, Young A, Mohanty SD. A data-driven approach to predicting diabetes and cardiovascular disease with machine learning. BMC Med Inform Decis Mak. 2019;19(1):1–15. https://doi.org/10.1186/s12911-019-0918-5.
Liu Y, Ye S, Xiao X, Sun C, Wang G, Wang G, Zhang B. Machine learning for tuning, selection, and ensemble of multiple risk scores for predicting type 2 diabetes. Risk Manag Healthc Policy. 2019;12:189–98. https://doi.org/10.2147/rmhp.s225762.
Tang Y, Gao R, Lee HH, Wells QS, Spann A, Terry JG, Carr JJ, Huo Y, Bao S, Landman BA, et al. Prediction of type II diabetes onset with computed tomography and electronic medical records. In: Multimodal learning for clinical decision support and clinical image-based procedures. Cham: Springer; 2020. p. 13–23. https://doi.org/10.1007/978-3-030-60946-7_2.
Maniruzzaman M, Rahman MJ, Ahammed B, Abedin MM. Classification and prediction of diabetes disease using machine learning paradigm. Health Inf Sci Syst. 2020;8(1):1–14. https://doi.org/10.1007/s13755-019-0095-z.
Boutilier JJ, Chan TCY, Ranjan M, Deo S. Risk stratification for early detection of diabetes and hypertension in resource-limited settings: machine learning analysis. J Med Internet Res. 2021;23(1):20123. https://doi.org/10.2196/20123.
Li J, Chen Q, Hu X, Yuan P, Cui L, Tu L, Cui J, Huang J, Jiang T, Ma X, Yao X, Zhou C, Lu H, Xu J. Establishment of noninvasive diabetes risk prediction model based on tongue features and machine learning techniques. Int J Med Inform. 2021;149:104429. https://doi.org/10.1016/j.ijmedinf.2021.10442.
Lam B, Catt M, Cassidy S, Bacardit J, Darke P, Butterfield S, Alshabrawy O, Trenell M, Missier P. Using wearable activity trackers to predict type 2 diabetes: machine learning-based cross-sectional study of the UK biobank accelerometer cohort. JMIR Diabetes. 2021;6(1):23364. https://doi.org/10.2196/23364.
Deberneh HM, Kim I. Prediction of Type 2 diabetes based on machine learning algorithm. Int J Environ Res Public Health. 2021;18(6):3317. https://doi.org/10.3390/ijerph1806331.
He Y, Lakhani CM, Rasooly D, Manrai AK, Tzoulaki I, Patel CJ. Comparisons of polyexposure, polygenic, and clinical risk scores in risk prediction of type 2 diabetes. Diabetes Care. 2021;44(4):935–43. https://doi.org/10.2337/dc20-2049.
García-Ordás MT, Benavides C, Benítez-Andrades JA, Alaiz-Moretón H, García-Rodríguez I. Diabetes detection using deep learning techniques with oversampling and feature augmentation. Comput Methods Programs Biomed. 2021;202:105968. https://doi.org/10.1016/j.cmpb.2021.105968.
Kanimozhi N, Singaravel G. Hybrid artificial fish particle swarm optimizer and kernel extreme learning machine for type-II diabetes predictive model. Med Biol Eng Comput. 2021;59(4):841–67. https://doi.org/10.1007/s11517-021-02333-x.
Ravaut M, Sadeghi H, Leung KK, Volkovs M, Kornas K, Harish V, Watson T, Lewis GF, Weisman A, Poutanen T, et al. Predicting adverse outcomes due to diabetes complications with machine learning using administrative health data. NPJ Digit Med. 2021;4(1):1–12. https://doi.org/10.1038/s41746-021-00394-8.
De Silva K, Lim S, Mousa A, Teede H, Forbes A, Demmer RT, Jonsson D, Enticott J. Nutritional markers of undiagnosed type 2 diabetes in adults: findings of a machine learning analysis with external validation and benchmarking. PLoS ONE. 2021;16(5):e0250832. https://doi.org/10.1371/journal.pone.025083.
Kim H, Lim DH, Kim Y. Classification and prediction on the effects of nutritional intake on overweight/obesity, dyslipidemia, hypertension and type 2 diabetes mellitus using deep learning model: 4–7th Korea national health and nutrition examination survey. Int J Environ Res Public Health. 2021;18(11):5597. https://doi.org/10.3390/ijerph18115597.
Vangeepuram N, Liu B, Chiu P-H, Wang L, Pandey G. Predicting youth diabetes risk using NHANES data and machine learning. Sci Rep. 2021;11(1):1. https://doi.org/10.1038/s41598-021-90406-.
Recenti M, Ricciardi C, Edmunds KJ, Gislason MK, Sigurdsson S, Carraro U, Gargiulo P. Healthy aging within an image: using muscle radiodensitometry and lifestyle factors to predict diabetes and hypertension. IEEE J Biomed Health Inform. 2021;25(6):2103–12. https://doi.org/10.1109/JBHI.2020.304415.
Ramesh J, Aburukba R, Sagahyroon A. A remote healthcare monitoring framework for diabetes prediction using machine learning. Healthc Technol Lett. 2021;8(3):45–57. https://doi.org/10.1049/htl2.12010.
Lama L, Wilhelmsson O, Norlander E, Gustafsson L, Lager A, Tynelius P, Wärvik L, Östenson C-G. Machine learning for prediction of diabetes risk in middle-aged Swedish people. Heliyon. 2021;7(7):e07419. https://doi.org/10.1016/j.heliyon.2021.e07419.
Shashikant R, Chaskar U, Phadke L, Patil C. Gaussian process-based kernel as a diagnostic model for prediction of type 2 diabetes mellitus risk using non-linear heart rate variability features. Biomed Eng Lett. 2021;11(3):273–86. https://doi.org/10.1007/s13534-021-00196-7.
Kalagotla SK, Gangashetty SV, Giridhar K. A novel stacking technique for prediction of diabetes. Comput Biol Med. 2021;135:104554. https://doi.org/10.1016/j.compbiomed.2021.104554.
Moon S, Jang J-Y, Kim Y, Oh C-M. Development and validation of a new diabetes index for the risk classification of present and new-onset diabetes: multicohort study. Sci Rep. 2021;11(1):1–10. https://doi.org/10.1038/s41598-021-95341-8.
Ihnaini B, Khan MA, Khan TA, Abbas S, Daoud MS, Ahmad M, Khan MA. A smart healthcare recommendation system for multidisciplinary diabetes patients with data fusion based on deep ensemble learning. Comput Intell Neurosci. 2021;2021:1–11. https://doi.org/10.1155/2021/4243700.
Rufo DD, Debelee TG, Ibenthal A, Negera WG. Diagnosis of diabetes mellitus using gradient boosting machine (LightGBM). Diagnostics. 2021;11(9):1714. https://doi.org/10.3390/diagnostics11091714.
Haneef R, Fuentes S, Fosse-Edorh S, Hrzic R, Kab S, Cosson E, Gallay A. Use of artificial intelligence for public health surveillance: a case study to develop a machine learning-algorithm to estimate the incidence of diabetes mellitus in France. Arch Public Health. 2021. https://doi.org/10.21203/rs.3.rs-139421/v1.
Wei H, Sun J, Shan W, Xiao W, Wang B, Ma X, Hu W, Wang X, Xia Y. Environmental chemical exposure dynamics and machine learning-based prediction of diabetes mellitus. Sci Tot Environ. 2022;806:150674. https://doi.org/10.1016/j.scitotenv.2021.150674.
Leerojanaprapa K, Sirikasemsuk K. Comparison of Bayesian networks for diabetes prediction. In: International conference on computer, communication and computational sciences (IC4S), Bangkok, Thailand, Oct 20–21, 2018. 2019;924:425–434. https://doi.org/10.1007/978-981-13-6861-5_37.
Subbaiah S, Kavitha M. Random forest algorithm for predicting chronic diabetes disease. Int J Life Sci Pharma Res. 2020;8:4–8.
Thenappan S, Rajkumar MV, Manoharan PS. Predicting diabetes mellitus using modified support vector machine with cloud security. IETE J Res. 2020. https://doi.org/10.1080/03772063.2020.178278.
Sneha N, Gangil T. Analysis of diabetes mellitus for early prediction using optimal features selection. J Big Data. 2019;6(1):1–19. https://doi.org/10.1186/s40537-019-0175-6.
Jain S. A supervised model for diabetes divination. Biosci Biotechnol Res Commun. 2020;13(14, SI):315–8. https://doi.org/10.21786/bbrc/13.14/7.
Syed AH, Khan T. Machine learning-based application for predicting risk of type 2 diabetes mellitus (T2DM) in Saudi Arabia: a retrospective cross-sectional study. IEEE Access. 2020;8:199539–61. https://doi.org/10.1109/ACCESS.2020.303502.
Nuankaew P, Chaising S, Temdee P. Average weighted objective distance-based method for type 2 diabetes prediction. IEEE Access. 2021;9:137015–28. https://doi.org/10.1109/ACCESS.2021.311726.
Samreen S. Memory-efficient, accurate and early diagnosis of diabetes through a machine learning pipeline employing crow search-based feature engineering and a stacking ensemble. IEEE Access. 2021;9:134335–54. https://doi.org/10.1109/ACCESS.2021.311638.
Fazakis N, Kocsis O, Dritsas E, Alexiou S, Fakotakis N, Moustakas K. Machine learning tools for long-term type 2 diabetes risk prediction. IEEE Access. 2021;9:103737–57. https://doi.org/10.1109/ACCESS.2021.309869.
Omana J, Moorthi M. Predictive analysis and prognostic approach of diabetes prediction with machine learning techniques. Wirel Pers Commun. 2021. https://doi.org/10.1007/s11277-021-08274-w.
Ravaut M, Harish V, Sadeghi H, Leung KK, Volkovs M, Kornas K, Watson T, Poutanen T, Rosella LC. Development and validation of a machine learning model using administrative health data to predict onset of type 2 diabetes. JAMA Netw Open. 2021;4(5):2111315. https://doi.org/10.1001/jamanetworkopen.2021.11315.
Lang L-Y, Gao Z, Wang X-G, Zhao H, Zhang Y-P, Sun S-J, Zhang Y-J, Austria RS. Diabetes prediction model based on deep belief network. J Comput Methods Sci Eng. 2021;21(4):817–28. https://doi.org/10.3233/JCM-20465.
Gupta H, Varshney H, Sharma TK, Pachauri N, Verma OP. Comparative performance analysis of quantum machine learning with deep learning for diabetes prediction. Complex Intell Syst. 2021. https://doi.org/10.1007/s40747-021-00398-7.
Roy K, Ahmad M, Waqar K, Priyaah K, Nebhen J, Alshamrani SS, Raza MA, Ali I. An enhanced machine learning framework for type 2 diabetes classification using imbalanced data with missing values. Complexity. 2021. https://doi.org/10.1155/2021/995331.
Zhang L, Wang Y, Niu M, Wang C, Wang Z. Nonlaboratory-based risk assessment model for type 2 diabetes mellitus screening in Chinese rural population: a joint bagging-boosting model. IEEE J Biomed Health Inform. 2021;25(10):4005–16. https://doi.org/10.1109/JBHI.2021.307711.
Turnea M, Ilea M. Predictive simulation for type II diabetes using data mining strategies applied to Big Data. In: Romanian Advanced Distributed Learning Association; Univ Natl Aparare Carol I; European Secur & Def Coll; Romania Partnership Ctr. 14th international scientific conference on eLearning and software for education - eLearning challenges and new horizons, Bucharest, Romania, Apr 19-20, 2018. 2018. p. 481-486. https://doi.org/10.12753/2066-026X-18-213.
Vettoretti M, Di Camillo B. A variable ranking method for machine learning models with correlated features: in-silico validation and application for diabetes prediction. Appl Sci. 2021;11(16):7740. https://doi.org/10.3390/app11167740.
Acknowledgements
We would like to thank Vicerrectoría de Investigación y Posgrado, the Research Group of Product Innovation, and the Cyber Learning and Data Science Laboratory, and the School of Engineering and Science of Tecnologico de Monterrey.
Funding
This study was funded by Vicerrectoría de Investigación y Posgrado and the Research Group of Product Innovation of Tecnologico de Monterrey, by a scholarship provided by Tecnologico de Monterrey to graduate student A01339273 Luis Fregoso-Aparicio, and a national scholarship granted by the Consejo Nacional de Ciencia y Tecnologia (CONACYT) to study graduate programs in institutions enrolled in the Padron Nacional de Posgrados de Calidad (PNPC) to CVU 962778 - Luis Fregoso-Aparicio.
Author information
Authors and Affiliations
Contributions
Individual contributions are the following; conceptualization, methodology, and investigation: LF-A and JN; validation: LM and JAGG; writing—original draft preparation and visualization: LF-A; writing—review and editing: LM and JN; supervision: JAG-G; project administration: JN; and funding acquisition: LF and JN. All authors read and approved the final manuscript.
Corresponding author
Ethics declarations
Ethics approval and consent to participate
Not applicable.
Consent for publication
Not applicable.
Competing interests
The authors declare that they have no competing interests.
Additional information
Publisher's Note
Springer Nature remains neutral with regard to jurisdictional claims in published maps and institutional affiliations.
Rights and permissions
Open Access This article is licensed under a Creative Commons Attribution 4.0 International License, which permits use, sharing, adaptation, distribution and reproduction in any medium or format, as long as you give appropriate credit to the original author(s) and the source, provide a link to the Creative Commons licence, and indicate if changes were made. The images or other third party material in this article are included in the article's Creative Commons licence, unless indicated otherwise in a credit line to the material. If material is not included in the article's Creative Commons licence and your intended use is not permitted by statutory regulation or exceeds the permitted use, you will need to obtain permission directly from the copyright holder. To view a copy of this licence, visit http://creativecommons.org/licenses/by/4.0/. The Creative Commons Public Domain Dedication waiver (http://creativecommons.org/publicdomain/zero/1.0/) applies to the data made available in this article, unless otherwise stated in a credit line to the data.
About this article

Cite this article
Fregoso-Aparicio, L., Noguez, J., Montesinos, L. et al. Machine learning and deep learning predictive models for type 2 diabetes: a systematic review. Diabetol Metab Syndr 13, 148 (2021). https://doi.org/10.1186/s13098-021-00767-9
Received:
Accepted:
Published:
DOI: https://doi.org/10.1186/s13098-021-00767-9