
Abstract
Background
Endogenous Retroviruses (ERVs) are retroviruses that over the course of evolution have integrated into germline cells and eventually become part of the host genome. They proliferate within the germline of their host, making up ~5% of the human and mouse genome sequences. Several lines of evidence have suggested a decline in the rate of ERV integration into the human genome in recent evolutionary history but this has not been investigated quantitatively or possible causes explored.
Results
By dating the integration of ERV loci in 40 mammal species, we show that the human genome and that of other hominoids (great apes and gibbons) have experienced an approximately four-fold decline in the ERV integration rate over the last 10 million years. A major cause is the recent extinction of one very large ERV lineage (HERV-H), which is responsible for most of the integrations over the last 30 million years. The decline however affects most other ERV lineages. Only about 10% of the decline might be attributed to an accompanying increase in body mass (a trait we have shown recently to be negatively correlated with ERV integration rate). Humans are unusual compared to related species – Old World monkeys, great apes and gibbons – in (a) having not acquired any new ERV lineages during the last 30 million years and (b) the possession of an old ERV lineage that has continued to replicate up until at least the last few hundred thousand years – the potentially medically significant HERVK(HML2).
Conclusions
The human genome shares with the genome of other great apes and gibbons a recent decline in ERV integration that is not typical of other primates and mammals. The human genome differs from that of related species both in maintaining up until at least recently a replicating old ERV lineage and in not having acquired any new lineages. We speculate that the decline in ERV integration in the human genome has been exacerbated by a relatively low burden of horizontally-transmitted retroviruses and subsequent reduced risk of endogenization.
Background
Retroviral replication involves integration into a chromosome of the host cell. Over the last 100 million years (my), retroviruses have repeatedly integrated into germline cells of their host and thus become incorporated into the host genome [1]. Such Endogenous Retroviruses (ERVs) can be grouped into families [2], each one representing the subsequent proliferation of an independent infection of the host genome. Each viral integration is referred to here as a locus, and these loci inevitably accumulate mutations at the host background level, gaining frameshifts and premature stop codons that make them replication-deficient. It is only by the continual copying of loci that the family persists through evolutionary time. There are ~100,000 ERV loci in ~50 families (also called groups) in the human genome [3,4] making up ~5% of the total sequence (>8% if the other transposable elements called MaLRs are included) [5].
Despite being pathogenic in other animals, and retroviruses typically being oncogenic, no causal link with human disease has been proven [6,7]. This apparent benignness might be the result of a slow down in the rate of ERV integration. The early genome sequencing projects suggested that in recent evolutionary history ERVs have been much less active, in the sense of producing new loci, in humans than mice [8], and no human ERV locus is known that is capable of replication. For example, no instances of integration within somatic tissues by human ERVs have been observed whereas so-called insertional mutagenesis is a well understood mechanism by which some ERV loci cause cancer in laboratory mice. Whether humans are unusual in their level of ERV integration has not been systematically investigated.
Although published genome sequences are sometimes a composite made by combining different regions from different individuals, each sequence can be thought of as representing the genome of a single (haploid) individual. There is no known mechanism to precisely excise ERV loci, so the genome contains a record of the history of ERV integrations that have drifted to fixation, albeit one where because of recombination each region is randomly drawn from the population. Many loci that are unfixed in the species will not be in the genome sequence, but these loci will have integrated relatively recently, e.g. the mean time for a neutral allele to drift to fixation is ~800,000 years in the ancestral human population [9]. We date the integration of ERV loci using several methods [10]: (i) nucleotide divergence within the locus, (ii) divergence from other loci in the same genome and (iii) the presence or absence of the locus in related host species. Counting the number of integrations that have taken place in each genome during a given time period allows us, if we assume that selection acting on ERVs is similar across species, to then compare ERV integration rates.
Here we measure the rate of ERV integration in the genome of ancestral humans and other catarrhine primates (Old World monkeys, great apes and gibbons). Multiple catarrhine genomes have been sequenced and their ERVs are well characterized, allowing integrations to be dated accurately. We also compare the integration rates across a diverse range of other mammals using a more approximate method that does not require such characterization. We attempt to explain the patterns using viral and host life-history factors that we have shown previously to be correlated with the ERV integration rate [11,12], and examine in detail the family HERVK(HML2) [13], called here HK2 for brevity. This is the only family that has continued to replicate in the human population until at least ~250,000 years ago [14]. The family is important because expression of HK2 proteins is upregulated in a range of diseases, although it is not known whether it is involved in their causality or is a result of their pathophysiology [15-17]. This upregulation also raises the possibility of HK2 loci serving as immunotherapy targets in cancer and HIV therapy [18-20].
We report a steep decline over the last ~10 million years in the ERV integration rate within humans and other hominoids (great apes and gibbons) compared to Old World Monkeys and other mammals. This decline is attributable largely, although not entirely, to the extinction of one very large family (whose replication cycle we have previously shown to be associated with increased proliferation). The HK2 family in humans, however, represents a possibly unique persistence of a replicating family from the origin of the catarrhines. Another feature of the human genome, shared only with the orangutan, is the absence of any new ERV families, and we discuss possible reasons for this.
Results
ERV integration rate has declined in humans and other hominoids
We extracted the nucleotide sequences of all ERV loci in the catarrhine genomes and dated the more intact ones by first calculating a rate of nucleotide divergence in representative loci, and then applying this to the divergence between their LTRs (Long Terminal Repeats). The LTRs are regions at either end of the full-length integrated virus (provirus) that are identical at integration but gradually diverge through time with the accumulation of mutations. We see a striking decline in the rate of ERV integration during the last ~10my in the genomes of all sequenced hominoids (great apes and gibbons) but not in the Old World monkeys (Cercopithecidae) (Figure 1). The decline in the human genome since the divergence from the chimpanzee is similar to that of other hominoids, e.g. showing a similar ratio of the number of loci that integrated before and after that event (Table 1). The difference in Table 1 among hominoids can probably be attributed to differing methods and quality of genome sequencing and assembly, e.g. the number of loci in the human, chimpanzee, bonobo and gorilla genomes that are older than 8my should by definition be identical – as until this time they share the same genome – but in our analyses they differ, with the gorilla being particularly low (Additional file 1: Figure S1). Converting the numbers of loci in Table 1 into a rate shows a 73% decline in the human genome over the last 6.6my compared to the preceding 25.0my.

Rate of ERV integration in the sequenced catarrhines. Branch thickness shows the number of loci estimated to have integrated at different times, with each increment corresponding to a period of two million years. Integration dates are estimated by LTR divergence (except in the poorly assembled baboon, where they are estimated using a nearest neighbor analysis). Numbers of loci have been normalized using the human genome as a reference to allow for variation in quality of genome assembly as follows: branch thickness leading to human is calculated from the human genome; other branch thicknesses are adjusted proportional to a comparison between (i) the number of loci that integrated into the human genome and (ii) the number that integrated into the second species’ genome during the time period when the genome was shared. The baboon was similarly normalized using the macaque instead of the human genome. Data for each species are shown as frequency histograms in Additional file 1: Figure S1.
In Figure 2 we show these changes at the level of individual ERV families and observe the following.

Age and number of ERV integrations in the human and other representative catarrhine genomes. Loci analysed were all full-length and dated using LTR divergence.
-
(1)
The overall changes in the hominoids are dominated by the changes within one family, HERV-H: e.g. it makes up 88% of all the ERV integrations into the human genome within the last 30my. It is the recent extinction of this megafamily, defined as a family that is abnormally large typically as a result of adopting an entirely intracellular replication cycle [11], that produces the steep decline in the overall rate over the last 10my. This decline occurs independently in the separate hominoid lineages: e.g. human, orangutan and gibbon. Most other families also decline, as shown for example by the ‘other’ category in the human plot, which contains another 15 families (the remaining known ERV families are too old and their loci too degraded to have been included here).
-
(2)
In the human genome, we see a decline over time in the integration rate of all families except one, HK2 (the apparent recent increase is explained below). This family entered the genome of the ancestral catarrhine 32–44 million years ago (mya), i.e. after the split from the New World monkeys and before the split from the Old World monkeys [21]. Several lines of evidence show this family to have been replicating in the human population up until at least the last few hundred thousand years. However, the sister lineages of HK2 in most other catarrhines appear to have gone extinct. The youngest HK2 locus we found in the chimpanzee was ~3my old, although two loci in the more poorly assembled bonobo genome might be younger. Elsewhere the youngest we found were dated to 4mya (macaque), 7mya (orangutan), 10mya (gorilla) and 13mya (gibbon). Limitations of the baboon genome assembly does not allow loci to be dated using their LTRs but our nearest neighbor method of dating loci reveals no recent HK2 integrations (data not shown).
-
(3)
The HK2 family is the only family we found that has continued to replicate since the origin of the catarrhines. All other old families appear to have gone extinct, lacking loci with identical or very similar LTRs and lacking short branches on the dendrograms showing the sequence similarity of ERV loci in individual genomes (Figure 3). We did find occasional loci with identical LTRs from families otherwise represented only by older loci, but we assume these represent either chance identity between short (~100 nucleotide) fragments of LTR or instances of gene conversion (see Methods).
Figure 3 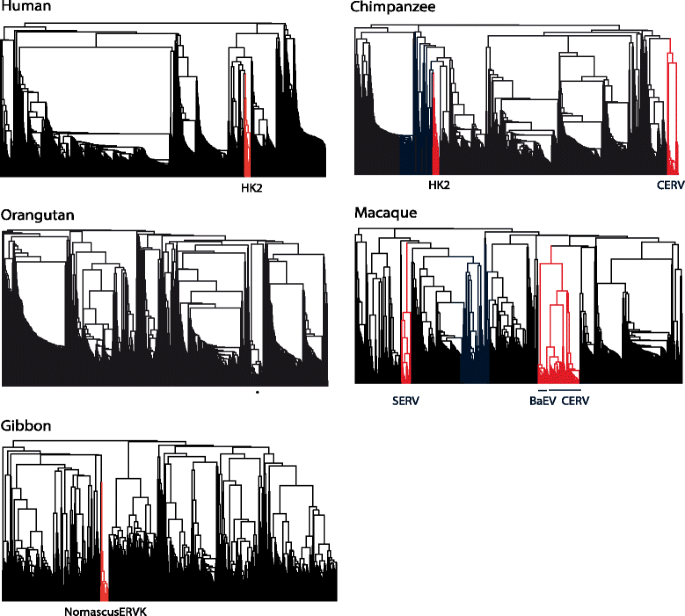
Dendrogram of loci in selected catarrhines. Recently copying families plus HK2 in the human and chimpanzee genomes are shown in red. Families such as BaEV show bursts of copying restricted to near the tree tip. For clarity, we excluded loci that had integrated before the origin of the catarrhines. The asterisk in the orangutan shows a clade of loci detected only in unassembled parts of the X chromosome and chromosome 1. These possibly represent loci within repeat regions that have been copied by the host, or assembly errors.
-
(4)
Excluding HK2, other recent integrations are all from recently acquired families. In the hominoids, all other integrations within the last two million years come from two families with restricted taxonomic distributions showing that the family is derived from genome infections after the origin of the catarrhines: (i) CERV (Chimpanzee ERV), also known as PtERV (Pan troglodytes ERV), was discovered in the genomes of the chimpanzee and gorilla but is not in the human or orangutan genome [22], and (ii) a new type II family we found that was restricted to the gibbon (labelled NomascusERVK in Figure 3). Similarly, although the macaque and baboon genomes have many recently integrated ERV loci, these are all from younger families. In the macaque, we have three families (or groups of closely related families): (i) a close relative of CERV, (ii) BaEV (Baboon Endogenous Virus), which was first described from several baboon species [23], and (iii) SERV (Simian Endogenous type D Retrovirus) [24]. The baboon has the recent families found in the macaque plus its own undescribed type II family (the poor assembly of the baboon genome does not allow us to characterize this family).

Hominoid decline is greater than in non-hominoid mammals
This decline in the rate of ERV integration in the hominoid genomes is generally greater than that observed in a diverse range of other mammals (Table 2), including other primates. In this reanalysis of data from a previous study [11] (with the addition of the gibbon but not the bonobo), we compare the number of loci estimated to have integrated in similar time periods to those in Table 1. Because the ERVs in many non-catarrhine genomes have not been studied, we had to use both a cruder mining technique, merely recovering a region of the conserved pol gene from each locus, and a more approximate method to date the loci using only this information (“nearest neighbor” – see Methods). In the absence of lineage-specific data, we also had to employ a single mammalian nucleotide substitution rate. Considering the catarrhine species, the results of this analysis are poorly correlated to the results of our more detailed analysis shown in Table 1, with up a six-fold difference in the ratio of young to old loci (orangutan). We suspect that there are a number of artifacts here, e.g. the clade of apparently recently integrated loci in the orangutan (Figure 3) that are only in unassembled parts of the X chromosome and chromosome 1. Nevertheless, this second analysis shows the same general trend: the mean ratio of young to old loci in the hominoids was 0.16 (n = 5) compared to a mean of 0.83 in the non-hominoids (n = 34). This difference is significant (Wilcoxon rank sum test, p-value = 0.002) and remains so even if the human genome, with the lowest ratio of young to old loci observed in any mammal, is excluded (P = 0.010).
Confirming that HK2 is an exception to the general hominoid decline
Figures 1 and 2 include only those ERV loci that have retained both of their LTRs, but most ERV loci are represented by a relic structure called a solo LTR. A solo LTR is formed by a crossover between the two LTRs that leads to the excision of the entire internal (protein-coding) region, leaving only a chimeric structure containing the LTR regions that lay outside of the crossover. There is no known mechanism to precisely excise a solo LTR, so we were able to confirm the results of the above analysis as follows. We first extracted the genomic regions that flanked loci in the human genome, and then searched for these flanking regions in other catarrhine genomes. This allowed us to determine whether or not the homologous ERV locus was present or absent. Using this procedure we found 54 HK2 loci (including both full-length and solo LTRs) in the human genome that were absent in the macaque (i.e. represented by the pre-integration site) and which we could score as either present or absent in the chimpanzee (Table 3). For each of these loci we therefore know whether they integrated either (a) after the divergence of human from macaque but before the divergence from chimpanzee (6.6-31.6mya), or (b) after the divergence of human from chimpanzee (<6.6mya). The proportion of the 54 loci that fall into these two groups is very close to that predicted if we assumed a constant rate of integration during our entire 31.6my time period. In contrast, we find a decline among the other ERV families – treated here as one group – since the divergence from the chimpanzee. Although the sample size is small, the difference is significant (Fisher’s Exact Test; P < 0.01). This analysis also suggests that the apparent recent increase in HK2 integration rate in Figure 2 is an artifact caused by only considering full-length loci. We expect a higher proportion of recently integrated loci to be full-length because they have had less time in the genome than old loci in which to undergo recombination and form solo LTRs (and thus be lost to our main analysis). The rate of this recombinational deletion in HK2 decreases with age [25] but that will only affect the magnitude and not the direction of the bias. It has also been observed in multiple mice ERV lineages that the proportion of loci represented by full-length proviruses (rather than by solo LTRs) is higher among more recent integrations [26]. That study showed that some ERV integrations have been deleterious, and this might have selected for the process of recombinational deletion.
Discussion
Our analysis shows a steep decline over the last 10my in the rate of ERV integration in the genomes of human and other hominoids, which might account at least in part for the absence of proven pathogenicity of ERVs in humans. What has caused this decline? We have previously shown that two traits, one host and one viral, are correlated with the ERV integration rate: smaller mammals tend to have more ERVs [12] and loss of the env gene leads to greater replication of ERV families [11]. Below we consider in turn the evidence for the possible involvement of these two traits in the observed decline.
Analysing data from the Katzourakis et al. study [12] shows that a doubling in body mass is associated with an approximate 10% reduction in ERV number. Fossil evidence shows that the human lineage has increased in body mass over our time period. The earliest fossil catarrhine species, proconsuloids from the early Miocene (23-16mya), varied greatly in body mass, ranging from an estimated 5 to 75 kg [27], but none of the fossil species from later periods that may represent ancestors of the great apes are as small as the smallest proconsuloids – the 17 kg for a specimen of Nacholapithecus kerioi from 15mya [28] being the smallest body mass estimate we can find. The more recent fossil species that may be directly ancestral to humans are all at least 33 kg [29]. From the origin of the great apes we observe therefore at most a five-fold increase in mass, which – even assuming a causal link behind the association – would only lead to a decrease in ERV number of approximately 25% rather than the observed four-fold decrease (Figure 1). We also observe a marked decline in ERV integration in the small-bodied gibbon.
The decline of the ERV integration rate in the hominoid lineage can be chiefly attributed to the gradual extinction during this time period of the HERV-H family. The domination of the ERV community in mammals by a few such megafamilies is typically achieved by the degradation and loss of the viral attachment gene (env), with an inferred switch to an entirely intra-cellular life cycle and increase in integration rate [11]. It has been suggested that in HERV-H this pattern is complicated by in trans complementation [6]. More reconstruction of the past replication method in this family might reveal additional viral factors than could explain the scale of the decline in ERV integration in hominoids. Similarly, when more mammal genomes are available, larger comparative analyses might identify changes in hominoid biology (in addition to body size) that are associated with reduced ERV integration rate.
In contrast, the small env-containing family, HK2, may have continued to replicate exclusively in humans. The apparent extinction of the sister lineage of HK2 in the macaque is significant as this lineage is being investigated as a model for testing a possible ERV-based immunotherapy for HIV in humans [20,30,31]. The extinction explains why other studies have reported finding only a few full-length ORFs in this family [20,30]. An earlier bioinformatic study [32] reported finding HK2 loci in the macaque that had identical LTRs, suggesting they were very recent integrations, but we cannot confirm the existence of such loci.
ERV families do not appear to be able to maintain themselves indefinitely and eventually die, ceasing to create new loci and with their existing loci eventually losing the ability to replicate as they accrue mutations. The birth of new families is therefore essential for the persistence of ERV replication in host genomes. Part of the overall decline of ERV integration in the human genome is the absence of any new families being acquired during the 32my history of the catarrhines. All the analyzed non-human catarrhines except the orangutan have acquired at least one new ERV family. As previously mentioned, ERV families are assumed to be derived from an initial infection of the germline by an exogenous (horizontally-transmitted) retrovirus (XRV), and ERVs can be viewed as a fossil record of retroviral activity through time [6]. The striking decline of the ERV integration rate in humans could thus be due to a lower risk of XRV infection (horizontal transmission) as well as a lower level of genomic replication (vertical transmission). Is there evidence for a lower XRV load in humans compared to, for example, other catarrhines? While the XRV load in humans is well known, data on wild catarrhines are patchy and we are not aware of any systematic comparison of XRV burden. Nevertheless our examination of the literature suggests that humans do have an unusually low XRV load. There are only two human XRVs (HIV and HTLV), both globally at less than 1% prevalence; in contrast, XRVs such as the foamy (SFVs), immunodeficiency (SIVs) and T-lymphotropic viruses (STLVs) appear to be common in non-human catarrhines and typically at higher prevalence [33]. The viral lineage from which the various HIVs are derived, called SIV, although not ubiquitous in catarrhines is often found at a much higher prevalence. For example, the long study of the Central Chimpanzee subspecies (P. t. troglodytes), from which HIV-1 was acquired, in the Gombe National Park, Tanzania, found the prevalence to fluctuate between 9 and 18% [34]; other studies found prevalence of 13% in Eastern Chimpanzees (P. t. schweinfurthii) [35] and 2% in gorillas [36], both figures estimated from analyses of over 2500 fecal samples. STLV, the relative of HTLV, is also common, with studies showing prevalences of, for example, 14% in gorillas [37], 48% in chimpanzees [38], and in 44% of individuals from seven other primate species sampled as bushmeat in Gabon [39]. A clearer picture emerges from the third common catarrhine virus, SFV (simian foamy virus). This has been found in many catarrhines and, although spillovers of SFVs into humans have been well documented, there is no evidence of persistent human-to-human transmission. Although most data on SFV come from captive populations (where it is very common), some studies show high prevalence in the wild, e.g. being found in 3 of 6 captive but wild-born gibbon (Nomascus leucogenys) and 20 of 20 captive but wild-born orangutan [40], in 5 of 27 wild-caught gorillas [41], and 44-100% of 724 chimpanzee fecal samples [42].
The above data are just a snapshot of XRV infection today. However, there is evidence of long evolutionary associations between XRVs and some non-human catarrhines. While HIV is new and pathogenic in humans, SIVs often show remarkably low pathogenicity for their host [43] and have congruent phylogenies with their hosts [44], both observations suggesting long co-existence. That SIV is pathogenic in chimpanzees is thought to reflect their recent acquisition from prey monkeys, and the utility of SIV-infected macaques as a model for HIV infection in humans reflects the absence of SIVs in wild macaques. Similarly, SFVs are also commonly non-pathogenic with congruent host and virus phylogenies [45]. We note that the pattern in T-lymphotropic viruses is more complex: they do not appear to form congruent phylogenies with their hosts [46] and there is no consensus about the date of origin of the various forms of HTLV [47].
If there is indeed an unusually low XRV burden in humans, this may reflect a reduced risk of retroviral transmission. As humans evolved, their behavior changed into having fewer encounters with blood (a major transmission route for XRVs) compared to other primates, either via predation or male-male conflict [48] – a trend that has possibly been reversed in the last century or so with alarming consequences for viral infection [49]. An alternative could be that a persistent endogenous retrovirus such as HK2 might have protected humans from exogenous retrovirus infection, e.g. in Jaagsiekte sheep retrovirus some endogenous loci protect the host from the related but more pathogenic exogenous form, both by receptor competition and blocking capsid trafficking [50]. Receptor competition has been observed in vitro for other closely related pairs of ERVs and XRVs [51], but whether it could defend a host from more distantly related XRVs is unknown. There is, however, some in vitro evidence that HK2 might interfere in HIV replication by competition for Gag-binding factors [52]. Whatever the cause, having fewer XRVs would reduce the likelihood of endogenization and thus explain the unusual absence of new ERV families in the human genome.
Another way in which ERV and XRVs could interact is by applying selection to innate immunity genes. The APOBEC3 gene family has been shown to have hypermutated at least two HK2 loci in the human genome and is also restrictive against two functionally reconstituted ERVs: HK2 and CERV-1 [53-55]. The role of another restriction factor, TRIM5α, on the replication of ERVs is controversial with one study finding restriction of a functionally reconstituted CERV-1 [56] while another study did not [55]. In the former, Kaiser et al. further reported mutually exclusive restriction of CERV-1 (= PtERV1) and HIV-1 by the TRIM5α of a range of other catarrhines. They speculated that past selection on TRIM5α to protect humans from infection by CERV-1 (= PtERV1) might in part be responsible for our current susceptibility to HIV-1. We are only beginning to understand how ERVs, XRVs and our innate immune system have interacted with each other through evolutionary time [57]. An evolutionary trade-off in the detection of cDNA involving these players (plus other endogenous retroelements) and the risk of autoimmune disease has also just been proposed [58]. Further comparative studies into the role that environmental and immunological factors have played in determining ERV load might help reveal how our immune system controls both vertical and horizontal transmission and determines the lifetime risk of retrovirus-associated disease.
Conclusions
-
1)
The hominoid genome has undergone a possibly unique collapse of ERV integration in recent evolutionary history compared to that of Old World monkeys and other mammals.
-
2)
Most of this decline is attributable to the recent extinction of one abnormally large family, HERV-H.
-
3)
Another contributing factor to the decline within the human genome is the absence of any new endogenous retroviral lineages acquired in recent evolutionary history. This is unusual among catarrhines.
-
4)
Only a small part of this overall decline can be explained by changes in the one life-history trait – body size – known to be correlated with ERV integration rate.
-
5)
Humans appear to be unique among our catarrhine relatives in the possession of an old ERV family that has continued to replicate up until at least the last few hundred thousand years – the potentially medically significant HK2.
Methods
Mining and dating
We probed the following catarrhine genome sequences with the genomic regions (LTR, leader, gag, pro, pol, env) of each ERV family: human (Homo sapiens), chimpanzee (Pan troglodytes), bonobo (Pan paniscus), gorilla (Gorilla gorilla), orangutan (Pongo pygmaeus), Northern white-cheeked gibbon (Nomascus leucogenys), rhesus macaque (Macaca mulatta) and hamadryas baboon (Papio hamadryas). Our library of probes was based on the well-studied human ERV families but supplemented with examples from all non-human families found in the other catarrhines. These non-human families were either already described in the literature – CERV, SERV and BaEV [22-24] – or discovered by us among novel sequences recovered from our earlier mining using the conserved Reverse Transcriptase domain of pol [11]. We were thus able to extract full-length loci, defined here as loci with at least 100 nucleotides of both 5′ and 3′ LTR and at least some internal region. This allowed us to date the integration using nucleotide divergence between the LTRs of the proviruses. Ranging in size from 300 to 1000 nucleotides, the two LTRs form the flanks of a provirus (the complete integrated DNA form of a retrovirus) and are identical at the time of integration, accumulating substitutions at the host background rate. Rather than use published estimates of background rate we estimated the substitution rate within the ERVs to be 1.0x10⁻⁹ per site per year directly using orthologous loci (see below). We then used this rate to convert the nucleotide divergence between the paired LTRs of each locus into a date of integration, correcting for multiple hits using the Jukes-Cantor model.
One drawback with this approach is gene conversion (recombination between the two LTRs of a provirus), which can homogenize the two LTRs leading to an old locus appearing to be younger. The effect of this is relatively minor: e.g. it has been estimated that ~6% of orthologous loci in the macaque and human genomes have undergone some gene conversion [59]. Recombination can also take place between the LTRs of different loci, which has the effect of artificially aging them, but this also affects only a small minority of loci [3].
The ERVs of most non-catarrhine mammal species are poorly studied, so it was not possible to identify the LTRs of all full-length loci. We were therefore compelled to estimate the age of a locus based on its divergence from the most similar other ERV locus in the same genome (a “nearest neighbor” analysis). For this we used sequences from our previous in silico screen of mammalian genomes [11], which recovered 600 nt long pol sequences. For each such pol sequence, we calculated the nucleotide divergence from the most similar other locus in the same genome, and then converted this to an integration date correcting for multiple hits using the Jukes-Cantor model. To estimate the integration rate we applied to all genomes a uniform mammalian nucleotide substitution rate, derived from neutral nuclear protein-coding sites, of 2.2×10⁻⁹ per site per year [60]. This study found rates to be broadly similar across different mammalian lineages, e.g. the average rate difference between primates and rodents was less than 10%. While the quality of assembly of these non-catarrhine genomes varies greatly, making comparison of absolute numbers across genomes problematic, our conversion to a ratio of the number of young loci to the number of old loci should reduce the error caused by this source of variation.
Building dendrograms
For each genome, a matrix was made of all pairwise dissimilarities between the nucleotide sequences using the EMBOSS water program [61], an implementation of the Smith-Waterman alignment algorithm (with gap opening and extension penalties of 10 and 4 respectively). After excluding loci that did not have a 300 nucleotide long match of at least 90% sequence identity with at least one other locus (removing loci that would have integrated before the platyrrhine/catarrhine split) we then built a dendrogram using UPGMA in R [62].
Estimating rate of substitution
By finding synteny of the pre-integration sites (i.e. homology of the host genome sequences adjacent to the LTRs), we identified six full-length orthologous loci from three ERV families (HERV-H, HERV-L, and HK2) in at least four of the following species: human, chimpanzee, gorilla, macaque and gibbon. For each set of orthologous loci we built an alignment and ran a molecular clock analysis with BEAST [63,64] for at least 106 generations (Estimated Sample Size > 200). We used the General Time Reversible substitution model with a gamma distribution to account for variation of the rate among sites (GTR + G) [65] and an uncorrelated log-normal relaxed molecular clock model [66]. We used the previously reported times to Most Recent Common Ancestor (tMRCA) of the other catarrhines to human to calibrate the molecular clock [67]: chimpanzee: 6.60 (5.40-7.96) mya; gorilla: 8.30 (6.58-10.07) mya; orangutan: 16.52 (13.45-19.68) mya; gibbon: 20.32 (16.59- 24.22) mya; macaque: 31.56 (25.66-37.88) mya.
The median rate on branches of these trees was found to be between 0.6 and 1.3x10⁻⁹ substitutions per site per year, with an overall mean of these rates being 1.0×10⁻⁹. Other studies using several homologous LTRs in different families have found similar rates: between 1.0×10⁻⁹ and 1.3×10⁻⁹ [68]. A rate of ~1×10⁻⁹ was also found for non-coding genome regions among catarrhines [69]. The Subramanian and Kumar study [69] concluded that the two-fold higher substitution rate among four-fold degenerate sites across all mammals [60] was probably due to differences in the abundance of CG dinucleotides in coding and non-coding regions.
Estimation of effect on ERV integration of body mass change
Our analysis of the relationship between (logged) number of ERV loci and (logged) host body mass shows a slope of −0.155 [12]. This suggests that, for example, a doubling in body mass leads to decrease in ERV number of 10%. Humans have a current mean body mass of 59 Kg, with great apes ranging from bonobo (35 Kg) to gorilla (114 Kg) [70], and, even if the body mass at the origin of the great apes was only one-fifth of this (less than the smallest fossil estimate we can find [28]), the increase in body mass would lead to reduction in ERV number of less than 25%.
Abbreviations
- my:
-
Million years
- mya:
-
Million years ago
- ERV:
-
Endogenous retrovirus
- HERV:
-
Human endogenous retrovirus
- LTR:
-
Long terminal repeat
- CERV:
-
Chimpanzee ERV
- PtERV:
-
Pan troglodytes ERV
- BaEV:
-
Baboon endogenous virus
- SERV:
-
Simian Endogenous Type D Retrovirus
- ORF:
-
Open reading frame
- XRV:
-
Exogenous retrovirus
- SFV:
-
Simian foamy virus
- SIV:
-
Simian immunodeficiency virus
- HIV:
-
Human immunodeficiency virus
- STLV:
-
Simian T-lymphotropic virus
- HTLV:
-
Human T-lymphotropic virus
- UPGMA:
-
Unweighted pair group method with arithmetic mean
- EMBOSS:
-
European molecular biology open software suite
- tMRCA:
-
Time to most recent common ancestor
- BEAST:
-
Bayesian evolutionary analysis sampling trees
References
Dewannieux M, Heidmann T. Endogenous retroviruses: acquisition, amplification and taming of genome invaders. Curr Opin Virol. 2013;3:646–56.
Tristem M. Identification and characterization of novel human endogenous retrovirus families by phylogenetic screening of the Human Genome Mapping Project database. J Virol. 2000;74:3715–30.
Belshaw R, Pereira V, Katzourakis A, Talbot G, Paces J, Burt A, et al. Long-term reinfection of the human genome by endogenous retroviruses. Proc Natl Acad Sci U S A. 2004;101:4894–9.
Mayer J, Blomberg J, Seal RL. A revised nomenclature for transcribed human endogenous retroviral loci. Mob DNA. 2011;2:7.
Lander ES, Linton LM, Birren B, Nusbaum C, Zody MC, Baldwin J, et al. Initial sequencing and analysis of the human genome. Nature. 2001;409:860–921.
Jern P, Coffin JM. Effects of retroviruses on host genome function. Annu Rev Genet. 2008;42:709–32.
Stoye JP. The pathogenic potential of endogenous retroviruses: a sceptical view. Trends Microbiol. 1999;7:430. 430.
Waterston RH, Lindblad-Toh K, Birney E, Rogers J, Abril JF, Agarwal P, et al. Initial sequencing and comparative analysis of the mouse genome. Nature. 2002;420:520–62.
Belshaw R, Dawson ALA, Woolven-Allen J, Redding J, Burt A, Tristem M. Genomewide screening reveals high levels of insertional polymorphism in the human endogenous retrovirus family HERV-K(HML2): implications for present-day activity. J Virol. 2005;79:12507–14.
Johnson WE, Coffin JM. Constructing primate phylogenies from ancient retrovirus sequences. Proc Natl Acad Sci U S A. 1999;96:10254–60.
Magiorkinis G, Gifford RJ, Katzourakis A, De Ranter J, Belshaw R. Env-less endogenous retroviruses are genomic superspreaders. Proc Natl Acad Sci U S A. 2012;109:7385–90.
Katzourakis A, Magiorkinis G, Lim AG, Gupta S, Belshaw R, Gifford R. Larger mammalian body size leads to lower retroviral activity. PLoS Pathog. 2014;10:e1004214.
Subramanian RP, Wildschutte JH, Russo C, Coffin JM. Identification, characterization, and comparative genomic distribution of the HERV-K (HML-2) group of human endogenous retroviruses. Retrovirology. 2011;8:90.
Marchi E, Kanapin A, Magiorkinis G, Belshaw R. Unfixed endogenous retroviral insertions in the human population. J Virol. 2014;88:9529–37.
Magiorkinis G, Belshaw R, Katzourakis A. “There and back again”: revisiting the pathophysiological roles of human endogenous retroviruses in the post-genomic era. Phil Trans Roy Soc B. 2013;368:20120504.
Young GR, Stoye JP, Kassiotis G. Are human endogenous retroviruses pathogenic? An approach to testing the hypothesis. BioEssays. 2013;35:794–803.
Bhardwaj N, Maldarelli F, Mellors J, Coffin JM. HIV-1 infection leads to increased transcription of human endogenous retrovirus HERV-K (HML-2) proviruses in vivo but not to increased virion production. J Virol. 2014;88:11108–20.
Cherkasova E, Weisman Q, Childs RW. Endogenous retroviruses as targets for antitumour immunity in renal cell cancer and other tumours. Front Oncol. 2013;3:243.
Kraus B, Fischer K, Bűchner SM, Wels WS, Lőwer R, Sliva K, et al. Vaccination directed against the Human Endogenous Retrovirus-K envelope protein inhibits tumor growth in a murine model system. PLoS One. 2013;8:e72756.
Sacha JB, Kim I-J, Chen L, Ullah JH, Goodwin DA, Simmons HA, et al. Vaccination with cancer-and HIV infection-associated endogenous retrotransposable elements is safe and immunogenic. J Immunol. 2012;189:1467–79.
Steinhuber S, Brack M, Hunsmann G, Schwelberger H, Dierich MP, Vogetseder W. Distribution of human endogenous retrovirus HERV-K genomes in humans and different primates. Hum Genet. 1995;96:188–92.
Yohn CT, Jiang Z, McGrath SD, Hayden KE, Khaitovich P, Johnson ME, et al. Lineage-specific expansions of retroviral insertions within the genomes of African great apes but not humans and orangutans. PLoS Biol. 2005;3:e110.
van der Kuyl AC, Dekker JT, Goudsmit J. Full-length proviruses of Baboon Endogenous Virus (BaEV) and dispersed BaEV Reverse Transcriptase retroelements in the genome of baboon species. J Virol. 1995;69:5917–24.
van der Kuyl AC, Mang R, Dekker JT, Goudsmit J. Complete nucleotide sequence of simian endogenous type D retrovirus with intact genome organization: Evidence for ancestry to simian retrovirus and baboon endogenous virus. J Virol. 1997;71:3666–76.
Belshaw R, Watson J, Katzourakis A, Howe A, Woolven-Allen J, Burt A, et al. Rate of recombinational deletion among human endogenous retroviruses. J Virol. 2007;81:9437–42.
Nellåker C, Keane TM, Yalcin B, Wong K, Agam A, Belgard TG, et al. The genomic landscape shaped by selection on transposable elements across 18 mouse strains. Genome Biol. 2012;13: R45.
Gebo DL, Malit NR, Nengo IO. New proconsuloid postcranials from the early Miocene of Kenya. Primates. 2009;50:311–9.
Ishida H, Kunimatsu Y, Takano T, Nakano Y, Nakatsukasa M. Nacholapithecus skeleton from the Middle Miocene of Kenya. J Hum Evol. 2004;46:69–103.
Robson SL, Wood B. Hominin life history: reconstruction and evolution. J Anat. 2008;212:394–425.
Marsh AK, Willer DO, Skokovets O, Iwajomo OH, Chan JK, MacDonald KS. Evaluation of Cynomolgus Macaque (Macaca fascicularis) endogenous retrovirus expression following Simian Immunodeficiency Virus infection. PLoS One. 2012;7:e40158.
Sheppard NC, Jones RB, Burwitz BJ, Nimityongskul FA, Newman LP, Buechler MB, et al. Vaccination against endogenous retrotransposable element consensus sequences does not protect Rhesus Macaques from SIVsmE660 infection and replication. PLoS One. 2014;9:e92012.
Romano CM, de Melo FL, Corsini MAB, Holmes EC, Zanotto PMA. Demographic histories of ERV-K in humans, chimpanzees and rhesus monkeys. PLoS One. 2007;2:e1026.
Locatelli S, Peeters M. Cross-species transmission of simian retroviruses: how and why they could lead to the emergence of new diseases in the human population. AIDS. 2012;26:659–73.
Keele BF, Jones JH, Terio KA, Estes JD, Rudicell RS, Wilson ML, et al. Increased mortality and AIDS-like immunopathology in wild chimpanzees infected with SIVcpz. Nature. 2009;460:515–9.
Li Y, Ndjango J-B, Learn GH, Ramirez MA, Keele BF, Bibollet-Ruche F, et al. Eastern chimpanzees, but not bonobos, represent a simian immunodeficiency virus reservoir. J Virol. 2010;86:10776–91.
Neel C, Etienne L, Li Y, Takehisa J, Rudicell RS, Bass IN, et al. Molecular epidemiology of simian immunodeficiency virus infection in wild-living gorillas. J Virol. 2010;84:1464–76.
LeBreton M, Switzer WM, Djoko CF, Gillis A, Jia H, Sturgeon MM, et al. A gorilla reservoir for human T-lymphotropic virus type 4. Emerg Microbes Infect. 2014;3:e7.
Leendertz FH, Boesch C, Ellerbrok H, Rietschel W, Couacy-Hymann E, Pauli G. Non-invasive testing reveals a high prevalence of simian T-lymphotropic virus type 1 antibodies in wild adult chimpanzees of the Taï National Park. Côte d’Ivoire. J Gen Virol. 2004;85:3305–12.
Liègeois F, Bouè V, Mouacha F, Butel C, Ondo BM, Pourrut X, et al. New STLV-3 strains and a divergent SIVmus strain identified in non-human primate bushmeat in Gabon. Retrovirology 2012; 9:28.
Hussain AI, Shanmugam V, Bhullar VB, Beer BE, Vallet D, Gautier-Hion A, et al. Screening for simian foamy virus infection by using a combined antigen Western blot assay: evidence for a wide distribution among Old World primates and identification of four new divergent viruses. Virology. 2003;309:248–57.
Calattini S, Nerrienet E, Mauclère P, Georges-Courbot MC, Saïb A, Gessain A. Natural simian foamy virus infection in wild-caught gorillas, mandrills and drills from Cameroon and Gabon. J Gen Virol. 2004;85:3313–7.
Liu W, Worobey M, Li Y, Keele BF, Bibollet-Ruche F, Guo Y, et al. Molecular ecology and natural history of simian foamy virus infection in wild-living chimpanzees. PLoS Path. 2008;4:e1000097.
Silvestri G, Paiardini M, Pandrea I, Lederman MM, Sodora DL. Understanding the benign nature of SIV infection in natural hosts. J Clin Invest. 2007;117:3148–54.
Allan JS, Short M, Taylor ME, Su S, Hirsch VM, Johnson PR, et al. Species-specific diversity among simian immunodeficiency viruses from African green monkeys. J Virol. 1991;65:2816–28.
Switzer WM, Salemi M, Shanmugam V, Gao F, Cong ME, Kuiken C, et al. Ancient co-speciation of simian foamy viruses and primates. Nature. 2005;434:376–80.
Slattery JP, Franchini G, Gessain A. Genomic evolution, patterns of global dissemination, and interspecies transmission of human and simian T-cell leukemia/lymphotropic viruses. Genome Res. 1999;9:525–40.
Mauclère P, Afonso PV, Meertens L, Plancoulaine S, Calattini S, Froment A, et al. HTLV-2B strains, similar to those found in several amerindian tribes, are endemic in central African Bakola pygmies. J Infect Dis. 2011;203:1316–23.
Plavcan JM. Sexual size dimorphism, canine dimorphism, and male-male competition in primates: where do humans fit in? Hum Nat. 2012;23:45–67.
Drucker E, Alcabes PG, Marx PA. The injection century: massive unsterile injections and the emergence of human pathogens. Lancet. 2001;358:1989–92.
Arnaud F, Caporale M, Varela M, Biek R, Chessa B, Alberti A, et al. A paradigm for virus-host coevolution: Sequential counter-adaptations between endogenous and exogenous retroviruses. PLoS Pathog. 2007;3:e170.
Denesvre C, Soubieux D, Pin G, Hue D, Dambrine G. Interference between avian endogenous ev/J 4.1 and exogenous ALV-J retroviral envelopes. J Gen Virol. 2003;84:3233–8.
Monde K, Contreras-Galindo R, Kaplan MH, Markovitz DM, Ono A. Human Endogenous Retrovirus K Gag coassembles with HIV-1 Gag and reduces the release efficiency and infectivity of HIV-1. J Virol. 2012;86:11194–208.
Lee YN, Malim MH, Bieniasz PD. Hypermutation of an ancient human retrovirus by APOBEC3G. J Virol. 2008;82:8762–70.
Armitage AE, Katzourakis A, de Oliveira T, Welch JJ, Belshaw R, Bishop KN, et al. Conserved footprints of APOBEC3G on hypermutated human immunodeficiency virus type 1 and human endogenous retrovirus HERV-K(HML2) sequences. J Virol. 2008;82:8743–61.
Perez-Caballero D, Soll SJ, Bieniasz PD. Evidence for restriction of ancient primate gammaretroviruses by APOBEC3 but not TRIM5α proteins. PLoS Path. 2008;4:e1000181.
Kaiser SM, Malik HS, Emerman M. Restriction of an extinct retrovirus by the human TRIM5α antiviral protein. Science. 2007;316:1756–8.
Stoye JP. Studies of endogenous retroviruses reveal a continuing evolutionary saga. Nature Rev Microbiol. 2012;10:395–406.
Volkman HE, Stetson DB. The enemy within: endogenous retroelements and autoimmune disease. Nature Immunol. 2014;15:415–22.
Kijima TE, Innan H. On the estimation of the insertion time of LTR Retrotransposable Elements. Mol Biol Evol. 2010;27:896–904.
Kumar S, Subramanian S. Mutation rates in mammalian genomes. Proc Natl Acad Sci U S A. 2002;99:803–8.
Rice P, Longden I, Bleasby A. EMBOSS: The European Molecular Biology Open Software Suite. Trends Genet. 2000;16:276–7.
R Development Core Team. R: A Language and Environment for Statistical Computing. Vienna, Austria: R Foundation for Statistical Computing; 2009.
Drummond AJ, Rambaut A. BEAST: Bayesian evolutionary analysis by sampling trees. BMC Evol Biol. 2007;7:214.
Drummond AJ, Suchard MA, Xie D, Rambaut A. Bayesian Phylogenetics with BEAUti and the BEAST 1.7. Mol Biol Evol. 2007;29:1969–73.
Yang Z. Maximum likelihood phylogenetic estimation from DNA sequences with variable rates over sites: approximate methods. J Mol Evol. 1994;39:306–14.
Drummond AJ, Ho SYW, Phillips MJ, Rambaut A. Relaxed phylogenetics and dating with confidence. PLoS Biol. 2006;4:e88.
Perelman P, Johnson WE, Roos C, Seuànez HN, Horvath JE, Moreira MA, et al. A molecular phylogeny of living primates. PLoS Genet. 2011;7:e1001342.
Lebedev YB, Belonovitch OS, Zybrova NV, Khil PP, Kurdyukov SG, Vinogradova TV, et al. Differences in HERV-K LTR insertions in orthologous loci of humans and great apes. Gene. 2000;247:265–77.
Subramanian S, Kumar S. Neutral substitutions occur at a faster rate in exons than in noncoding DNA in primate genomes. Genome Res. 2003;13:838–44.
Cooper N, Purvis A. Body size evolution in mammals: complexity in tempo and mode. Am Nat. 2010;175:727–38.
Acknowledgements
We thank Robert Gifford for access to his catarrhine ERV database. This work was supported by The Wellcome Trust (RB), and an MRC Clinician Scientist Fellowship (GM).
Author information
Authors and Affiliations
Corresponding author
Additional information
Competing interests
The authors declare that they have no competing interests.
Authors’ contributions
GM carried out molecular clock analyses and co-wrote the manuscript, DB-M built the database of homologous loci and helped revise the manuscript. RB conceived of the study, did the other analyses and co-wrote the manuscript. All authors read and approved the final manuscript.
Additional file
Additional file 1: Figure S1.
Frequency histograms of loci used to construct Figure 1. Ages of loci are estimated using divergence between the two LTRs except for the poorly assembled baboon genome, where ages were estimated using nearest neighbor analysis (hence also the larger number of loci recovered).
Rights and permissions
This article is published under an open access license. Please check the 'Copyright Information' section either on this page or in the PDF for details of this license and what re-use is permitted. If your intended use exceeds what is permitted by the license or if you are unable to locate the licence and re-use information, please contact the Rights and Permissions team.
About this article

Cite this article
Magiorkinis, G., Blanco-Melo, D. & Belshaw, R. The decline of human endogenous retroviruses: extinction and survival. Retrovirology 12, 8 (2015). https://doi.org/10.1186/s12977-015-0136-x
Received:
Accepted:
Published:
DOI: https://doi.org/10.1186/s12977-015-0136-x