
Abstract
Background
Patients with cancer have an increased risk of malnutrition which is associated with poor outcome. The Mini Nutritional Assessment (MNA®) is often used in older patients with cancer but its relation to outcome is not known.
Methods
Four databases were systematically searched for studies relating MNA-results with any reported outcome. Two reviewers screened titles/abstracts and full-texts, extracted data and rated the risk of bias (RoB) independently.
Results
We included 56 studies which varied widely in patient and study characteristics. In multivariable analyses, (risk of) malnutrition assessed by MNA significantly predicts a higher chance for mortality/poor overall survival (22/27 studies), shorter progression-free survival/time to progression (3/5 studies), treatment maintenance (5/8 studies) and (health-related) quality of life (2/2 studies), but not treatment toxicity/complications (1/7 studies) or functional status/decline in (1/3 studies). For other outcomes – length of hospital stay (2 studies), falls, fatigue and unplanned (hospital) admissions (1 study each) – no adjusted results were reported. RoB was rated as moderate to high.
Conclusions
MNA®-result predicts mortality/survival, cancer progression, treatment maintenance and (health-related) quality of life and did not predict adverse treatment outcomes and functional status/ decline in patients with cancer. For other outcomes results are less clear. The moderate to high RoB calls for studies with better control of potential confounders.
Background
Cancer is the second leading cause of death of non-communicable diseases worldwide [1]. Its prevalence increased by 25.4% between 2007 and 2017, and population ageing contributed about 22% to this increase [1]. Prevalence and incidence of cancer in people aged 70 years and older were estimated to be about 27.1 and 9.6 million cases in 2017 [2].
Due to the effects of both, the disease and its usually intensive treatment, patients with cancer have an increased risk of malnutrition. Various cancer-related mechanisms, such as systemic inflammation [3] and hypoxic stress [4] affect the patients’ nutritional status. Patients might already present lower dietary intake before anticancer treatment [5] and in addition, side effects of anticancer therapy, e. g. loss of appetite, dry mouth or nausea that are associated with a lower energy intake [6]. The prevalence of malnutrition in patients with cancer is described by 26–42% [7,8,9], and varies between different operationalisations [10,11,12]. To better reflect the health status of an older patient before treatment decisions are made by oncologists, a (comprehensive) geriatric assessment is recommended [13,14,15], consisting of several domains such as functional status, cognition, comorbidity or polypharmacy and it is also recommended that it should contain a domain regarding the patients’ nutritional status assessed by validated tools such as the Mini Nutritional Assessment (MNA)® [15]. A recent study by Kenis et al. could show that components of comprehensive geriatric assessment are prognostic factors (especially functional status and nutritional status) for overall survival in patients with cancer which additionally highlights the need for nutritional assessment [16]. It was also shown, that (severe) malnutrition is independently associated with mortality risk and decreased tolerance of chemotherapy [17]. Therefore, early detection and treatment of malnutrition is recommended for the prevention of cancer-related adverse outcomes [18,19,20].
However, no gold standard for screening and assessment of malnutrition in cancer patients exists. Among 37 malnutrition screening and assessment methods utilized for patients with cancer in clinical practice, in a recent systematic review, the MNA scored highest for the calculated content validity [21]. This tool is validated to identify persons aged 65 years or older who are at risk of malnutrition or malnourished [22,23,24,25].
The MNA is widely used in patients with cancer of all ages [26], even though it is neither developed specifically for this disease nor for persons younger than 65 years. Both versions, the short-form (MNA-SF) and long-form (MNA-LF), are recommended for screening of nutritional status of older patients in all clinical settings [27]. For patients with cancer, the use of MNA-SF is recommended by medical oncology societies for older patients with cancer [28, 29] as well as by practicing oncologists [30]. A summary of results about the association between MNA and relevant patient outcomes is currently lacking. Thus, our aim was to systematically summarize the existing evidence regarding nutritional status according to the MNA as potential prognostic factor for health and treatment outcomes in cancer patients.
Methods
This systematic review is reported according to the Preferred Reporting Items for Systematic Reviews and Meta-Analyses (PRISMA) statement [31]. A protocol describing the methodological procedure was prepared before the start and is available upon request.
Systematic literature search
A systematic literature search using database specific search strategies was conducted in MEDLINE and EMBASE (via Ovid), the Cochrane Library and CINAHL (via EBSCOhost) in June 2017 for studies published in any language from 1994 (first published version of MNA) onwards. The search was updated twice, in September 2018 and March 2020. Search strategies have been developed by 1 reviewer (GT) and discussed by the working group members (GT, TS, EK and DV) and a librarian. The search strategies included a combination of keywords and MeSH−/ Emtree-terms (e.g. nutritional status, MNA, cancer) (Additional file, table 1). Additionally, reference lists of included studies were searched.
Study selection
Original articles of longitudinal studies reporting a potential association between nutritional status assessed by MNA (any form) at baseline and any health or treatment outcome (e.g. mortality, survival, complications) at a later time point in patients of any age with any type of cancer and anticancer therapy were included. Studies with a cross-sectional design and those not using MNA-assessed nutritional status for predicting health and treatment outcomes were excluded as well as other publication types (e.g. conference abstracts or editorials). Currently, 2 forms of the MNA are available, which were both included. The short-form (SF) consisting of 6 items (A-F), first developed in 2001 [24] and revised in 2009 (range 0–14 points; 0–7 points: malnourished; 8–11 points: at risk of malnutrition and 12–14 points: normal nutritional status) [23], and the long-form (LF) or “full MNA” consisting of additional 12 items (G-R) [22, 25] (range 0–30 points; 0–17 points: malnourished; 17–23.5 points: at risk of malnutrition and 24–30 points: normal nutritional status).
Titles/abstracts and full texts were screened by 2 reviewers (GT, TS) independently. Conflicts were solved by discussion or by a third reviewer (EK).
Data extraction
Two reviewers (GT, TS) independently extracted the following data using a piloted extraction form:
a) Study characteristics: first author, year of publication, country, sample size.
b) Participant characteristics: age, sex, type of cancer, cancer stage, anticancer therapy (e.g. chemotherapy).
c) Malnutrition screening tool and result: MNA form (MNA-SF or -LF), MNA result as reported by the authors (prevalence of malnutrition, risk of malnutrition and well-nourished patients and/or mean/median score.
d) Outcome characteristics: follow-up time, prevalence or incidence of any reported outcome at/during follow-up; results on prognostic effects (e.g. odds ratios (OR), hazard ratios (HR) for respective outcome (e.g. mortality)) from multivariable analyses.
Assessment of risk of bias
Two reviewers (GT, EK) independently assessed the risk of bias (RoB) of each included study using a specified version of the QUIPS-tool [32] (Additional file, table 2). We predefined a set of core confounders (cancer stage, type of cancer, type of therapy, sex, age, performance status, co-morbidity) and dropped the first item ‘definition of the prognostic factor’ of the ‘prognostic factor measurement’ domain since we were interested in nutritional status according to MNA as the only prognostic factor. The item ‘valid and reliable measurement of prognostic factor’ was rated as having a low risk of bias when the study reported all 3 MNA-categories or the MNA-score.
The domains study participation, study attrition, prognostic factor measurement, outcome measurement, study confounding and statistical analysis and reporting were rated with either low, moderate or high RoB and are separately presented for each study. Conflicts were solved by discussion or a third reviewer (DV).
Data synthesis
Reported outcomes were classified in 7 categories: (a) mortality/ poor overall survival, (b) progression-free survival and time to progression, (c) treatment maintenance or duration, (d) adverse treatment outcomes (toxicity, complications), (e) functional status / decline and (f) quality of life and (g) other outcomes.
Due to a high heterogeneity of patient populations and reported outcomes meta-analyses were not possible.
Results
Study selection
After removing duplicates, we screened 6080 titles/abstracts and 859 full-texts for potential eligibility. Finally, 56 studies [16, 33,34,35,36,37,38,39,40,41,42,43,44,45,46,47,48,49,50,51,52,53,54,55,56,57,58,59,60,61,62,63,64,65,66,67,68,69,70,71,72,73,74,75,76,77,78,79,80,81,82,83,84,85,86,87] were included, all of them published in English language. Main reasons for exclusion were wrong publication type (e.g. conference abstract), no use of MNA, or no longitudinal study design/predictive purpose (Fig. 1).
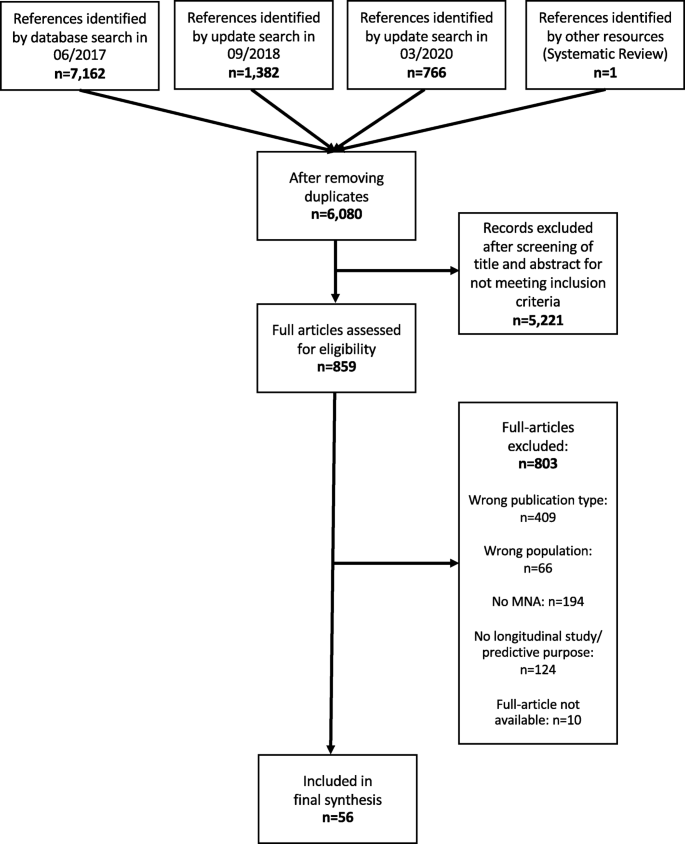
PRISMA Flow chart
Study and patient characteristics
Detailed study and patient characteristics are presented in Table 1.
Most of the studies [16, 33,34,35,36,37, 39, 41, 42, 44,45,46,47, 49,50,51,52,53,54,55,56,57, 59, 60, 62, 63, 65,66,67, 69, 73, 75,76,77,78,79, 82,83,84,85,86,87] were conducted in Northern, Western or Southern Europe, 5 studies [38, 40, 43, 48, 68] in North or South America and 8 [58, 61, 64, 70, 72, 74, 80, 81] in Eastern Asia.
The number of included patients ranged from 30 to 2972, mean/median age from 53 to 82 years. In 8 studies [40, 52,53,54, 56, 58, 69, 87] also patients < 65 years were included. In 3 of these studies [40, 53, 58] mean age was 65 years or lower.
The percentage of female patients in studies including both sexes (N = 52) ranged from 9.7–96.0%. Three studies only included patients with prostate cancer [57, 59, 73] and one study only patients with gynecologic cancer [70].
Almost half of the studies [16, 34,35,36, 40,41,42,43, 45, 48,49,50, 55, 60, 62, 63, 66,67,68, 75, 78, 80, 82, 84, 86] reported on patients with various types of cancer. Thirty studies [33, 37,38,39, 44, 46, 47, 51,52,53,54, 56,57,58,59, 61, 65, 69,70,71,72,73,74, 76, 77, 79, 81, 83, 85, 87] focused on a specific type, with lung [52,53,54, 56, 81, 87] and colorectal cancer [37, 39, 44, 46, 51, 65, 69, 76, 77] as the most common types. Fifteen studies [33, 39, 44, 52,53,54,55,56,57,58, 60, 76, 81, 84, 87] included only patients with advanced cancer, while 2 studies [57, 73] excluded patients with metastatic cancer. For studies reporting various cancer stages (N = 26), the percentage of patients with stage III and stage IV (metastatic) ranged from 15 to 56% and from 4 to 86%, respectively.
MNA
In 30 studies [40, 42, 44, 46,47,48,49, 51,52,53,54,55,56,57, 60, 62, 64,65,66, 69,70,71,72, 78,79,80, 82,83,84, 87] the MNA-LF, in 20 studies [16, 38, 39, 43, 45, 50, 58, 59, 61, 63, 67, 68, 73,74,75,76,77, 81, 85, 86] the MNA-SF, and in 5 studies [33,34,35,36,37] a stepwise approach that considered both forms was used. One study [41] did not report the MNA-version.
All MNA-categories (malnourished, at risk of malnutrition and well-nourished) were reported in 25 studies [35, 38, 42, 43, 52,53,54,55,56, 58, 63,64,65,66, 68, 69, 73, 74, 78,79,80,81, 83, 86, 87] with prevalence of malnutrition ranging from 0 to 35.7% and of risk of malnutrition from 6.7–66.7%. Twenty-three studies [16, 33, 34, 36, 37, 39, 44,45,46,47, 49, 59,60,61,62, 67, 71, 75,76,77, 82, 84, 85] merged patients with malnutrition and at risk of malnutrition, and reported 27.0–85.0% being at least at risk, while 2 other studies [57, 72] merged patients at risk of malnutrition and well-nourished patients. Four studies reported a mean or median baseline MNA-score [40, 48, 51, 70], and 2 studies did not report concrete results [41, 50].
Reported outcomes
Thirty-three studies investigated the association between MNA and mortality / (poor) overall survival, 3 reported progression-free survival, 2 time to progression, 11 treatment maintenance, 15 adverse treatment outcomes, 4 functional status or decline, 3 (health-related) quality of life (Table 2 and Additional file table 3a-f). Other outcomes were less often reported: length of hospital stay in 2 studies and falls, fatigue and unplanned admission in 1 study, each and are reported in the results section.
Mortality / (poor) overall survival
In 10 studies a specific follow-time point was reported (100 and 500 days, 6, 12, 24, 36 and 60 months), in 20 studies follow-up times varied with median follow-up times between 9 and 70 months. Mortality rates varied between 16% in 6 months and 94% in 38 months (29 studies). The mean/ median time for overall survival ranges from 5 to 38 months (9 studies) (Table 2, Additional file table 3a).
All studies analyzing the malnourished category separately (N = 7) report significant results with 3 to 8 times higher chance for mortality for malnourished compared to well-nourished patients [42, 53, 55, 56, 58, 68, 87]. In all of these studies, the chance for mortality was lower in patients at risk of malnutrition than in malnourished patients, but still significant in 4 studies [42, 53, 55, 56].
In 1 study reporting 12-, 36- and 60 months-mortality in patients with (risk of) malnutrition compared with well-nourished patients, significance was lost at 60 months [49]. In 12 of 18 studies with a combined malnutrition/ at risk of malnutrition group, the chance for mortality was also significantly increased [33, 35,36,37, 54, 63, 65, 82] compared to well-nourished patients in multivariable analyses. In a subgroup analysis in 1 of these studies, the relation remained only significant in patients receiving palliative chemotherapy but not in patients with adjuvant chemotherapy [37]. In 1 [74] of 2 studies [72, 74] the chance for mortality was significantly higher for patients with malnutrition when compared to those being at risk of malnutrition or well-nourished. One study [52] showed a significant association of MNA with mortality but did not report whether the continuous or categorical MNA-result was used for analysis, while another study showed also a significant association but used the MNA-score [67]. Six other studies only reported results from univariate analyses [51, 59, 72, 76, 79, 83].
Progression-free survival and time to progression
Of 3 studies [39, 44, 87] examining progression-free survival in patients with either colorectal or lung cancer, only 1 [44] found the MNA to be predictive (Table 2, Additional file table 3b).
Two studies investigated the prognostic ability of MNA for time to progression of metastatic lung cancer [53, 56]. Both reported a higher chance for a longer time to progression for well-nourished patients when compared to patients at risk of malnutrition and malnourished patients in multivariable analyses.
Treatment maintenance
Treatment maintenance was examined in 3 ways: not completing scheduled chemotherapy cycles, treatment discontinuation and treatment duration.
Not completing the scheduled cycles of chemotherapy was investigated in 7 studies [33,34,35,36,37, 74, 84] and those presenting adjusted analyses (n = 3) showed a significant higher chance for patients with (risk of) malnutrition compared to well-nourished patients [34, 36, 37] or malnourished patients compared to those who were well-nourished or at risk of malnutrition [74]. Two studies did not report an adjusted analysis [35, 84] and in 1 study a significant association could not be obtained in multivariable analysis [33] (Table 2, Additional file table 3c).
One [64] of 3 studies [59, 64, 71] focusing on treatment discontinuation reported a significantly higher chance for patients with malnutrition compared to those who were well-nourished or at risk of malnutrition.
One further study [44] focused on treatment duration and failed to show an association with MNA-result at baseline.
Adverse treatment outcomes
Nine studies investigated the association between baseline MNA and treatment toxicity [46, 48, 58, 69, 73, 76, 80, 81, 84] (Table 2, Additional file table 3d). In only 1 of these studies [48], a significant higher risk for non-hematologic toxicity was shown for patients with (risk of) malnutrition compared to well-nourished patients, while for other toxicity outcomes (hematologic, acute radiotherapy or significant toxicity) MNA-result was not predictive [46, 73, 80] or not investigated in adjusted analyses [69, 76, 81, 84].
In all 6 studies reporting various kinds of postoperative complications, MNA did not maintain significant results or was not investigated in multivariable analyses [38, 61, 62, 65, 77, 78].
Functional status/ decline
One study identified functional limitations defined as Barthel-ADL < 95 after 6 months in 10% of patients with various types of cancer and reported no significant association of this outcome with the baseline MNA-result in the unadjusted analysis (Chi2-test) [41] (Table 2, Additional file table 3e).
Functional decline in activities of daily living and instrumental activities of daily living was examined in 3 studies [46, 60, 63] with different tools and was not significantly associated with the MNA-result in all but 1 study, where the odds for ADL-decline was two-fold in patients with (risk of malnutrition) compared to well-nourished patients [63]. Another study in about 300 patients with various types of cancer did not conduct multivariable analyses [60].
(health-related) quality of life
Three studies reported (Health-related) quality of life [57] (Table 2, Additional file table 3f). Until a follow-up of 2 months, quality of life declined in 30% of patients with localized advanced prostate cancer and a low prevalence of malnutrition at baseline (2%), but the study did not report adjusted analyses related to its association with baseline MNA [57]. In two studies [45, 75] reporting on patients with various types of cancer and a follow-up of 3 months, patients with (risk of) malnutrition had a significantly lower chance for a decline in health-related quality of life compared to well-nourished patients. In one of these studies, this effect was not maintained in in the multivariable analysis in patients receiving chemotherapy [75].
Other outcomes
Two studies reported results on length of hospital stay investigated in univariate analyses [43, 77] . In 1 study [77], length of hospital stay was longer in patients with malnutrition while in the other study [43], nutritional status according to MNA did not show an association.
One study showed that MNA-score was predictive for fatigue evaluated by the Chalder Fatigue Scale (mean value at follow-up 26.8 ± 4.8; correlation coefficient r = − 0.52, p = 0.01) but not by the Brief Fatigue Inventory (mean value at follow-up 22.4 ± 23.7; correlation coefficient and p-value not reported) in chemotherapy-treated patients with various types of cancer and a mean age of 53 years [40].
In 1 study reporting a fall incidence of about 18% during 2–3 months, nutritional status was not a prognostic factor for patients with various kinds and stages of cancer (not significant in multivariable analysis) [86].
Another study including patients with various types of cancer reported a significant univariate association between MNA and unplanned (hospital) admissions but did not consider MNA for further multivariable analyses [66].
Risk of Bias
The RoB of all studies was moderate to high (Additional file 2, table 3). Main sources of potential bias were residual confounding due to missing prespecified potential confounding variables (e.g. age, sex, performance status) in multivariable models.
Discussion
In this systematic review, we investigated the prognostic significance of baseline nutritional status according to MNA regarding health and treatment outcomes in patients with cancer. In 56 studies included in our review, we found that, based on a moderate to high risk of bias, poor nutritional status is associated with a significantly higher risk for mortality / poor overall survival (22/27 studies), longer progression-free survival / time to progression (3/5 studies), worse treatment maintenance (5/8 studies) and (health-related) quality of life (2/2 studies) in multivariable analyses. Adverse treatment outcomes (1/7 studies) and functional decline (1/3 studies) were not significantly predicted by MNA in adjusted analyses while other outcomes were not investigated in multivariable analyses.
The MNA was originally developed to identify patients 65 years or older at risk of malnutrition irrespective of a specific disease [23, 25].
The prevalence of malnutrition, risk of malnutrition or their combination was 0–41%, 7–67%, and 28–67%, respectively – however not reported in all studies (Additional file 1, Table 1). We could not identify a trend for a higher or lower prevalence of malnutrition in studies including patients with a specific kind or stage of cancer as documented in a large cohort study from Italy including 1952 patients with various types and stages of cancer. There, a prevalence for malnutrition of 8.7% and risk of malnutrition of 42.4% was reported for all patients, but when stratified for cancer stage, both MNA-categories, malnutrition and risk of malnutrition were significantly higher in stage IV compared to stage I-III cancer [88]. A meta-analysis of studies including hospitalized patients older than 60 years with any disease, reported a prevalence for malnutrition of 22.0% (95%-CI: 18.9–25.2) and risk of malnutrition 45.6% (95%-CI: 42.7–48.6) [89]. Recently, a consensus for the diagnosis of malnutrition, the Global Leadership Initiative on Malnutrition (GLIM)-criteria, was published [90] and a few studies regarding nutritional status in patients with cancer are available. Prevalence rates for malnutrition according to GLIM were reported between 25.8 and 80% - depending on the criteria which were used for the diagnosis according to GLIM [91,92,93].
We could show that the chance for mortality was higher in patients being malnourished and at risk of malnutrition compared to well-nourished patients in the majority of studies (Table 2, Additional file table 3a). This is in line with 3 recently published systematic reviews also addressing the relation between malnutrition and mortality in patients with cancer [94,95,96]. While their approaches and search strategies differed with respect to inclusion of other screening tools and prespecified outcomes, there is an overlap of included MNA-studies. However, we could identify additional studies, so that our systematic review adds further evidence for the relationship between nutritional status assessed by MNA and mortality. Other systematic reviews with focus on a specific type of cancer (pancreatic, gastrointestinal) [97,98,99] or cancer stage (advanced) [100] reported that mortality risk / overall survival is predicted by nutritional status according to low body mass index, the Prognostic Nutritional Index, Controlling Nutritional status and phase angle [97,98,99,100]. For the Patient-Generated Subjective Global Assessment, which is also often used and recommended for nutritional screening in patients with cancer, several primary studies investigated the association with mortality/ overall survival and showed conflicting results with a majority of studies predicting a higher risk [101,102,103,104]. Two studies investigated the association between malnutrition according to the GLIM-criteria and mortality/ poor survival and both could show significant results [91, 92]. Future studies should investigate the application and prognostic abilities of these criteria. Additionally, an analysis including several cohorts of patients with cancer could show that the risk for mortality was higher in patients with lower body mass index and higher weight loss [105]. In one study (which was excluded), machine learning algorithms were used to predict early death in older patients with cancer [106]. Questionnaire items from the comprehensive geriatric assessment were selected by artificial intelligence and the MNA-SF remained in the predictive model. Such studies might be used in future to gain further knowledge of the prognostic factors in patients with cancer. Regarding other diseases, a meta-analysis found nutritional status according to MNA being predictive for mort ality in patients with heart failure [107].
Besides mortality risk, time to progression and progression-free survival are often used endpoints in clinical trials to evaluate the efficacy of anti-cancer treatment, since the treatment intention is either curation or a longer survival with a higher quality of life [108], but were only rarely investigated in relation to MNA. We found evidence that a poor MNA-result is predictive for a shorter time to progression / progression-free survival (Table 2, Additional file table 3b). These endpoints are mostly not clearly defined, but it is generally agreed among experts that time to progression reflects the time to cancer progression whereas progression-free survival also includes death from any cause [109, 110]. However, it is discussed whether these endpoints are meaningful outcomes in cancer research, since a recent systematic review, including about 14,000 adult patients until 93 years with various kinds of cancer, showed that a prolonged progression-free survival is not associated with a higher health-related quality of life [111]. The association between a poorer nutritional status and a higher risk for a shorter progression-free survival was also shown in a recent meta-analysis investigating the prognostic ability of the Prognostic Nutritional Index in patients with hepatocellular carcinoma [112]. For other tools, primary studies found a shorter progression-free survival significantly predicted by nutritional status assessed by the Geriatric Nutritional Risk Index or the Controlling Nutritional Status Score in different types of cancer [113, 114], but systematic reviews are lacking.
When patients with cancer had poor MNA at baseline, treatment maintenance was poorer but treatment duration (1 study) was not shorter (Table 2, Additional file table 3c). Main reasons for poorer maintenance were toxicity, cancer progression and insufficient therapeutic effect [33,34,35,36].
In included studies investigating toxicity as a separate outcome, a significant association with MNA-result at baseline was not found. Only non-hematologic toxicity was predicted by a poorer nutritional status according to MNA in 1 study [48] (Table 2, Additional file table 3d). Also, complications after surgery were not predicted by MNA (Table 2, Additional file table 3d). This is in line with results of other systematic reviews including patients with various kinds of cancer that showed a lower chance of treatment-related adverse events by geriatric assessment components only according to functional status, cognition and depression but not by nutritional status according to various definitions [95, 115, 116]. In contrast, in adult patients undergoing joint arthroplasty or hip fracture surgery, malnutrition defined by serologic markers (e.g. albumin, lymphocyte count, transferrin) was predictive for a higher risk of postoperative outcomes, such as wound complications [117, 118]. One study in older hip-fracture patients showed that patients with (risk of) malnutrition patients – according to MNA-SF – were at higher risk for postoperative delirium compared to well-nourished patients [119]. In another study, a significant association between malnutrition and chemotherapy related toxicity could be showed for the Patient-Generated Subjective Global Assessment but not for the Nutritional Risk Index [103]. To clarify these conflicting results, further studies are required in patients with cancer.
Only 1 of 3 studies predicted functional decline in basic activities of daily living by poor MNA-result and all 3 studies failed to predict a decline in instrumental activities of daily living (Additional file, table 3e). In older hospitalized patients with various diseases, nutritional status according to Short Nutritional Assessment Questionnaire was also not related to functional decline [120] but a moderate association was found for MNA in older people from different settings (i.e. community-dwelling, acute, subacute or residential care) [121]. A systematic review of studies including older hospitalized patients with various diseases revealed that baseline functional and cognitive status as well as social support were more important to predict functional outcomes than nutritional status [122]. These results demonstrate the need for further studies regarding the association between MNA and functional decline in patients with cancer.
For (health-related) quality of life, 1 study that was identified by our systematic literature search was only small, including patients with prostate cancer. Only 2% were malnourished and unfortunately no adjusted analysis was reported [57]. Two other studies that we also included could show a lower chance for a decline in health-related quality of life for patients with (risk of) malnutrition [45, 75] (Table 2, Additional file table 3f). This finding might be explained by the already poor quality of life at baseline or, in other words that after anticancer therapy the chance for an improvement in quality of life was higher for patients with (risk of) malnutrition compared to well-nourished patients with already better quality of life.
Regarding length of hospital stay (2 studies), fatigue, falls and unplanned admissions (1 study each), only a very small number of studies investigated the association with baseline MNA with no multivariable analyses, and more studies are needed also in this regard to draw any conclusion.
Several limitations of the included studies need to be considered. First, risk of bias was judged as moderate to high in all included studies, which is in contrast to other systematic reviews reporting a low to moderate risk of bias [94, 95]. Our rating is mainly explained by insufficient consideration of potential confounders – which have been predefined by 2 reviewers (cancer stage, type of cancer, sex, age, performance status, co-morbidity) – in multivariable analyses of primary studies to minimize the risk of residual confounding which is generally one of the most relevant limitations of observational studies [123,124,125]. Second, in several studies [33, 34, 37, 42, 53, 56, 58, 61, 64, 68, 74, 80, 82, 87], effect estimates had relatively wide confidence intervals and this imprecision should be considered when interpreting these results. Reasons for imprecisions might be an insufficient number of participants or malnourished patients. Third, follow-up times differed widely between the studies and only a few defined or reported a specific time point for outcome assessment. Mostly only vague information about follow-up times, such as a mean overall survival, was provided. Thus, conclusions for a specific time-frame cannot be drawn.
Furthermore, we included articles that report on study populations recruited from the same hospitals within a recruitment time from 2004 to 2010 [33,34,35,36,37]. All patients were treated by chemotherapy. We did not exclude one of these studies, since 2 publications focused on a specific type [33, 37] and the other 3 publications included various types of cancer [34,35,36] with 1 study focusing on patients with different types of non-Hodgkin Lymphoma [34] and 1 study with a shorter recruitment period [35]. Although reported results differed, this overlap should be kept in mind.
Strengths
Main strength of this systematic review is its strict methodology which followed the PRISMA guideline [31]. We conducted an extensive literature search without any language restrictions and did not specify search terms for outcomes to integrate all health and treatment outcomes that were investigated in primary studies. Each review step (screening, data extraction and RoB assessment) was piloted and performed by 2 reviewers independently. Additionally, we focused on 1 screening tool to minimize heterogeneity due to assessment. As part of the assessment of RoB, our rating of the confounding domain was strict and other reviewers might rate differently – but this is a general problem with RoB rating.
Limitations
The databases we used have their major focus on journals from the US and Europe and journals from other regions might not have been identified by our exhaustive systematic literature search. Therefore, language bias cannot be excluded although we did not restrict our search to specific languages.
The large heterogeneity of included studies regarding samples, treatments and outcome assessments should also be considered when interpreting our results. However, despite this heterogeneity, a rather stable relation between MNA result and several outcomes was observed.
Implications for research
Large, prospective and registered cohort studies should be conducted to strengthen our results, which are based on heterogeneous samples and outcomes. In addition, future studies that investigate the comparison of the prognostic ability of different nutritional screening/ assessment tools (such as the MNA, the Patient-Generated Subjective Global Assessment or the Nutritional Risk Screening 2002) or criteria (such as the GLIM-criteria) are needed. Publications should follow the respective guidelines provided by the Enhancing the QUAlity and Transparency Of health Research (EQUATOR) network (https://www.equator-network.org/reporting-guidelines/) to further standardize reporting of studies.
Implications for practice
Based on our observation of negative health and treatment outcomes in patients with poor MNA-result and in light of available effective nutritional interventions, health care professionals should be aware of nutritional status and should support and engage patients to improve their nutritional status before and during anti-cancer therapy.
Conclusions
According to available studies, MNA-result predicts risk of mortality/survival, progression-free survival/time to progression, treatment maintenance and (health-related) quality of life in patients with cancer and does not predict adverse treatment outcomes and functional status/ decline. For other outcomes the results are less clear. A high risk of bias should however be considered. To verify these findings, further studies with good control of potential biases are needed.
Availability of data and materials
Data sharing is not applicable to this article as no datasets were generated or analysed during the current study.
Abbreviations
- HR:
-
Hazard ratio
- LF:
-
Long-form
- MNA:
-
Mini-Nutritional Assessment
- OR:
-
Odds ratio
- PRISMA:
-
Preferred Reporting Items for Systematic Reviews and Meta-Analyses
- RoB:
-
Risk of bias
- SF:
-
Short-form
References
Dicker D, Nguyen G, Abate D, Abate KH, Abay SM, Abbafati C, Abbasi N, Abbastabar H, Abd-Allah F, Abdela J, et al. Global, regional, and national age-sex-specific mortality and life expectancy, 1950-2017: a systematic analysis for the global burden of disease study 2017. Lancet. 2018;392(10159):1684–735.
Global Burden of Disease Study 2017 (GBD 2017) Data Resources. In. http://ghdx.healthdata.org/gbd-results-tool; [assessed 2018-Nov-23].
Roxburgh CS, McMillan DC. Cancer and systemic inflammation: treat the tumour and treat the host. Br J Cancer. 2014;110(6):1409–12.
Inácio Pinto N, Carnier J, Oyama LM, Otoch JP, Alcântara PS, Tokeshi F, Nascimento CM. Cancer as a Proinflammatory environment: metastasis and Cachexia. Mediat Inflamm. 2015;2015:791060.
Farhangfar A, Makarewicz M, Ghosh S, Jha N, Scrimger R, Gramlich L, Baracos V. Nutrition impact symptoms in a population cohort of head and neck cancer patients: multivariate regression analysis of symptoms on oral intake, weight loss and survival. Oral Oncol. 2014;50(9):877–83.
de Vries YC, van den Berg M, de Vries JHM, Boesveldt S, de Kruif J, Buist N, Haringhuizen A, Los M, Sommeijer DW, Timmer-Bonte JHN, et al. Differences in dietary intake during chemotherapy in breast cancer patients compared to women without cancer. Support Care Cancer. 2017;25(8):2581–91.
Edwards BJ, Zhang X, Sun M, Song J, Khalil P, Karuturi MS, Pang L, Geng Y, Dinney CP, Valero V, et al. Overall survival in older patients with cancer. BMJ Support Palliat Care. 2020;10(1):25–35.
Marshall KM, Loeliger J, Nolte L, Kelaart A, Kiss NK. Prevalence of malnutrition and impact on clinical outcomes in cancer services: a comparison of two time points. Clin Nutr. 2019;38(2):644–51.
Pirlich M, Schütz T, Norman K, Gastell S, Lübke HJ, Bischoff SC, Bolder U, Frieling T, Güldenzoph H, Hahn K, et al. The German hospital malnutrition study. Clin Nutr. 2006;25(4):563–72.
Demirel B, Atasoy BM. Comparison of three nutritional screening tools to predict malnutrition risk and detect distinctions between tools in Cancer patients receiving Radiochemotherapy. Nutr Cancer. 2018;70(6):867–73.
Dubhashi SP, Kayal A. Preoperative nutritional assessment in elderly Cancer patients undergoing elective surgery: MNA or PG-SGA? Indian J Surg. 2015;77(Suppl 2):232–5.
Lima EMB, Almeida BL, Gomes HB, Bartochevis JAB, Toniato TS, Lazzarini TR, Pereira TSS, Guandalini VR. Agreement between Graz malnutrition screening (GMS) with subjective nutritional assessment instruments in hospitalized patients. Nutr Hosp. 2018;35(5):1138–44.
Mohile SG, Dale W, Somerfield MR, Schonberg MA, Boyd CM, Burhenn PS, Canin B, Cohen HJ, Holmes HM, Hopkins JO, et al. Practical assessment and Management of Vulnerabilities in older patients receiving chemotherapy: ASCO guideline for geriatric oncology. J Clin Oncol. 2018;36(22):2326–47.
Pallis AG, Fortpied C, Wedding U, Van Nes MC, Penninckx B, Ring A, Lacombe D, Monfardini S, Scalliet P, Wildiers H. EORTC elderly task force position paper: approach to the older cancer patient. Eur J Cancer. 2010;46(9):1502–13.
Wildiers H, Heeren P, Puts M, Topinkova E, Janssen-Heijnen MLG, Extermann M, Falandry C, Artz A, Brain E, Colloca G, et al. International Society of Geriatric Oncology Consensus on geriatric assessment in older patients with Cancer. J Clin Oncol. 2014;32(24):2595–603.
Kenis C, Baitar A, Decoster L, De Grève J, Lobelle JP, Flamaing J, Milisen K, Wildiers H. The added value of geriatric screening and assessment for predicting overall survival in older patients with cancer. Cancer. 2018;124(18):3753–63.
van Abbema DL, van den Akker M, Janssen-Heijnen ML, van den Berkmortel F, Hoeben A, de Vos-Geelen J, Buntinx F, Kleijnen J, Tjan-Heijnen VCG. Patient- and tumor-related predictors of chemotherapy intolerance in older patients with cancer: a systematic review. J Geriatr Oncol. 2019;10(1):31–41.
Arends J, Bachmann P, Baracos V, Barthelemy N, Bertz H, Bozzetti F, Fearon K, Hutterer E, Isenring E, Kaasa S, et al. ESPEN guidelines on nutrition in cancer patients. Clin Nutr. 2017;36(1):11–48.
Arends J, Baracos V, Bertz H, Bozzetti F, Calder PC, Deutz NEP, Erickson N, Laviano A, Lisanti MP, Lobo DN, et al. ESPEN expert group recommendations for action against cancer-related malnutrition. Clin Nutr. 2017;36(5):1187–96.
de van der Schueren MAE, Laviano A, Blanchard H, Jourdan M, Arends J, Baracos VE. Systematic review and meta-analysis of the evidence for oral nutritional intervention on nutritional and clinical outcomes during chemo (radio)therapy: current evidence and guidance for design of future trials. Ann Oncol. 2018;29(5):1141–53.
Sealy MJ, Nijholt W, Stuiver MM, van der Berg MM, Roodenburg JL, van der Schans CP, Ottery FD, Jager-Wittenaar H. Content validity across methods of malnutrition assessment in patients with cancer is limited. J Clin Epidemiol. 2016;76:125–36.
Guigoz Y. The mini nutritional assessment (MNA) review of the literature--what does it tell us? J Nutr Health Aging. 2006;10(6):466–85 discussion 485-467.
Kaiser MJ, Bauer JM, Ramsch C, Uter W, Guigoz Y, Cederholm T, Thomas DR, Anthony P, Charlton KE, Maggio M, et al. Validation of the mini nutritional assessment short-form (MNA-SF): a practical tool for identification of nutritional status. J Nutr Health Aging. 2009;13(9):782–8.
Rubenstein LZ, Harker JO, Salva A, Guigoz Y, Vellas B. Screening for undernutrition in geriatric practice: developing the short-form mini-nutritional assessment (MNA-SF). J Gerontol A Biol Sci Med Sci. 2001;56(6):M366–72.
Vellas B, Villars H, Abellan G, Soto ME, Rolland Y, Guigoz Y, Morley JE, Chumlea W, Salva A, Rubenstein LZ, et al. Overview of the MNA--its history and challenges. J Nutr Health Aging. 2006;10(6):456–63 discussion 463-455.
Torbahn G, Strauß T, Sieber C, Volkert D, Kiesswetter E. Use of mini nutritional assessment (MNA)® in oncological patients - an evidence map. Clin Nutr. 2018;37:S122.
Volkert D, Beck AM, Cederholm T, Cruz-Jentoft A, Goisser S, Hooper L, Kiesswetter E, Maggio M, Raynaud-Simon A, Sieber CC, et al. ESPEN guideline on clinical nutrition and hydration in geriatrics. Clin Nutr. 2019;38(1):10–47.
de Las PR, Majem M, Perez-Altozano J, Virizuela JA, Cancer E, Diz P, Donnay O, Hurtado A, Jimenez-Fonseca P, Ocon MJ. SEOM clinical guidelines on nutrition in cancer patients (2018). Clin Transl Oncol. 2019;21(1):87–93.
Caccialanza R, Pedrazzoli P, Cereda E, Gavazzi C, Pinto C, Paccagnella A, Beretta GD, Nardi M, Laviano A, Zagonel V. Nutritional support in Cancer patients: a position paper from the Italian Society of Medical Oncology (AIOM) and the Italian Society of Artificial Nutrition and Metabolism (SINPE). J Cancer. 2016;7(2):131–5.
Rauh S, Antonuzzo A, Bossi P, Eckert R, Fallon M, Frobe A, Gonella S, Giusti R, Lakatos G, Santini D, et al. Nutrition in patients with cancer: a new area for medical oncologists? A practising oncologist's interdisciplinary position paper. ESMO Open. 2018;3(4):e000345.
Moher D, Liberati A, Tetzlaff J, Altman DG. Preferred reporting items for systematic reviews and meta-analyses: the PRISMA statement. PLoS Med. 2009;6(7):e1000097.
Hayden JA, van der Windt DA, Cartwright JL, Cote P, Bombardier C. Assessing bias in studies of prognostic factors. Ann Intern Med. 2013;158(4):280–6.
Aaldriks AA, Giltay EJ, le Cessie S, van der Geest LG, Portielje JE, Tanis BC, Nortier JW, Maartense E. Prognostic value of geriatric assessment in older patients with advanced breast cancer receiving chemotherapy. Breast. 2013;22(5):753–60.
Aaldriks AA, Giltay EJ, Nortier JW, van der Geest LG, Tanis BC, Ypma P, le Cessie S, Maartense E. Prognostic significance of geriatric assessment in combination with laboratory parameters in elderly patients with aggressive non-Hodgkin lymphoma. Leuk Lymphoma. 2015;56(4):927–35.
Aaldriks AA, Maartense E, le Cessie S, Giltay EJ, Verlaan HA, van der Geest LG, Kloosterman-Boele WM, Peters-Dijkshoorn MT, Blansjaar BA, van Schaick HW, et al. Predictive value of geriatric assessment for patients older than 70 years, treated with chemotherapy. Crit Rev Oncol Hematol. 2011;79(2):205–12.
Aaldriks AA, Maartense E, Nortier HJ, van der Geest LG, le Cessie S, Tanis BC, Portielje JE, Ypma P, Giltay EJ. Prognostic factors for the feasibility of chemotherapy and the geriatric prognostic index (GPI) as risk profile for mortality before chemotherapy in the elderly. Acta Oncol. 2016;55(1):15–23.
Aaldriks AA, van der Geest LG, Giltay EJ, le Cessie S, Portielje JE, Tanis BC, Nortier JW, Maartense E. Frailty and malnutrition predictive of mortality risk in older patients with advanced colorectal cancer receiving chemotherapy. J Geriatr Oncol. 2013;4(3):218–26.
Allaire J, Leger C, Ben-Zvi T, Nguile-Makao M, Fradet Y, Lacombe L, Fradet V. Prospective evaluation of nutritional factors to predict the risk of complications for patients undergoing radical cystectomy: a cohort study. Nutr Cancer. 2017;69(8):1196–204.
Aparicio T, Bouche O, Francois E, Retornaz F, Barbier E, Taieb J, Kirscher S, Etienne PL, Faroux R, Khemissa Akouz F, et al. Geriatric analysis from PRODIGE 20 randomized phase II trial evaluating bevacizumab + chemotherapy versus chemotherapy alone in older patients with untreated metastatic colorectal cancer. Eur J Cancer. 2018;97:16–24.
Araujo JKL, Giglio AD, Munhoz BA, Fonseca FLA, Cruz FM, Giglio AD. Chemotherapy-induced fatigue correlates with higher fatigue scores before treatment. Am J Hosp Palliat Care. 2017;34(5):404–11.
Baier P, Ihorst G, Wolff-Vorbeck G, Hull M, Hopt U, Deschler B. Independence and health related quality of life in 200 onco-geriatric surgical patients within 6 months of follow-up: who is at risk to lose? Eur J Surg Oncol. 2016;42(12):1890–7.
Boulahssass R, Gonfrier S, Ferrero JM, Sanchez M, Mari V, Moranne O, Rambaud C, Auben F, Hannoun Levi JM, Bereder JM, et al. Predicting early death in older adults with cancer. Eur J Cancer. 2018;100:65–74.
D'Almeida CA, Peres WAF, de Pinho NB, Martucci RB, Rodrigues VD, Ramalho A. Prevalence of malnutrition in older hospitalized Cancer patients: a multicenter and multiregional study. J Nutr Health Aging. 2020;24(2):166–71.
Decoster L, Kenis C, Naessens B, Houbier G, De Man M, Lambrecht G, Monsaert E, Moons V, Vergauwe P, Prenen H, et al. Integrating geriatric assessment in the first line chemotherapy treatment in older patients with metastatic colorectal cancer: results of a prospective observational cohort study (AVAPLUS). J Geriatr Oncol. 2018;9(2):93–101.
Decoster L, Quinten C, Kenis C, Flamaing J, Debruyne PR, De Groof I, Focan C, Cornelis F, Verschaeve V, Bachmann C, et al. Health related quality of life in older patients with solid tumors and prognostic factors for decline. J Geriatr Oncol. 2019;10(6):895–903.
Decoster L, Vanacker L, Kenis C, Prenen H, Van Cutsem E, Van Der Auwera J, Van Eetvelde E, Van Puyvelde K, Flamaing J, Milisen K, et al. Relevance of geriatric assessment in older patients with colorectal Cancer. Clin Colorectal Cancer. 2017;16(3):e221–9.
Dubruille S, Libert Y, Roos M, Vandenbossche S, Collard A, Meuleman N, Maerevoet M, Etienne AM, Reynaert C, Razavi D, et al. Identification of clinical parameters predictive of one-year survival using two geriatric tools in clinically fit older patients with hematological malignancies: major impact of cognition. J Geriatr Oncol. 2015;6(5):362–9.
Extermann M, Boler I, Reich RR, Lyman GH, Brown RH, DeFelice J, Levine RM, Lubiner ET, Reyes P, Schreiber FJ 3rd, et al. Predicting the risk of chemotherapy toxicity in older patients: the chemotherapy risk assessment scale for high-age patients (CRASH) score. Cancer. 2012;118(13):3377–86.
Frasca M, Soubeyran P, Bellera C, Rainfray M, Leffondre K, Mathoulin-Pelissier S. Alterations in comprehensive geriatric assessment decrease survival of elderly patients with cancer. Eur J Cancer. 2018;90:10–8.
Ghosn M, Ibrahim T, El Rassy E, Nassani N, Ghanem S, Assi T. Abridged geriatric assessment is a better predictor of overall survival than the Karnofsky performance scale and physical performance test in elderly patients with cancer. J Geriatr Oncol. 2017;8(2):128–32.
Giannotti C, Sambuceti S, Signori A, Ballestrero A, Murialdo R, Romairone E, Scabini S, Caffa I, Odetti P, Nencioni A, et al. Frailty assessment in elective gastrointestinal oncogeriatric surgery: predictors of one-year mortality and functional status. J Geriatr Oncol. 2019;10(5):716–23.
Giannousi Z, Gioulbasanis I, Pallis AG, Xyrafas A, Dalliani D, Kalbakis K, Papadopoulos V, Mavroudis D, Georgoulias V, Papandreou CN. Nutritional status, acute phase response and depression in metastatic lung cancer patients: correlations and association prognosis. Support Care Cancer. 2012;20(8):1823–9.
Gioulbasanis I, Baracos VE, Giannousi Z, Xyrafas A, Martin L, Georgoulias V, Mavroudis D. Baseline nutritional evaluation in metastatic lung cancer patients: mini nutritional assessment versus weight loss history. Ann Oncol. 2011;22(4):835–41.
Gioulbasanis I, Georgoulias P, Vlachostergios PJ, Baracos V, Ghosh S, Giannousi Z, Papandreou CN, Mavroudis D, Georgoulias V. Mini nutritional assessment (MNA) and biochemical markers of cachexia in metastatic lung cancer patients: interrelations and associations with prognosis. Lung Cancer. 2011;74(3):516–20.
Gioulbasanis I, Martin L, Baracos VE, Thezenas S, Koinis F, Senesse P. Nutritional assessment in overweight and obese patients with metastatic cancer: does it make sense? Ann Oncol. 2015;26(1):217–21.
Gioulbasanis I, Patrikidou A, Kitikidou K, Papadimitriou K, Vlachostergios PJ, Tsatsanis C, Margioris AN, Papandreou CN, Mavroudis D, Georgoulias V. Baseline plasma levels of interleukin-8 in stage IV non-small-cell lung cancer patients: relationship with nutritional status and prognosis. Nutr Cancer. 2012;64(1):41–7.
Goineau A, Campion L, d'Aillieres B, Vie B, Ghesquiere A, Bera G, Jaffres D, de Laroche G, Magne N, Artignan X, et al. Comprehensive geriatric assessment and quality of life after localized prostate cancer radiotherapy in elderly patients. PLoS One. 2018;13(4):e0194173.
Gu W, Zhang G, Sun L, Ma Q, Cheng Y, Zhang H, Shi G, Zhu Y, Ye D. Nutritional screening is strongly associated with overall survival in patients treated with targeted agents for metastatic renal cell carcinoma. J Cachexia Sarcopenia Muscle. 2015;6(3):222–30.
Honecker F, Wedding U, Kallischnigg G, Schroeder A, Klier J, Frangenheim T, Weissbach L. Risk factors for unplanned discontinuation of scheduled treatment in elderly patients with castration-resistant prostate cancer: results of the IBuTu study. J Cancer Res Clin Oncol. 2018;144(3):571–7.
Hoppe S, Rainfray M, Fonck M, Hoppenreys L, Blanc JF, Ceccaldi J, Mertens C, Blanc-Bisson C, Imbert Y, Cany L, et al. Functional decline in older patients with cancer receiving first-line chemotherapy. J Clin Oncol. 2013;31(31):3877–82.
Kaibori M, Ishizaki M, Matsui K, Iida H, Inoue K, Nagashima F, Kon M. Geriatric assessment as a predictor of postoperative complications in elderly patients with hepatocellular carcinoma. Langenbeck's Arch Surg. 2016;401(2):205–14.
Kenig J, Olszewska U, Zychiewicz B, Barczynski M, Mitus-Kenig M. Cumulative deficit model of geriatric assessment to predict the postoperative outcomes of older patients with solid abdominal cancer. J Geriatr Oncol. 2015;6(5):370–9.
Kenis C, Decoster L, Bastin J, Bode H, Van Puyvelde K, De Greve J, Conings G, Fagard K, Flamaing J, Milisen K, et al. Functional decline in older patients with cancer receiving chemotherapy: a multicenter prospective study. J Geriatr Oncol. 2017;8(3):196–205.
Kim JW, Kim YJ, Lee KW, Chang H, Lee JO, Kim KI, Bang SM, Lee JS, Kim CH, Kim JH. The early discontinuation of palliative chemotherapy in older patients with cancer. Support Care Cancer. 2014;22(3):773–81.
Kristjansson SR, Jordhøy MS, Nesbakken A, Skovlund E, Bakka A, Johannessen H-O, Wyller TB. Which elements of a comprehensive geriatric assessment (CGA) predict post-operative complications and early mortality after colorectal cancer surgery? J Geriatr Oncol. 2010;1(2):57–65.
Liuu E, Saulnier PJ, Gand E, Ragot S, Valero S, Jamet A, Hadjadj S, Paccalin M. Frailty and diabetes status in older patients with cancer: impact on mortality in the ANCRAGE cohort. Aging Clin Exp Res. 2020.
Lycke M, Ketelaars L, Martens E, Lefebvre T, Pottel H, Van Eygen K, Cool L, Pottel L, Kenis C, Schofield P, et al. The added value of an assessment of the patient's hand grip strength to the comprehensive geriatric assessment in G8-abnormal older patients with cancer in routine practice. J Geriatr Oncol. 2019;10(6):931–6.
Martucci RB, Barbosa MV, D'Almeida CA, Rodrigues VD, Bergmann A, de Pinho NB, Thuler LC. Undernutrition as independent predictor of early mortality in elderly cancer patients. Nutrition. 2017;34:65–70.
Mazzuca F, Roberto M, Arrivi G, Sarfati E, Schipilliti FM, Crimini E, Botticelli A, Di Girolamo M, Muscaritoli M, Marchetti P. Clinical impact of highly purified, Whey Proteins in Patients Affected With Colorectal Cancer Undergoing Chemotherapy: Preliminary Results of a Placebo-Controlled Study. Integr Cancer Ther. 2019;18:1534735419866920.
Michaan N, Park SY, Lim MC. Comprehensive geriatric assessment is correlated to overall survival among gynaecologic oncology patients. Jpn J Clin Oncol. 2020;50(3):276–81.
Molga A, Wall M, Chhetri R, Wee LY, Singhal D, Edwards S, Singhal N, Ross D, To LB, Caughey G, et al. Comprehensive geriatric assessment predicts azacitidine treatment duration and survival in older patients with myelodysplastic syndromes. J Geriatr Oncol. 2020;11(1):114–20.
Naito Y, Sasaki H, Takamatsu Y, Kiyomi F, Tamura K. Retrospective analysis of treatment outcomes and geriatric assessment in elderly malignant lymphoma patients. J Clin Exp Hematop. 2016;56(1):43–9.
Osborne GEC, Appleyard SA, Gilbert DC, Jones CI, Lorimer C, Villanueva M, Peasgood E, Robinson A, Nikapota A, Ring A. Comprehensive geriatric assessment in men aged 70 years or older with localised prostate Cancer undergoing radical radiotherapy. Clin Oncol (R Coll Radiol). 2017;29(9):609–16.
Park S, Hong J, Hwang I, Ahn JY, Cho EY, Park J, Cho EK, Shin DB, Lee JH. Comprehensive geriatric assessment in elderly patients with newly diagnosed aggressive non-Hodgkin lymphoma treated with multi-agent chemotherapy. J Geriatr Oncol. 2015;6(6):470–8.
Quinten C, Kenis C, Decoster L, Debruyne PR, De Groof I, Focan C, Cornelis F, Verschaeve V, Bachmann C, Bron D, et al. Determining clinically important differences in health-related quality of life in older patients with cancer undergoing chemotherapy or surgery. Qual Life Res. 2019;28(3):663–76.
Retornaz F, Guillem O, Rousseau F, Morvan F, Rinaldi Y, Nahon S, Castagna C, Boulahssass R, Grino M, Gholam D. Predicting chemotherapy toxicity and death in older adults with Colon Cancer: results of MOST study. Oncologist. 2020;25(1):e85–93.
Samuelsson KS, Egenvall M, Klarin I, Lökk J, Gunnarsson U. Preoperative geriatric assessment and follow-up of patients older than 75 years undergoing elective surgery for suspected colorectal cancer. J Geriatr Oncol. 2019;10(5):709–15.
Scholtz K, Spies CD, Morgeli R, Eckardt R, von Dossow V, Braun S, Sehouli J, Bahra M, Stief CG, Wernecke KD, et al. Risk factors for 30-day complications after cancer surgery in geriatric patients: a secondary analysis. Acta Anaesthesiol Scand. 2018;62(4):451–63.
Schutte K, Tippelt B, Schulz C, Rohl FW, Feneberg A, Seidensticker R, Arend J, Malfertheiner P. Malnutrition is a prognostic factor in patients with hepatocellular carcinoma (HCC). Clin Nutr. 2015;34(6):1122–7.
Shin D-Y, Lee J-O, Kim YJ, Park M-S, Lee K-W, Kim K-I, Bang S-M, Lee JS, Kim C-H, Kim JH. Toxicities and functional consequences of systemic chemotherapy in elderly Korean patients with cancer: a prospective cohort study using comprehensive geriatric assessment. J Geriatr Oncol. 2012;3(4):359–67.
Shiroyama T, Tamiya M, Minami S, Takata S, Masuhiro K, Futami-Nishijima Y, Uenami T, Mori M, Koba T, Matsuki T, et al. Carboplatin plus weekly nanoparticle albumin-bound paclitaxel in elderly patients with previously untreated advanced squamous non-small-cell lung cancer selected based on mini nutritional assessment short-form scores: a multicenter phase 2 study. Cancer Chemother Pharmacol. 2017;80(3):461–7.
Soubeyran P, Fonck M, Blanc-Bisson C, Blanc JF, Ceccaldi J, Mertens C, Imbert Y, Cany L, Vogt L, Dauba J, et al. Predictors of early death risk in older patients treated with first-line chemotherapy for cancer. J Clin Oncol. 2012;30(15):1829–34.
Stauder R, Augschoell J, Hamaker ME, Koinig KA. Malnutrition in older patients with hematological malignancies at initial diagnosis - association with impairments in health status, Systemic Inflammation and Adverse Outcome. Hemasphere. 2020;4(1):e332.
van der Vlies E, Kurk SA, Roodhart JML, Gerritse FL, Pelgrim TC, Vos JM, Sohne M, Hunting CB, Noordzij PG, van der Velden AMT, et al. The relevance of geriatric assessment for older patients receiving palliative chemotherapy. J Geriatr Oncol. 2020;11(3):482–7.
van Deudekom FJ, van der Velden L-A, Zijl WH, Schimberg AS, Langeveld AP, Slingerland M, Blauw GJ, Mooijaart SP. Geriatric assessment and 1-year mortality in older patients with cancer in the head and neck region: a cohort study. Head & Neck. 2019;41(8):2477–83.
Vande Walle N, Kenis C, Heeren P, Van Puyvelde K, Decoster L, Beyer I, Conings G, Flamaing J, Lobelle JP, Wildiers H, et al. Fall predictors in older cancer patients: a multicenter prospective study. BMC Geriatr. 2014;14:135.
Vlachostergios PJ, Gioulbasanis I, Ghosh S, Tsatsanis C, Papatsibas G, Xyrafas A, Hatzidaki E, Vasiliou C, Kamposioras K, Agelaki S, et al. Predictive and prognostic value of LPS-stimulated cytokine secretion in metastatic non-small cell lung cancer. Clin Transl Oncol. 2013;15(11):903–9.
Muscaritoli M, Lucia S, Farcomeni A, Lorusso V, Saracino V, Barone C, Plastino F, Gori S, Magarotto R, Carteni G, et al. Prevalence of malnutrition in patients at first medical oncology visit: the PreMiO study. Oncotarget. 2017;8(45):79884–96.
Cereda E, Pedrolli C, Klersy C, Bonardi C, Quarleri L, Cappello S, Turri A, Rondanelli M, Caccialanza R. Nutritional status in older persons according to healthcare setting: a systematic review and meta-analysis of prevalence data using MNA((R)). Clin Nutr. 2016;35(6):1282–90.
Cederholm T, Jensen GL, Correia M, Gonzalez MC, Fukushima R, Higashiguchi T, Baptista G, Barazzoni R, Blaauw R, Coats A, et al. GLIM criteria for the diagnosis of malnutrition - a consensus report from the global clinical nutrition community. Clin Nutr. 2019;38(1):1–9.
Contreras-Bolívar V, Sánchez-Torralvo FJ, Ruiz-Vico M, González-Almendros I, Barrios M, Padín S, Alba E, Olveira G. GLIM Criteria Using Hand Grip Strength Adequately Predict Six-Month Mortality in Cancer Inpatients. Nutrients. 2019:11(9).
Yilmaz M, Atilla FD, Sahin F, Saydam G. The effect of malnutrition on mortality in hospitalized patients with hematologic malignancy. Support Care Cancer. 2020;28(3):1441–8.
Einarsson S, Laurell G, Tiblom Ehrsson Y. Mapping the frequency of malnutrition in patients with head and neck cancer using the GLIM criteria for the diagnosis of malnutrition. Clinical Nutrition ESPEN. 2020.
Zhang X, Tang T, Pang L, Sharma SV, Li R, Nyitray AG, Edwards BJ. Malnutrition and overall survival in older adults with cancer: a systematic review and meta-analysis. J Geriatr Oncol. 2019.
Bruijnen CP, van Harten-Krouwel DG, Koldenhof JJ, Emmelot-Vonk MH, Witteveen PO. Predictive value of each geriatric assessment domain for older patients with cancer: a systematic review. J Geriatr Oncol. 2019.
Caillet P, Liuu E, Raynaud Simon A, Bonnefoy M, Guerin O, Berrut G, Lesourd B, Jeandel C, Ferry M, Rolland Y, et al. Association between cachexia, chemotherapy and outcomes in older cancer patients: a systematic review. Clin Nutr. 2017;36(6):1473–82.
Liu J, Jiang S, Yang X, Li X, Wang N. The significant value of preoperative prognostic nutritional index for survival in pancreatic cancers: a meta-analysis. Pancreas. 2018;47(7):793–9.
Zhang Y, Zhang X. Controlling nutritional status score, a promising prognostic marker in patients with gastrointestinal cancers after surgery: a systematic review and meta-analysis. Int J Surg. 2018;55:39–45.
Zhao B, Zhang J, Zhang J, Zou S, Luo R, Xu H, Huang B. The impact of preoperative underweight status on postoperative complication and survival outcome of gastric Cancer patients: a systematic review and meta-analysis. Nutr Cancer. 2018;70(8):1254–63.
Pereira MME, Queiroz M, de Albuquerque NMC, Rodrigues J, Wiegert EVM, Calixto-Lima L, de Oliveira LC. The prognostic role of phase angle in advanced Cancer patients: a systematic review. Nutr Clin Pract. 2018;33(6):813–24.
Barao K, Abe Vicente Cavagnari M, Silva Fucuta P, Manoukian Forones N. Association between nutrition status and survival in elderly patients with colorectal Cancer. Nutr Clin Pract. 2017;32(5):658–63.
Bauer J, Capra S, Ferguson M. Use of the scored patient-generated subjective global assessment (PG-SGA) as a nutrition assessment tool in patients with cancer. Eur J Clin Nutr. 2002;56(8):779–85.
Gallois C, Artru P, Lièvre A, Auclin E, Lecomte T, Locher C, Marthey L, Zaimi Y, Faroux R, Pernot S, et al. Evaluation of two nutritional scores' association with systemic treatment toxicity and survival in metastatic colorectal cancer: an AGEO prospective multicentre study. Eur J Cancer. 2019;119:35–43.
Wiegert EVM, Padilha PC, Peres WAF. Performance of patient-generated subjective global assessment (PG-SGA) in patients with advanced Cancer in palliative care. Nutr Clin Pract. 2017;32(5):675–81.
Martin L, Senesse P, Gioulbasanis I, Antoun S, Bozzetti F, Deans C, Strasser F, Thoresen L, Jagoe R, Chasen M, et al. Diagnostic criteria for the classification of cancer-associated weight loss. J Clin Oncol. 2015;33(1):90–9.
Sena GR, Lima TPF, Mello MJG, Thuler LCS, Lima JTO. Developing machine learning algorithms for the prediction of early death in elderly Cancer patients: usability study. JMIR Cancer. 2019;5(2):e12163.
Lin H, Zhang H, Lin Z, Li X, Kong X, Sun G. Review of nutritional screening and assessment tools and clinical outcomes in heart failure. Heart Fail Rev. 2016;21(5):549–65.
Fallowfield LJ, Fleissig A. The value of progression-free survival to patients with advanced-stage cancer. Nat Rev Clin Oncol. 2011;9(1):41–7.
Saad ED, Katz A. Progression-free survival and time to progression as primary end points in advanced breast cancer: often used, sometimes loosely defined. Ann Oncol. 2009;20(3):460–4.
Tang PA, Bentzen SM, Chen EX, Siu LL. Surrogate end points for median overall survival in metastatic colorectal cancer: literature-based analysis from 39 randomized controlled trials of first-line chemotherapy. J Clin Oncol. 2007;25(29):4562–8.
Kovic B, Jin X, Kennedy SA, Hylands M, Pedziwiatr M, Kuriyama A, Gomaa H, Lee Y, Katsura M, Tada M, et al. Evaluating progression-free survival as a surrogate outcome for health-related quality of life in oncology: a systematic review and quantitative analysis. JAMA Intern Med. 2018;178(12):1586–96.
Man Z, Pang Q, Zhou L, Wang Y, Hu X, Yang S, Jin H, Liu H. Prognostic significance of preoperative prognostic nutritional index in hepatocellular carcinoma: a meta-analysis. HPB (Oxford). 2018;20(10):888–95.
Kanemasa Y, Shimoyama T, Sasaki Y, Hishima T, Omuro Y. Geriatric nutritional risk index as a prognostic factor in patients with diffuse large B cell lymphoma. Ann Hematol. 2018;97(6):999–1007.
Takamori S, Toyokawa G, Taguchi K, Edagawa M, Shimamatsu S, Toyozawa R, Nosaki K, Seto T, Hirai F, Yamaguchi M, et al. The controlling nutritional status score is a significant independent predictor of poor prognosis in patients with malignant pleural mesothelioma. Clin Lung Cancer. 2017;18(4):e303–13.
Ramjaun A, Nassif MO, Krotneva S, Huang AR, Meguerditchian AN. Improved targeting of cancer care for older patients: a systematic review of the utility of comprehensive geriatric assessment. J Geriatr Oncol. 2013;4(3):271–81.
Hamaker ME, Te Molder M, Thielen N, van Munster BC, Schiphorst AH, van Huis LH. The effect of a geriatric evaluation on treatment decisions and outcome for older cancer patients - a systematic review. J Geriatr Oncol. 2018;9(5):430–40.
Gu A, Malahias MA, Strigelli V, Nocon AA, Sculco TP, Sculco PK. Preoperative malnutrition negatively correlates with postoperative wound complications and infection after Total joint Arthroplasty: a systematic review and meta-analysis. J Arthroplast. 2019.
Li S, Zhang J, Zheng H, Wang X, Liu Z, Sun T. Prognostic role of serum albumin, Total lymphocyte count, and mini nutritional assessment on outcomes after geriatric hip fracture surgery: a meta-analysis and systematic review. J Arthroplast. 2019.
Mazzola P, Ward L, Zazzetta S, Broggini V, Anzuini A, Valcarcel B, Brathwaite JS, Pasinetti GM, Bellelli G, Annoni G. Association between preoperative malnutrition and postoperative delirium after hip fracture surgery in older adults. J Am Geriatr Soc. 2017;65(6):1222–8.
Hoogerduijn JG, Buurman BM, Korevaar JC, Grobbee DE, de Rooij SE, Schuurmans MJ. The prediction of functional decline in older hospitalised patients. Age Ageing. 2012;41(3):381–7.
Dent E, Visvanathan R, Piantadosi C, Chapman I. Nutritional screening tools as predictors of mortality, functional decline, and move to higher level care in older people: a systematic review. J Nutr Gerontol Geriatr. 2012;31(2):97–145.
De Saint-Hubert M, Schoevaerdts D, Cornette P, D'Hoore W, Boland B, Swine C. Predicting functional adverse outcomes in hospitalized older patients: a systematic review of screening tools. J Nutr Health Aging. 2010;14(5):394–9.
Fewell Z, Davey Smith G, Sterne JA. The impact of residual and unmeasured confounding in epidemiologic studies: a simulation study. Am J Epidemiol. 2007;166(6):646–55.
Hemkens LG, Ewald H, Naudet F, Ladanie A, Shaw JG, Sajeev G, Ioannidis JPA. Interpretation of epidemiologic studies very often lacked adequate consideration of confounding. J Clin Epidemiol. 2018;93:94–102.
Liang W, Zhao Y, Lee AH. An investigation of the significance of residual confounding effect. Biomed Res Int. 2014;2014:658056.
Acknowledgements
We thank Dr. Volker Müller, FAU for his helpful comments regarding the search strategy.
The present work was performed in partial fulfillment of the requirements for obtaining the degree Dr. rer. Biol. hum (Doctoral Degree in Human Biology) for G.T.
We acknowledge support by Deutsche Forschungsgemeinschaft and Friedrich-Alexander-Universität Erlangen-Nürnberg within the funding programme Open Access Publishing.
Funding
The project was supported by Nestec Ltd. The sponsor had no role in the design and conduct of the study, in the collection, analysis, or interpretation of data, or in the preparation of the manuscript, review, or approval of the manuscript.
Author information
Authors and Affiliations
Contributions
GT, EK, CCS and DV: participated in the design; GT, TS, EK and DV performed data acquisition and interpretation; GT: wrote the manuscript; all authors revised the manuscript and approved the manuscript for publication.
Corresponding author
Ethics declarations
Ethics approval and consent to participate
Not applicable.
Consent for publication
Not applicable.
Competing interests
The authors declare no conflicts of interest related to this work.
Additional information
Publisher’s Note
Springer Nature remains neutral with regard to jurisdictional claims in published maps and institutional affiliations.
Supplementary information
Additional file 1:
Table S1. Search strategy Medline (via Ovid). Table S3a: Results on mortality and poor overall survival (OS) (N = 33). Table S3b: Results on disease progression (progression-free survival (PFS) and time to progression (TTP)) (N = 5). Table S3c: Results on treatment maintenance or duration (N = 11). Table S3d: Results on adverse treatment outcomes (N = 15). Table 3e: Results functional status/ - decline (N = 4). Table S3f: Results (health-related) quality of life (n = 3).
Rights and permissions
Open Access This article is licensed under a Creative Commons Attribution 4.0 International License, which permits use, sharing, adaptation, distribution and reproduction in any medium or format, as long as you give appropriate credit to the original author(s) and the source, provide a link to the Creative Commons licence, and indicate if changes were made. The images or other third party material in this article are included in the article's Creative Commons licence, unless indicated otherwise in a credit line to the material. If material is not included in the article's Creative Commons licence and your intended use is not permitted by statutory regulation or exceeds the permitted use, you will need to obtain permission directly from the copyright holder. To view a copy of this licence, visit http://creativecommons.org/licenses/by/4.0/. The Creative Commons Public Domain Dedication waiver (http://creativecommons.org/publicdomain/zero/1.0/) applies to the data made available in this article, unless otherwise stated in a credit line to the data.
About this article

Cite this article
Torbahn, G., Strauss, T., Sieber, C.C. et al. Nutritional status according to the mini nutritional assessment (MNA)® as potential prognostic factor for health and treatment outcomes in patients with cancer – a systematic review. BMC Cancer 20, 594 (2020). https://doi.org/10.1186/s12885-020-07052-4
Received:
Accepted:
Published:
DOI: https://doi.org/10.1186/s12885-020-07052-4