
Abstract
Background
Potassium (K+) is an essential ion for most plants, as it is involved in the regulation of growth and development. K+ homeostasis in plant cells has evolved to facilitate plant adaptation to K+-deficiency stress. Argonaute1 (AGO1) is regulated by miR168 to modulate the small RNA regulatory pathway by RNA silencing complex (RISC) in tomatoes. However, the role of miR168-mediated regulation of AGO1 in the context of K+ deficiency stress in tomatoes has not been elucidated yet.
Results
SlmiR168 and its target gene SlAGO1A were differentially expressed among low-K+-tolerant JZ34 and low-K+-sensitive JZ18 tomato plants. Transgenic tomato plants constitutively expressing pri-SlmiR168a showed stronger root system growth, better leaves development, and higher K+ contents in roots under K+-deficiency stress than those of the transgenic tomato lines expressing rSlAGO1A (SlmiR168-resistant) and the wild type (WT). Deep sequencing analysis showed that 62 known microRNAs (miRNAs) were up-regulated in 35S:rSlAGO1 compared with WT tomatoes. The same miRNAs were down-regulated in 35S:SlmiR168a compared with WT plants. The integrated analysis found 12 miRNA/mRNA pairs from the 62 miRNAs, including the root growth and cytokinin (CTK)/abscisic acid (ABA) pathways.
Conclusions
The regulation mediated by SlmiR168 of SlAGO1A contributes to the plant development under low-K+ stress. Moreover, this regulation mechanism may influence downstream miRNA pathways in response to low-K+ stress through the CTK/ABA and root growth modulation pathways.
Background
Macronutrients and micronutrients are the elements required necessarily for growth and development of plants [1]. N (Nitrogen), P (Phosphorus) and K (Potassium) were needed at relatively large amounts for plants. Phosphorus deficiency could reduces the plant growth and biomass production [2, 3]. It is more important especially in tomato production systems, which require substantial inputs of nitrogen fertilizer [4]. K+ is also a kind of the essential macronutrients that is involved in many physiological processes in plant cells, such as osmoregulation, ion homeostasis, photosynthesis, membrane potential maintenance, cell turgor, and others [5]. These functions rely on a high and relatively stable concentration of K+ in cellular compartments and K+ movement between different cellular compartments, cells, and tissues. Accordingly, K+ must be readily transported and K+ flow must be tightly regulated. In the soil, K+ is taken up by plants through root absorption. The K+ concentration in the cytoplasm is generally maintained at approximately 100 mM [6]. Compared with the high K+ concentration in cells, the concentration of K+ in the soil is very low. Moreover, because of the direct contact with the soil by roots of the plant, K+ deficiency signal is first perceived by root cells, particularly root epidermal cells and root hair cells [7]. Plants respond to K+ deficiency by altering root growth and root configuration, such as inhibiting primary roots and stimulating root hair elongation [8]. We described previously that the low-K+ tolerant JZ34 and low-K+ sensitive JZ18 tomato genotypes display different root configurations under K+-deficiency stress [9].
Low K+ stress can excite the activity of many signaling molecules, including reactive oxygen species (ROS), Ca2+, plant hormones, and microRNAs (miRNAs) in plant cells [10]. In Arabidopsis, K+ deficiency induces ROS production and the expression of the NADPH oxidase gene RHD2 and the peroxidation enzyme gene RCI3 [11]. In addition to ROS, Ca2+ also acts as a low K+ response signal. Ca2+ sensors (CBL1 and CBL9) participate in the low-K+ response and their target protein kinase CIPK23 also interact with AKT1 for K+ absolution [12]. Moreover, the Ca2+ reporter YC3.6 can also be induced by low K+ stress [9]. Many phytohormones signal transduction pathways are involved in response to K+-deficiency stress, such as ethylene, auxin, cytokinin (CTK), and abscisic acid (ABA). It was reported that ethylene production under K+-deficiency stress is upregulated [11, 13]. Moreover, ethylene signaling can also regulate AtHAK5 transcription and root growth in Arabidopsis thaliana [14]. In addition, low-K+ treatment reduced the auxin accumulation by decreasing the auxin transporter AtPIN1 protein [15]. The K+ transporter AtTRH1/AtKUP is also regulated by the localization of AtPIN1 and influences K+-dependent root architecture in A. thaliana [16, 17]. Low-K+ stress also induces OsHAK16p:WOX11, an integrator of auxin and cytokinin signaling, resulting in enhanced root growth and development [18]. CTK accumulation decreases under low-K+ stress, with a concomitant increased ROS production [19]. A previous study suggested that the inhibitory effect of ABA on K+ uptake might be related to K+-ATPase [20]. The addition of 5 μM ABA inhibited the transport of K+ under low-K+ stress [21]. Collectively, these data suggest that phytohormone signaling pathways could synergistically regulate root morphology and K+ transport or accumulation under low-K+ stress conditions.
Transcriptional regulation that act as key roles, eventually mediating downstream plant responses, particularly under stress conditions [22]. miRNAs as the post-transcriptional factors, were few investigated in the role response to the K+ deficiency, compared to other nutrient elements [23, 24]. It has been shown that the miR444/MADS-box model, as well as pathways mediated by miR319/TCP4 and miR396/GRF, may contribute to low-K+ tolerance in barley plants [25]. In O. sativa, miR399 is induced by low-K+ stress [23]. We previously found that the JZ18 and JZ34 tomato genotypes have a different miRNAs expression pattern under K+ deficiency stress, as determined by miRNA-seq. In particular, we found that miRNA168 was significantly differentially expressed in both JZ18 and JZ34 tomato genotypes under K+ deficiency stress, and validated that, in tomato; Actually, miRNA168 was confirmed to target the Argonaute1 (AGO1) in tomato [26]. In plants, after RNase III Dicer-like 1 cutting, the miRNA strand of the miRNA: miRNA* duplex is loaded into an AGO protein, which has a single-stranded RNA-binding PAZ domain and an RNaseH-like PIWI domain to catalyze mRNA cleavage or translational repression [27, 28]. The AGO protein is a core element of the RNA induced silencing complex (RISC), a transcriptional and post-transcriptional regulator that is guided by small RNAs to repress target genes expression. MiRNAs are loaded into AGO1, which acts as an RNA slicer [29]. Fifteen SlAGO genes were detected in tomato [30]. SlAGO1A, SlAGO1B, and SlAGO2A are targeted by conserved miRNAs [30]. In Arabidopsis, the fine-tuned post-transcriptional regulation of miR168 and AGO1 levels maintains the homeostasis of other miRNAs combined with AGO1, control the target genes expression levels of miRNA [31]. Kidner and Martienssen reported that ago1 showed the leaf polarity defect which was caused by an abnormal distribution of miRNAs and their targets are known to control leaf polarity [32]. Moreover, it has been shown that the steady-state levels of several transcription factors targeted by miRNAs are increased in leaves of ago1 plants [33]. AGO proteins levels are also crucial in virus defense: overexpression of AGO proteins induces plant development disorder during virus infection [34]. The interaction of AC2 with AGO1 was confirmed after Tomato leaf curl New Delhi virus [35]. In addition, miR168a regulating SlAGO1s affected the pathogenesis-related genes in tomato plants to change the resistance to disease [36].
In this study, we aimed to evaluate the balance between SlmiR168 and SlAGO1 (SlAGO1A) expression in response to K+ deficiency stress in Solanum lycopersicum. We characterized the plant phenotype in response to low-K+ stress conferred by 35S:SlmiR168a and 35S:rSlAGO1. We discovered that 35S:SlmiR168a plants had a stronger root system and better leaf development than those of 35S:rSlAGO1 plants under low-K+ stress. This prompted us to use miRNA-Seq and mRNA-Seq to assess the miRNAs potential regulatory mechanism of SlmiR168-mediated regulation of SlAGO1A in response to K+ deficiency.
Results
Differential expression of SlmiR168 and SlAGO1A in JZ18 and JZ34
JZ34 tomatoes (low-K+-tolerant), compared to JZ18 tomatoes (low-K+-sensitive), show better root development and K+ absorption under K+ deficiency conditions [9]. According to our previous study, SlmiR168 is differentially expressed between JZ18 and JZ34 tomatoes under K+ deficiency stress. In this study, we first performed quantitative reverse transcription PCR (RT-PCR) and observed that the expression levels of SlmiR168 increased with time in JZ18 tomatoes under normal conditions. However, under K+ deficiency stress, the SlmiR168 levels decreased in a time-dependent manner (Fig. 1a). In contrast, in JZ34 tomatoes, the expression levels of SlmiR168 significantly increased under K+ deficiency stress, particularly after 3, 5, and 7 days of treatment (Fig. 1c). This expression pattern suggested that SlmiR168 expression might be involved in the regulation of tomatoes tolerance to K+ deficiency. The expression levels of the target gene, SlAGO1A, showed a complementary pattern. SlAGO1A expression levels were up-regulated after K+ deficiency stress treatment for 3 and 5 days in JZ18 (Fig. 1b). The target AGO1A expression levels were obviously decreased under K+ deficiency compared with that under normal conditions in JZ34 tomatoes (Fig. 1d). As a target of SlmiR168, SlAGO1A showed a complementary expression pattern, and the expression of SlmiR168 actually responded to the low K+ stress. The differential expression patterns of SlmiR168 and SlAGO1A between JZ18 and JZ34 tomatoes may be a cause of the variations in tolerance of the two tomato genotypes under low K+ stress.
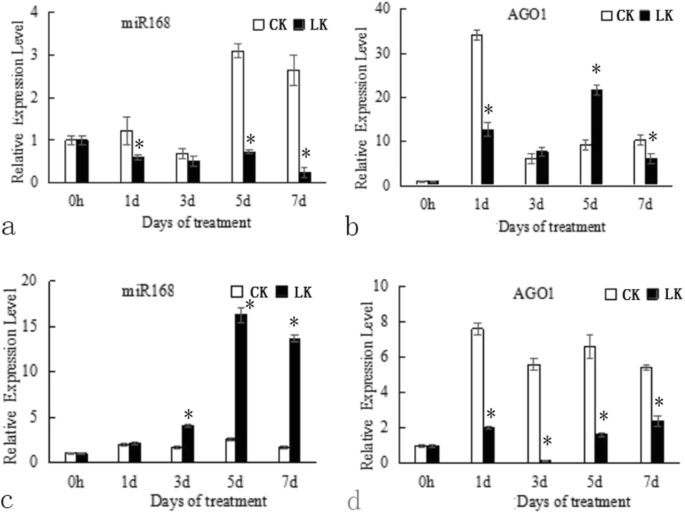
SlmiR168 and SlAGO1A expression profiles in JZ18 and JZ34 plants under normal K+ conditions and K+ deficiency conditions. Samples of leaves were collected at 0, 1, 3, 5, and 7 days after treatment. a. the miR168 expression levels in JZ18 seedlings under normal K+ and K+ deficiency conditions; b. the SlAGO1A expression levels in JZ18 seedlings under normal K+ and K+ deficiency conditions; c. the miR168 expression levels in JZ34 seedlings under normal K+ and K+ deficiency conditions; d. the SlAGO1A expression levels in JZ34 seedlings under normal K+ and K+ deficiency conditions. CK: normal K+ (4 mM); LK: K+ deficiency (0.5 mM). Error bars indicate the means ± SE of three independent replicates. * Significant differences with P < 0.05 determined using a Duncan’s test compared with the CK
Analysis of SlmiR168 and SlAGO1A expression in different tissues
The expression of SlmiR168 and SlAGO1A in different tissues of tomato plants was evaluated by RT-PCR (Fig. 2). SlmiR168 and SlAGO1A were detected in all tissues. The expression levels of SlmiR168 were highest in the leaves and flowers, followed by the roots and stems. Conversely, in the stems, leaves, and flowers, SlAGO1A showed the opposite expression pattern.
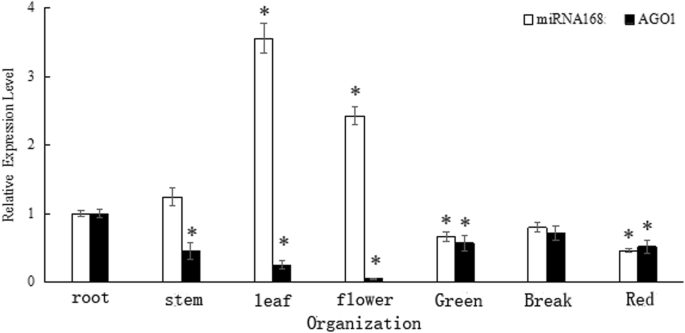
SlmiR168 and SlAGO1A expression profiles in different ‘JZ18’ tomato tissues (roots, stems, leaves, flowers, green fruits, break fruits and red fruits). The tomatoes were grown in the normal conditions. Error bars indicate the means ± SE of three independent replicates. * Significant differences with P < 0.05 determined using a Duncan’s test compared with the control
Regulation of SlAGO1A by SlmiR168 increases plant tolerance to K+ deficiency stress
To elucidate whether the regulation of SlAGO1 by SlmiR168a was responsible for differences in low K+ tolerance, 37 transformants of 35S:SlmiR168a and 6 transformants of 35S:rSlAGO1 were obtained. The expression levels of SlmiR168 and the target gene SlAGO1A of transformants were list in supporting files (Fig. S8 a and b). SlmiR168-resistant constructs (rSlAGO1A) were generated using the point mutation (Fig. 3a), which did not change the native protein sequence of SlAGO1 by mutation of four bases. Furthermore, rSlAGO1A can’t be regulated by SlmiR168, so 35S:rSlAGO1 transformants could illustrate the role of the regulation of SlmiR168. The rSlAGO1 and pri-SlmiR168a fragments were amplified by PCR for overexpression vector construction (Fig. 3b and c; Referring to the original figures: Figs. S6 and S7); 35S:SlmiR168a ‘Line 4’and 35S:rSlAGO1 ‘Line 2′ transformants were selected for experiments. The root morphology of WT, 35S:SlmiR168a, and 35S:rSlAGO1 all showed a larger root system after 7 days of development at the normal K+ concentration (4 mM) (Fig. S5). However, in the presence of low K+ concentration (0.5 mM), the roots of 35S:SlmiR168a plants appeared stronger than WT and 35S:rSlAGO1 plants after 7 days of treatment. Microexamination revealed that the number of root hairs was obviously increased in 35S:SlmiR168a plants following low K+ treatment at 7 days compared with that in WT and 35S:rSlAGO1 plants (Fig. 4a). Leaf development was also observed under K+ deficiency stress (Fig. 4b). The leaf margins of WT plants turned yellow under low K+ conditions, and those of 35S:rSlAGO1 plants showed increased yellowing; in contrast, 35S:SlmiR168a plants did not exhibit yellowing of the leaves. Analysis of the root-shoot ratio (Fig. 4c) showed that under low K+ conditions, root-shoot ratios of 35S:SlmiR168a plants did not differ significantly compared with that in WT plants. However, 35S:rSlAGO1 plants exhibited a decreased root-shoot ratio compared with WT and 35S:SlmiR168a plants. Additionally, the chlorophyll content was highly increased in 35S:SlmiR168a plants but decreased in WT and 35S:rSlAGO1 plants under K+ deficiency stress compared with the normal K+ condition (Fig. 4d). Chlorophyll contents in 35S:rSlAGO1 plants were significantly lower than WT plants under low K+ conditions (Fig. 4d). Chlorophyll contents in 35S:SlmiR168a plants were significantly higher than WT plants under low K+ conditions (Fig. 4d). Analysis of K+ contents in roots (Fig. 4e) showed that under normal K+ concentration conditions, 35S:SlmiR168a plants showed increased K+ contents with development time, particularly reached the peak at 7 days of treatment. Under K+ deficiency stress, 35S:SlmiR168a plants also showed significantly higher K+ contents than WT plants at 7 days treatment, whereas 35S:rSlAGO1 plants exhibited a little lower K+ contents than WT plants at 7 days treatment. Under low K+ concentration conditions, 35S:SlmiR168a plants exhibited improved root and leaf growth under K+ deficiency stress. Moreover, 35S:SlmiR168a plants exhibited higher K+ contents in roots under K+ deficiency stress. So 35S:SlmiR168a plants demonstrated the better tolerance to K+ deficiency stress than 35S:rSlAGO1 and WT plants .

Mutant SlAGO1A transgenic transcripts were resistant to SlmiR168-mediated cleavage in tomatoes. a. Representation of the constructs used for transgenic expression of the SlmiR168-resistant mutant (rSlAGO1A) in tomatoes. Mutations were introduced at four locations (in red), and these base changes did not affect the native protein sequence. b. Amplification of the rSlAGO1 cDNA band located at 3100 bp. c. Amplification of the pri-SlmiR168a band at 159 bp

Comparison of morphological changes in WT, 35S:SlmiR168a ‘Line 4’, and 35S:rSlAGO1 ‘Line 2’ plants under normal K+ conditions and K+ deficiency stress after 7 days of treatment. a. Changes in the root hair region in WT, 35S:SlmiR168a, and 35S:rSlAGO1 plants under CK and LK conditions after 7 days (100 × magnification) with three biological replicates. b. Differences in the fifth leaf from the bottom up in WT, 35S:SlmiR168a, and 35S:rSlAGO1 plants under CK and LK conditions after 15 days. c. Root-shoot ratios in WT, 35S:SlmiR168a, and 35S:rSlAGO1 plants under CK and LK conditions after 7 days with three biological replicates. * Significant differences with P < 0.05 determined using a Duncan’s test compared with the CK. d. Chlorophyll contents of the leaves in WT, 35S:SlmiR168a, and 35S:rSlAGO1 plants under CK and LK conditions after 7 days with three biological replicates.* Significant differences with P < 0.05 determined using a Duncan’s test compared with the CK. e. K+ contents of the roots in WT, 35S:SlmiR168a, and 35S:rSlAGO1 plants under CK and LK conditions after 3 and 7 days with three biological replicates. * Significant differences with P < 0.05 determined using a Duncan’s test compared with the CK. CK: normal K+ (4 mM); LK: K+ deficiency (0.5 mM)
Analysis of miRNA sequencing data in 35S:SlmiR168a and 35S:rSlAGO1 plants
To identify miRNAs regulated by SlmiR168-mediated SlAGO1A in response to K+ deficiency stress, nine small RNA libraries were constructed from WT, 35S:SlmiR168a, and 35S:rSlAGO1 samples. In total, 12,836,013, 14,373,027, 13,912,496, 14,850,199, 17,821,390, 12,006,556, 17,470,288, 12,383,616, and 25,030,158 raw reads were generated by high-throughput sequencing for the three kinds of samples and three replicates (Table S2). After data processing, including filtration of small RNAs except miRNAs, 7,163,035, 11,223,930, 9,849,836, 8,542,869, 10,694,993, 7,571,073, 10,723,320, 9,305,655, and 16,653,370 total valid reads, corresponding to 2,575,545, 4,694,297, 4,410,072, 3,159,839, 3,691,188, 2,895,817, 3,862,724, 4,199,533, and 53,931,63 unique reads were acquired in the libraries of WT, 35S:SlmiR168a, and 35S:rSlAGO1 plants (with three replicates each), respectively. The most valid reads were 20–24 nt in length, with 24-nt reads being the most common among all three genotypes (Fig. 5a). Totally, 1168 conserved miRNAs and 1060 predicted novel miRNAs were identified in the nine small RNA libraries (Table S3). Details about family members of conserved miRNA are list in Table S4. Overall, 68 conserved miRNA families were contained in all the differentially expressed miRNAs.

Differentially expressed miRNAs in WT, 35S:SlmiR168a ‘Line 4’, and 35S:rSlAGO1 ‘Line 2’ plants. a. Length distribution of total identified miRNAs. b. Numbers of differetially expressed miRNAs in 35S:rSlAGO1 plants compared with WT and 35S:SlmiR168a plants compared with WT. P < 0.05, 0.01, or 0.001
Analysis of miRNAs differential expressed in the two transgenic tomato plants
When comparing 35S:SlmiR168a plants with WT plants, 122 miRNAs expression levels were significantly upregulated (fold change > 2; P < 0.1), whereas 110 miRNAs expression levels were significantly downregulated (fold change > 2; P < 0.1; Fig. 5b; Table S5). When comparing 35S:rSlAGO1 plants with WT plants, 102 miRNAs expression levels were significantly upregulated (fold change > 2; P < 0.1), whereas 58 miRNAs expression levels were significantly downregulated (fold change > 2; P < 0.1; Fig. 5b; Table S6). 62 known miRNAs which expression levels were upregulated when 35S:rSlAGO1 comparing to WT plants, but downregulated when 35S:SlmiR168a comparing to WT plants were listed in Fig. 6a. There were 120 known miRNAs which expression levels were downregulated when comparing 35S:rSlAGO1 and WT plants, but upregulated when comparing 35S:SlmiR168a and WT plants (Fig. 6b). The repression post-transcriptional regulation of the targets by the 62 known miRNAs might be induced by the RISC which containing AGO1 protein regulated by miR168 in 35S:rSlAGO1.

Heatmap showing differential expressed miRNAs. a. The differential expressed miRNAs that were significantly up-regulated in 35S:rSlAGO1 ‘Line 2’ compared with WT, but down-regulated in 35S:SlmiR168a ‘Line 4’ compared with WT; b. The differential expressed miRNAs that were significantly down-regulated in 35S:rSlAGO1 ‘Line 2’ compared with WT, but up-regulated in 35S:SlmiR168a ‘Line 4’ compared with WT. Color panels illustrate the log2 value of fold change
Functional analysis of miRNA predicted targets
One hundred seven differentially expressed miRNAs of both 35S:rSlAGO1 plants compared with WT and 35S:SlmiR168a plants compared with WT were identified (Table S7), and the identified putative target genes were listed in Table S8. Gene ontology (GO) enrichment analysis for the predicted targets of the 107 miRNAs identified 20 terms, including nucleus, plasma membrane, and ATP binding, that changed significantly (P < 0.00015) between the two transgenic tomato plants compared with those in the WT plants (Fig. 7a). Pathway enrichment analysis for the predicted targets of the 107 miRNAs identified 20 pathways, including ABC transporters, glycerophospholipid metabolism, circadian rhythm-plant, and RNA degradation, that changed significantly (P < 0.05) between the two transgenic tomato plants compared with those in the WT plants (Fig. 7b).

The predicted target genes of 107 differentially expressed miRNAs of both 35S:rSlAGO1 plants compared with WT and 35S:SlmiR168a plants compared with WT. a. GO analysis of predicted targets of 107 differentially expressed miRNAs (20 terms). b. KEGG pathway enrichment analyses of predicted targets of 107 differentially expressed miRNAs (20 pathways)
Integrated analysis of differentially expression miRNAs and mRNAs from 35S:SlmiR168a and 35S:rSlAGO1 plants compared with WT plants
There is a regulatory relationship between miRNAs and mRNAs, and this relationship can be established through target gene prediction. In this study, we found 113 miRNA/mRNA predicted target pairs in the comparison of 35S:SlmiR168a and WT plants, including positive and negative correlations (Table S9), and 93 miRNA/mRNA pairs in the comparison of 35S:rSlAGO1 and WT plants, including positive and negative correlations (Table S10). Owing to various regulatory factors, the expression of mRNAs by miRNAs did not have a completely inverse relationship, both positive and negative correlations were detected. In most cases that miRNAs promote the targets cleavage, the complementary expression pattern of miRNAs/mRNA pairs were chosen to be further analyzed. There were 74 negative miRNA/mRNA interaction pairs in the comparison of 35S:SlmiR168a with WT (Table S9) and 49 negative miRNA/mRNA interaction pairs in the comparison of 35S:rSlAGO1 with WT (Table S10). Although AGO1 is known to be important for the stabilization of miRNAs, its role in miRNA production has not been established [27]. However, we chose 10 upregulated miRNA and downregulated mRNA interaction pairs in the comparison of 35S:rSlAGO1 with WT and two downregulated miRNA and upregulated mRNA interaction pairs in the comparison of 35S:SlmiR168a with WT (Table 1). Thus, these miRNAs were thought to be stabilized by AGO1 protein. GO analysis of the 12 negative miRNA/mRNA pairs included 28 functional processes involving the CTK-activated signaling pathway, responses to salt stress, and responses to abscisic acid (ABA) (Figs. S1 and S3). Additionally, pathway enrichment analysis of the 12 negative miRNA/mRNA pairs included four pathways, involving plant/pathogen interactions, plant hormone signal transduction, base excision repair, and histidine metabolism (Fig. S2).
RT-PCR identification of differentially expressed miRNAs and mRNAs
The expression patterns of 10 differentially expressed known miRNAs (stu-miR530_L-2R + 2, stu-miR-8039_R + 3_1ss4CT, stu-miR-384-5p_R + 1, ppe-miR-858_1ss4GA, ath-miR-171a-3p_L-3R + 1, PC-3p-276756_24, PC-5p-289257_23, PC-5p-66618_119, stu-miR-8006-p3_1ss8GA_1, and stu-miR-8007b-p3_1ss22CT) and their 12 differentially expressed target genes (Solyc04g008110.3.1, Solyc07g063510.3.1, Solyc03g113890.1.1, Solyc06g076850.3.1, Solyc05g006420.3.1, Solyc08g069180.3.1, Solyc12g056040.1.1, Solyc05g006420.3.1, Solyc04g082420.3.1, Solyc08g066260.3.1, Solyc09g097780.2.1, and Solyc09g064820.1.1) were further performed by quantitative RT-PCR (qRT-PCR) (Table 1). These miRNAs/mRNAs pairs showed the same expression patterns as those performed in the miRNA-Seq/mRNA-Seq data. These similar expression tendencies suggested that the sequencing data were reliable for the further study.
Correlation analysis of miRNAs and their target genes responsive to K+ deficiency stress
From the 10 differentially expressed mature miRNAs, 7 known miRNAs and their 8 target genes were chosen. Then their expression under K+ deficiency stress was evaluated by RT-PCR (Fig. 8). Based on our results, 5 miRNA-target pairs (stu-miR530/protein YnbB-like, stu-miR530/histidine kinase 4, stu-miR8039/endochitinase A-like, ppe-miR858/ARR5, and stu-miR8006/cold and drought-regulated protein CORA-like) exhibited a negative relationship at the expression level and, indicating that a transcriptional repression may be mediated on these targets through corresponding miRNAs under K+ deficiency stress. Furthermore, three other miRNA-target pairs (ath-miR171a/U-box domain-containing protein 52-like, stu-miR8007b/EID1-like F-box protein 3, and stu-miR384/protein LOC107012202 isoform X1) demonstrated a similar expression tendency, although the expression pattern at 7 days after K+ deficiency stress was complementary. Importantly, the miRNAs expression levels were all up-regulated at 7 days after K+ deficiency stress, whereas expression levels of their targets were down-regulated. Thus, the expression levels of these miRNAs-target pairs indicated their response to K+ deficiency stress with the time earlier or later.

Quantitative real-time PCR validation of seven differentially expressed miRNAs and their predicted target genes in low K+ sensitive JZ18 tomatoes under normal conditions and K+ deficiency stress (0.5 mM) at the time 0d, 4 h, 8 h, 24 h, 3d, 5d and 7d. The experiments were repeated three times
CTK/ABA regulation by SlmiR168 mediated SlAGO1A involved in the tolerance to K+ deficiency stress in tomato plants
We found many genes involved in the biosynthesis and signaling of CTK and ABA biosynthesis that were downregulated in 35S:rSlAGO1 and upregulated in 35S:SlmiR168a plants (Fig. 9a and b). This result prompted us to further investigate the influence of SlmiR168-mediated SlAGO1A regulation of the CTK and ABA pathway. Indeed, we found that the CTK and ABA contents in JZ18 and JZ34 tomatoes were different under K+ deficiency stress (Fig. 10). In particular, the JZ34 CTK content was significantly higher than that in JZ18 as the low-K+ treatment time increased (Fig. 10a). However, under normal conditions, the CTK content was lower in JZ34 plants than that in JZ18 plants. The same pattern was observed for the ABA content (Fig. 10b). The CTK/ABA contents were also investigated in 35S:SlmiR168a and 35S:rSlAGO1. The CTK and ABA content were significantly higher in 35S:SlmiR168a than JZ18 and 35S:rSlAGO1 (Fig. 10c). Our results suggest that the CTK/ABA biosynthesis and signaling pathways were enhanced in 35S:SlmiR168a which showed tolerance to low-K+ stress, but lowered in 35S:rSlAGO1 which showed sensitive to low-K+ stress.

Heatmap showing DEGs encoding proteins related to abscisic acid (ABA) signalling and biosynthesis (a) and cytokinin (CTK) signalling and biosynthesis (b) in 35S:SlmiR168a compared with WT and 35S:rSlAGO1 compared with WT respectively. Color panels illustrate the log2 value of fold change

Comparison of CTK and ABA contents in low K+ sensitive (JZ18) and low K+ tolerant (JZ34) tomatoes under K+ deficiency stress conditions after 24 h, 3 days, and 7 days (a and b); CTK and ABA contents of JZ18, 35S:SlmiR168a and 35S:rSlAGO1 under normal condition (c). CK: normal K+ (4 mM); LK: K+ deficiency (0.5 mM). The experiments were repeated three times. Error bars indicate the means ± SE of three independent replicates. * Significant differences with P < 0.05 determined using a Duncan’s test compared with the control
Discussion
K+ deficiency in soil is of great agricultural importance. One important aspect of plant adaptation to K+ deficiency stress is cellular and tissue homeostasis of K+, which involves transport of K+ across various membranes in several tissues [37]. The two tomato genotypes low-K+-tolerant JZ34 and low-K+-sensitive JZ18 exhibit marked differences in sensitivity to K+ deficiency and root morphology [9]. Moreover, JZ34 has more root hairs under K+ deficiency treatment than JZ18 and exhibits stronger nutritional uptake capability of K+ than JZ18 [9]. Thus, JZ34 maintains higher K+ contents under K+ deficiency stress than JZ18. Plants cannot escape from the various environmental stress, they have developed complex regulatory mechanisms in response to the effects of these stress [38]. For further exploring the molecular mechanisms of difference between JZ18 and JZ34, we found that the expression of SlmiR168 was increased in response to low K+, whereas the expression of its target SlAGO1A was decreased following low K+ treatment in JZ34 (Fig. 1). Both SlmiR168 and SlAGO1A were expressed at higher levels in roots than in other tissues (Fig. 2). Additionally, 35S:SlmiR168a had more root hairs than 35S:rSlAGO1 and JZ18 (Fig. 4a). Actually, in addition to the roots, we also found difference in plant height between 35S:SlmiR168a and 35S:rSlAGO1 plants (Fig. S9). Notably, the potassium deficiency signal is first perceived by root cells, particularly root epidermal cells and root hair cells [7]. So the root phenotype seems more important in response to low K+ stress. 35S:SlmiR168a showed more tolerant to low K+ deficiency than 35S:rSlAGO1. Furthermore, the mRNA-Seq also demonstrated some Potassium transport genes were differetially expressed in 35S:SlmiR168a and 35S:rSlAGO1 (Table S11 and S12). Integrated analysis of mRNA-Seq and miRNA-Seq results in 35S:rSlAGO1 showed that a member of the miR171 family was significantly induced and that its target Solyc08g069180.3.1 was downregulated (Table 1). Further analysis showed that this target gene was involved in root epidermal cell differentiation and stress responses. Previous studies have shown that miR171 expression is higher in the vascular bundle and cuticle layer of roots in Arabidopsis [39] and that this miRNA is upregulated in response to Cd stress, drought, and salt stress [40, 41]. miR171 has also been shown to be differentially expressed in maize roots in response to salt stress [42]. miR171 was showed to be upregulated in 4 m-SlAGO1A plants compared to the wild type [26]. Therefore, we concluded that regulation of Solyc08g069180.3.1 by miR171a may explain differences in root development between 35S:SlmiR168a and 35S:rSlAGO1 under K+ deficiency stress (Fig. 11).

Hypothetical model of the SlmiR168-mediated SlAGO1A regulation upon K+ deficiency stress response. SlAGO1A regulation by SlmiR168 is involved in various processes, including root growth, the CTK signalling pathway, and the ABA signalling pathway, by influencing the regulatory pathways of other miRNAs (e.g., ath-miR171a, stu-miR530, stu-miR384, ppe-miR858 and stu-miR8007b)
In addition to root architecture, phytohormones are also involved in signal transduction of plant responses to K+ deficiency stress. Low K+ stress results in decreased CTK levels, which may stimulate ROS accumulation, root hair growth, and AtHAK5 expression [19]. The KAT1 potassium channel is a target for ABA signal transduction through SRK1/OST1/SnRK2.6 [43]. Additionally, expression of the K+ release channel gene GORK is induced by ABA in the presence of extracellular Ca2+ [44]. In this study, we found that the low K+ tolerant tomato JZ34 had higher CTK/ABA contents under K+ deficiency stress than the low K+ sensitive tomato JZ18. Integrated analysis of mRNA-Seq and miRNA-Seq results for the comparison of 35S:rSlAGO1 versus JZ18 showed that miR384, miR530, and miR858 were upregulated and that their downregulated targets were enriched in the CTK signaling pathway and CTK responses. CTK accumulation decreases ROS production [19]. The excessive production of ROS that damage macromolecules, including lipids, proteins and so on in plant cells [45]. So JZ34 was more tolerant to K+ deficiency stress than JZ18, probably causing by the SlAGO1A regulated by miR168 to influence CTK signal adjusting the damage of the ROS on the plant cells. Moreover, we found that targets of miR384, miR530, and miR858 were also involved in plant hormone signal transduction by KEGG analysis. Additionally, target genes of the novel miRNA PC-3p-276756_24 were found to be involved in CTK responses. Interestingly, in 35S:SlmiR168a, only miR8006 and miR8007b were downregulated, and their upregulated targets were upregulated and enriched in response to salt stress and ABA. Accordingly, our results showed that SlAGO1A induced repression of the targets expression which regulated by various miRNAs, including miR384, miR530, miR858, miR8007, and PC-3p-276756_24, through the regulation of SlmiR168a. What is more, the CTK/ABA content were especially increased in 35S:miR168a in our study. These miRNA/mRNA pairs may influence tolerance to K+ deficiency stress in plants via the CTK/ABA signaling pathway (Fig. 11). K+ transport via ABA signaling requires extracellular Ca2+ [44], and P68 protein combines with AGO1 to interact with CaM and enhance accumulation of K+ in rice [46]. Thus, P68 expression was investigated in 35S:SlmiR168a and 35S:rSlAGO1 (Fig. S4). P68 expression levels were decreased in 35S:rSlAGO1 but increased in 35S:SlmiR168a compared with those in WT. Based on these findings, the pathway through which SlAGO1A was regulated by SlmiR168 in response to K+ deficiency stress via ABA signaling may require Ca2+.
miRNAs are loaded onto AGO1, which acts as an RNA slicer in plants [47]. miR168 directs the cleavage of AGO1 mRNA, indicating that miR168 regulates the activity of its own miRNA pathway [33]. AGO1-null alleles reduce the expression levels of some miRNAs, such as miR171, and increase the levels of the corresponding target mRNAs [33]. In 35S:SlmiR168a, the expression of miR168 indicates the following regulation pathway: SlmiR168 is up-regulated, the accumulation of SlmiR168 represses the expression of SlAGO1A. As losing the SlAGO1A binding to the RISC, the expression of the targets regulated by other miRNAs which bind to the RISC containing SlAGO1A would be up-regulated. So we tend to discover the expression of targets is up-regulated by the miRNAs expression which were down-regulated in 35S: SlmiR168a. Moreover, in 35S:SlmiR168a, miR8006 and miR8007 were downregulated, and their targets were upregulated. In 35S:rSlAGO1, the expression of rSlAGO1A is up-regulated, and rSlAGO1A cannot be regulated by SlmiR168, so the function of RISC is promoted to bind the downstream miRNAs. So the targets post-transcriptional regulation of other miRNAs which binding to RISC containing SlAGO1A would be enhanced. Finally, we found eight miRNAs were upregulated, and their targets were downregulated in 35S:rSlAGO1. Thus, these miRNAs above may be associated with AGO1A protein, and impairment of AGO1-miR168 feed-back regulation could disturb the maintenance of suitable SlAGO1A for the plant development and response to the environment. Additionally, in 35S:SlmiR168a, 71 miRNAs were also found to be upregulated, and their targets were downregulated. These miRNAs included many widely known molecules, such as miR167, miR156, miR396, miR166, miR319b, and miR172. These miRNAs may be involved in various hormone signaling pathways, including auxin, ethylene, and gibberellin signaling. In AGO1-null plants, miR156/157 and miR167 were also found to accumulate to levels similar to or higher than those in WT plants [33]. Furthermore, Lynn et al. [48] reported that PINHEAD/ZWILLE is 75% similar to and has overlapping functions with AGO1. AGO proteins can bind to single-stranded RNAs that are at least 5 nt in length and to double-stranded RNA, enabling AGO protein to directly associate with miRNAs before and after they recognize their mRNA targets [49]. AGO1 might even act before miRNA processing [32]. The tomato AGO family have 15 members, and besides SlAGO1A and SlAGO1B were regulated by SlmiR168a, the SlAGO2A was also regulated by miR403 [30]. If the overaccumulation of SlmiR168 influences other AGO family members or other miRNAs needs further confirmation. In addition, our results showed that SlmiR168-targeted SlAGO1A may be involved in K+ deficiency stress in shoot and root. 35S:SlmiR168a plants displayed more tolerance to K+ deficiency stress both in root and shoot compared to WT plants under K+ deficiency stress (Fig. 4a and b). However, 35S:rSlAGO1 plants could show more sensitive to K+ deficiency stress in shoot than in root (Fig. 4b). Homology of SlAGO1A and SlAGO1B was 88%, but the percentage of Q in SlAGO1B was much higher than that in SlAGO1A [30]. The expression of SlAGO1A was different from that of SlAGO1B in fruit development [30]. 4 m-SlAGO1A demonstrated a little different defects in flowers from the 4 m-SlAGO1B transformants [26]. These indicates that SlAGO1A and SlAGO1B might play different roles in tomato development. Under K+ deficiency stress, the other SlAGO1 protein, SlAGO1B may mainly cause the difference in root phenotype between 35S:SlmiR168a and 35S:rSlAGO1 plants. Importantly, miRNAs are regulated by AGO in time and space, resulting in finely-tuned and complex regulatory networks. Thus, miR168 may function with AGO1 to control the mRNA levels of miRNA targets through a complex network.
Based on analysis of miRNAs and mRNAs responding to K+ deficiency stress, we developed a model of miR168-mediated AGO1 function in low K+ tolerance (Fig. 11). SlAGO1A is regulated by SlmiR168 in response to K+ deficiency stress, and overexpression of SlAGO1A then induces the expression of miR530, miR384 and miR858, resulting in enhancing the post-transcriptional silencing of the targets regulated by these miRNAs, which participate in CTK signaling. SlAGO1A accumulation also induces miR171 expression and then downregulates its targets, which are involved in root epidermal cell differentiation to inhibit the root hair growth under low-K+ stress. Moreover, SlmiR168-mediated SlAGO1A regulates the expression of miR8007, which is involved in the ABA signaling pathway; Ca2+ may have functions in this pathway as well. So the regulation of SlmiR168 on the SlAGO1A is vital for the maintaining SlAGO1 at a steady level to maintain the normal plant growth under low-K+ stress.
Conclusion
In this study, the RISC containing SlAGO1A regulated by SlmiR168 influenced part of the other miRNAs post-transcriptional regulation. These miRNAs (miR530, miR384, miR858, miR171 and miR8007) further target various mRNA in response to low-K+ in different pathways by modulation of root growth and CTK/ABA biosynthesis and signaling. The overexpression of pri-SlmiR168a improves the tolerance of tomato plants in response to low-K+ stress. Collectively, our results revealed new regulation pathways of SlmiR168-mediated SlAGO1A in response to low K+ stress and highlighted the importance of SlAGO1A in maintaining the homeostasis of miRNA accumulation. This study provides new perspectives in the molecular and breeding mechanisms to improve the tolerance of tomato plants to low-K+ environmental stress.
Methods
Plant materials and growth conditions
Two tomato genotypes ‘JZ34’ (low K+-tolerant) and ‘JZ18’ (low K+-sensitive) were obtained in our lab by higher generation inbred lines and introduced in detail about the low-K+ tolerance by Zhao et al. in 2018 [9]. These tomato seeds were saved in our lab. These tomato seedlings were grown under standard greenhouse conditions, including a day/night temperature condition of 26/18 °C with a photoperiod of 16 h light/8 h dark. 25 days old seedlings were washed with water, and transferred to pot for nutrient hydroponics. The nutrient solution formula was performed as described previously [9]. At the vegetative growing stage (30 days), a K+ − deficient condition was induced by reducing the concentration of KNO3 from 4 mM (normal K+) to 0.5 mM (K+ deficiency) in the nutrient solution. Nutrient solution with 4 mM KNO3 was used as the control. After 7 days of K+ deficiency stress, different parts of the plant were sampled to assess plant root configuration, fresh weight, and K+ content.
Measurement of K+ concentrations
A total of 0.05 g (dry weight) tomato roots were added to a 10-mL centrifuge tube containing 2 mL of 0.5 M hydrochloric acid. Samples were incubated for 3 days, after which, 5 mL deionized water was added to each centrifuge tube, and the mixture was filtered. The filtered stock solution was diluted 10 times, and the K+ concentration was measured with a flame photometer. Each sample was evaluated with three biological replicates.
35S:SlmiR168a and 35S:rSlAGO1 vector construction and tomato transformation
Pri-SlmiR168a was prepared using gene-specific primers. The sequence-confirmed polymerase chain reaction (PCR) fragment was cloned into the pCAMBIA3301/Luc plasmid, which contained two 35S Cauliflower mosaic virus promoters, the marker gene for kanamycin resistance, phosphinothricin, and luciferase. Recombinant plasmids containing the expected insert were transferred into Agrobacterium tumefaciens GV3101 cells. The competent cells harboring the vector were transformed into JZ18 tomatoes using a tomato genetic transformation system [50]. Expression of the target gene was detected in the T1 transformants and their corresponding T2 using qRT-PCR along with detection of the presence of the kanamycin marker gene. All primers used in this study are listed in Supplementary Table S1. To generate rSlAGO1A (the SlmiR168-resistant construct), mutations in the SlmiR168 target site of SlAGO1A were inserted using two-step PCR mutagenesis. The 35S:SlAGO1 transformants were obtained using the same method described above for 35S:SlmiR168a.
Small RNA sequencing and analysis of differentially expressed miRNAs
35S:SlmiR168a, 35S:rSlAGO1, and JZ18 were used as small RNAs. In total, nine samples (35S:SlmiR168a, 35S:rSlAGO1, and JZ18, each with three replicates) were harvested. About 2.5 μg total RNA obtained from the tomato leaves was used to construct small RNA library by TruSeq Small RNA Sample Prep Kits (Illumina, San Diego, CA, USA). Then sequencing was used by an Illumina Hiseq2500 50SE platform (single end) at LC-BIO (Hangzhou, China) following the manufacturer’s instructions. The detailed information of sequencing was referred to description previously reported [51]. The identification of conserved and novel miRNAs are summarized in Table S2.
Prediction of target genes of miRNAs
GSTAr.pl was used to predict the genes targeted by the differentially expressed miRNAs. The minimum free energy (MFE) of miRNA-cDNA duplexes was calculated with the RNAhybrid program [52,53,54] with the following parameters: MFE ratio ≥ 0.65; and Allen Score ≤ 10. Then, a modified version the CleaveLand4 program was used to identify the potential cleavage sites of miRNAs in the corresponding targets based on degradome data http://sites.psu.edu/axtell/software/cleaveland4/) [55].
RNA exaction and transcriptome sequencing, annotation
Tomato leaflet samples were collected from JZ18, 35S:rSlAGO1, and 35S:SlmiR168a plants at the same stage and position, total RNA was extracted and Illumina Miseq libraries were constructed, following the manufacturer’s instructions. Each sample had three biological replicates. The mRNA which were used polyT oligos magnetic beads was purified from the total RNA. The fragments were cleaved by the fragmentation buffer. The first-strand cDNA was synthesized by using random hexamer primers and then transformed into double-stranded cDNA using RNase H and DNA polymerase I, and then linked with sequencing adapters. The sequencing library was constructed by PCR amplification and performed by using the Illumina Hiseq 2500 platform (LC-BIO Technology Co., Ltd.). For functional annotation, the differential expressed genes enrichment analyses were performed by Gene Ontology (GO) Blast2GO software (http://www.blast2go.org/) and KEGG Automatic Annotation Sever (http://www.genome.jp/tools/kaas/).
Integrated analysis of mRNA-seq and miRNA-seq data
CGT101-CORR 1.1 software was used to define the possible positive and negative interactions between miRNA and mRNA were used A According to the constructed miRNA/mRNA regulatory network, the integrated analysis of miRNA-seq with mRNA-seq data was performed by combining the differentially expressed miRNAs and mRNAs with the associated miRNA-targeting information. Then the differentially expressed miRNA-targeting information was also taken into account.
qRT-PCR analysis
Total RNA from the samples of leaves was extracted using TRIzol (Takara, Dalian, China) followed by RQ1 Dnase I (Promega, Madison, WI, USA) treatment to remove genomic DNA contamination. DNA-free RNA (2 μg) was used for cDNA synthesis. For the mature miRNA expression detection is used by the RT primer, which effectively binds to the 3′ end of the miRNA. The RT-PCR for target mRNAs and mature miRNA system was performed as described previously [56]. The templates were mixed with the SYBR Green PCR Master Mix on the ABI 7500 sequence detection system and software (Applied Biosystems, USA). Each measurement was repeated using three technical replicates, and the RNA samples of three biological replicates were mixed. The expression levels were normalized to the tomato U6 small nuclear RNA for miRNA quantification and actin was used for the mRNA quantification [56]. The primers are listed in Supplementary Table S1.
ABA and CTK quantification
ABA and CTK were quantified using the enzyme-linked immunosorbent assay protocol [57]. The fresh tomato leaves were collected as weigh as 0.5 g–1.0 g. The method in detail for quantification of ABA and CTK was referred to the performance previously reported [56]. The absorbance of the antibodies against ABA and CTK was recorded at 490 nm. The samples of leaves were repeated with three biological replicates, and three technical replicates.
Statistical analysis
At least three biological replicates were evaluated for all experiments; data are presented as the mean ± standard deviation. Statistical analyses (One-Way ANOVA by Duncan’s method) were performed using the SPSS software (version 17.0). A P < 0.05 was considered as statistically significant.
Availability of data and materials
The raw reads of this study were deposited in the SRA database (http://www.ncbi.nlm.nih.gov/sra/) at NCBI with SRA accession number (Small RNA sequencing: PRJNA615321; Transcriptome sequencing: PRJNA615315 and PRJNA615767).
Change history
08 February 2021
A Correction to this paper has been published: https://doi.org/10.1186/s12870-021-02855-4
Abbreviations
- ABA:
-
Abscisic acid
- CTK:
-
Cytokinin
- CK:
-
Control check
- LK:
-
Low potassium stress
- GO:
-
Gene ontology
- KEGG:
-
Kyoto encyclopedia of genes and genomes
- ABC transporter:
-
ATP-binding cassette transporter
- RISC:
-
RNA induced silencing complex
- RT-PCR:
-
Reverse transcription polymerase chain reaction
- WT:
-
Wild type
- ROS:
-
Reactive oxygen species
- CaM:
-
Calmodulin
References
Ahammed GJ, Wu MJ, Wang YQ, Yan YR, Mao Q, Ren JJ, Ma RH, Liu AR, Chen SC. Melatonin alleviates iron stress by improving iron homeostasis, antioxidant defense and secondary metabolism in cucumber. Sci Hortic. 2020;265:109205.
Sulieman S, Tran LS. Phosphorus homeostasis in legume nodules as an adaptive strategy to phosphorus deficiency. Plant Sci. 2015;239:36–43.
Zhang Y, Liang Y, Zhao X, Jin X, Hou LP, Shi Y, Ahammed GJ. Silicon compensates phosphorus deficit-induced growth inhibition by improving photosynthetic capacity, antioxidant potential, and nutrient homeostasis in tomato. Agron J. 2019;9(733):1–16.
Zotarelli L, Scholber JM, Dukes MD, Munoz-Carpena R, Icerman J. Tomato yield, biomass accumulation, root distribution and irrigation water use efficiency on a sandy soil, as affected by nitrogen rate and irrigation scheduling. Agr Water Manage. 2009;96(1):23–34.
Clarkson DT, Hanson JB. The mineral nutrition of higher plants. Annu Rev Plant Physiol. 1980;31:239–98.
Besford RT, Maw GA. Effect of potassium nutrition on tomato plant growth and fruit development. Plant Soil. 1975;42:395–412.
Song WJ, Xue R, Song Y, Bi Y, Liang ZH, Meng L, Dong CX, Wang CD, Liu GL, Dong JX, Zhang YL. Differential response of first-order lateral root elongation to low potassium involves nitric oxide in two tobacco cultivars. J Plant Growth Regul. 2018;37:114–27.
Cao Y, Glass AD, Crawford NM. Ammonium inhibition of Arabidopsis root growth can be reversed by potassium and by auxin resistance mutations aux1, axr1 and axr2. Plant Physiol. 1993;102:983–9.
Zhao XM, Liu Y, Liu X, Jiang J. Comparative transcriptome profiling of two tomato genotypes in response to potassium-deficiency stress. Int J Mol Sci. 2018;19:2402.
Wang Y, Wu WH. Regulation of potassium transport and signaling in plants. Curr Opin Plant Biol. 2017;39:123–8.
Shin R, Schachtman DP. Hydrogen peroxide mediates plant root response to nutrient deprivation. Proc Natl Acad Sci U S A. 2004;101:8827–32.
Li L, Kim B, Cheong YH, Pandey GK, Luan S. A Ca2+ signaling pathway regulates a K+ channel for low-K response in Arabidopsis. PNAS. 2006;103(33):12625.
Sakai H, Hua J, Chen GQ, Chang C, Bleecker AB, Meyerowitz EM. ETR2 is an ETR1-like gene involved in ethylene signal transduction in Arabidopsis. Proc Natl Acad Sci U S A. 1998;95:5812–7.
Schachtman DP. The role of ethylene in plant response to K+ deficiency. Front Plant Sci. 2015;6:1153.
Li J, Wu WH, Wang Y. Potassium channel AKT1 is involved in the auxin-mediated root growth inhibition in Arabidopsis response to low K+ stress. J Integr Plant Biol. 2017;59(12). https://doi.org/10.1111/jipb.12575.
Rigas S, Ditengou FA, Ljung K, Daras G, Tietz O, Palme K, Hatzopoulos P. Root gravitropism and root hair development constitute coupled developmental responses regulated by auxin homeostasis in the Arabidopsis root apex. New Phytol. 2013;197:1130–41.
Dolan L. Pointing PINs in the right directions: a potassium transporter is required for the polar localization of auxin efflux carriers. New Phytol. 2013;197:1027–8.
Chen G, Feng HM, Hu QD, Qu HY, Chen A, Yu L, Xu GH. Improving rice tolerance to potassium deficiency by enhancing OsHAK16p:WOX11-controlled root development. Plant Biotechnol J. 2015;13(6):833–48.
Nam YJ, Tran LS, Kojima M, Sakakibara H, Nishiyama R, Shin R. Regulatory roles of cytokinins and cytokinin signaling in response to potassium deficiency in Arabidopsis. PLoS One. 2012;7:e47797.
Dhakal MR, Erdei L. Long-term effects of abscisic acid on K+ transport in young wheat plants of different K+ status. Physiol Plantarum. 1986;68(4):637–40.
Behl R, Jeschke WD. On the action of Abscisic acid on transport, accumulation, and uptake of K+ and Na+ in excised barley roots; effect of the accompanying anions. Zeitschrift Fur Pflanzenphysiologie. 1979;95(4):335–53.
Ahammed GJ, Lin X, Wan HJ, Zhou GZ, Cheng Y. SlWRKY81 reduces drought tolerance by attenuating proline biosynthesis in tomato. Sci Hortic. 2020;270:109444.
Hu B, Wang W, Deng K, Li H, Zhang Z, Zhang L, Chu C. MicroRNA399 is involved in multiple nutrient starvation responses in rice. Front Plant Sci. 2015;6:188.
Kulcheski FR, Correa R, Gomes IA, de Lima JC, Margis R. NPK macronutrients and microRNA homeostasis. Front Plant Sci. 2015;6:451.
Zeng J, Ye Z, He X, Zhang G. Identification of microRNAs and their targets responding to low-potassium stress in two barley genotypes differing in low-K+ tolerance. J Plant Physiol. 2019;234-235:44–53.
Xian Z, Huang W, Yang YW, Tang N, Chao Z, Ren MZ, Li ZG. miR168 influences phase transition, leaf epinasty, and fruit development via SlAGO1s in tomato. J Exp Bot. 2014;65(22):6655–66.
Reinhart BJ, Weinstein EG, Rhoades MW. MicroRNAs in plants. Genes Dev. 2002;16:1616–26.
Tomari Y, Zamore PD. Perspective: machines for RNAi. Genes Dev. 2005;19:517–29.
Qi Y, Denli AM, Hannon GJ. Biochemical specialization within Arabidopsis RNA silencing pathways. Mol Cell. 2005;19:421–8.
Xian ZQ, Yang YW, Huang W, Tang N, Wang XY, Li ZG. Molecular cloning and characterization of SlAGO family in tomato. BMC Plant Biol. 2013;13:126.
Vaucheret H, Mallory AC, Bartel DP. AGO1 homeostasis entails coexpression of MIR168 and AGO1 and preferential stabilization of miR168 by AGO1. Mol Cell. 2006;22:129–36.
Kidner CA, Martienssen RA. Spatially restricted microRNA directs leaf polarity through ARGOUNTE1. Nature. 2004;428:81–4.
Vaucheret H, Vazquez F, Crete P, Bartel DP. The action of ARGONAUTE1 in the miRNA pathway and its regulation by the miRNA pathway are crucial for plant development. Genes Dev. 2004;18:1187–97.
Bai M, Yang GS, Chen WT, Mao ZC, Kang HX, Chen GH, Yang YH, Xie BY. Genome-wide identification of dicer-like, Argonaute and RNA-dependent RNA polymerase gene families and their expression analyses in response to viral infection and abiotic stresses in Solanum lycopersicum. Gene. 2012;501(1):52–62.
Kumar V, Naqvi AR. Tomato leaf curl New Delhi virus (ToLCNDV) encoded AC2 associates with host mirnas by directly interacting with AGO1. J RNAi Gene Silencing. 2016;12:515–20.
Hou XX, Cui J, Liu WW, Jiang N, Zhou XX, Qi HY, Meng J, Luan YS. LncRNA39026 enhances tomato resistance to Phytophthora infestans by decoying miR168a and inducing PR gene expression. Genet Res. 2020;110(4):1943.
Amtmann A, Hammond JP, Armengaud P, White PJ. Nutrient sensing and signalling in plants: potassium and phosphorus. Adv Bot Res. 2005;43:209–57.
Ganie SA, Ahammed GJ, Wani SH. Vascular plant one zinc-finger (VOZ) transcription factors: novel regulators of abiotic stress tolerance in rice (Oryza sativa L.). Genet Resour Crop Evol. 2020. https://doi.org/10.1007/s10722-020-00904-9.
Mahale BM, Fakrudin B, Ghosh S, Krishnaraj PU. LNA mediated in situ hybridization of miR171 and miR397a in leaf and ambient root tissues revealed expressional homogeneity in response to shoot heat shock in Arabidopsis thaliana. J Plant Biochem Biot. 2014;23(1):93–103.
Liu HH, Tian X, Li YJ, Wu CA, Zheng CC. Microarray-based analysis of stress-regulated microRNAs in Arabidopsis thaliana. RNA. 2008;14:836–43.
Zhou X, Wang G, Sutoh K, Zhu JK, Zhang W. Identification of cold-inducible microRNAs in plants by transcriptome analysis. Biochem Biophys Acta. 2008;1779:780–8.
Ding D, Zhang LF, Wang H, Liu ZJ, Zhang ZX, Zheng YL. Differential expression of miRNAs in response to salt stress in maize roots. Ann Bot. 2009;103:29–38.
Sato A, Sato Y, Fukao Y, Fujiwara M, Umezawa T, Shinozaki K, Hibi T, Taniguchi M, Miyake H, Goto DB, Uozumi N. Threonine at position 306 of the KAT1 potassium channel is essential for channel activity and is a target site for ABA-activated SnRK2/OST1/SnRK2.6 protein kinase. Biochem J. 2009;424:439–48.
Becker D, Hoth S, Ache P, Wenkel S, Roelfsema MRG, Meyerhoff O, Hartung W, Hedrich R. Regulation of the ABA-sensitive Arabidopsis potassium channel gene GORK in response to water stress. FEBS Lett. 2003;554:119–26.
Hasan MK, Ahammed GJ, Sun SC, Li MQ, Yin HQ, Zhou J. Melatonin inhibits cadmium translocation and enhances plant tolerance by regulating sulfur uptake and assimilation in Solanum lycopersicum L. J Agric Food Chem. 2019. https://doi.org/10.1021/acs.jafc.9b02404.
Banu MSA, Huda KMK, Sahoo RK, Garg B, Tula S, Islam SMS, Tuteja R, Tuteja N. Pea p68 imparts salinity stress tolerance in Rice by scavenging of ROS-mediated H2O2 and interacts with Argonaute. Plant Mol Biol Rep. 2015;33:221–38.
Baumberger N, Baulcombe DC. Arabidopsis ARGONAUTE1 is an RNA slicer that selectively recruits microRNAs and short interfering RNAs. Proc. Natl. Acad. Sci. U S A. 2005;102:11928–33.
Lynn K, Fernandez A, Aida M, Sedbrook J, Tasaka M, Masson P, Barton MK. The PINHEAD/ZWILLE gene acts pleiotropically in Arabidopsis development and has overlapping functions with the ARGONAUTE1 gene. Dev. 1999;126:469–81.
Yan KS, Yan S, Farooq A, Han A, Zeng L, Zhou MM. Structure and conserved RNA binding of the PAZ domain. Nature. 2003;426:468–74.
Wang YL, Zou WX, Xiao Y, Cheng LN, Liu YD, Gao S, Shi ZH, Jiang Y, Qi MF, Xu T, Li TL. MicroRNA1917 targets CTR4 splice variants to regulate ethylene responses in tomato. J Exp Bot. 2018 Feb 23;69(5):1011–25.
Zhang GS, Yin SW, Mao JQ, Liang FF, Zhao C, Li P, Zhou GQ, Chen SQ, Tang ZL. Integrated analysis of mRNA-seq and miRNA-seq in the liver of Pelteobagrus vachelli in response to hypoxia. Sci Rep. 2016;6:22907.
Kruger J, Rehmsmeier M. RNAhybrid: microRNA target prediction easy, fast and flexible. Nucleic Acids Res. 2006;34:W451–4.
Rehmsmeier M, Steffen P, Hochsmann M, Giegerich R. Fast and effective prediction of microRNA/target duplexes. RNA. 2004;10(10):1507–17.
Tafer H, Hofacker IL. RNAplex: a fast tool for RNA-RNA interaction search. Bioinformatics. 2008;24(22):2657–63.
Addo-Quaye C, Miler W, Axtel MJ. Cleaveland: a pipeline for using degradome data to find cleaved small RNA targets. Bioinformatics. 2009;25(1):130–1.
Liu X, Xu T, Dong XF, Liu YD, Liu ZH, Shi ZH, Wang YL, Qi MF, Li TL. The role of gibberellins and auxin on the tomato cell layers in pericarp via the expression of ARFs regulated by miRNAs in fruit set. Acta Physiol Plant. 2016;38:77–88.
Weiler EW, Jourdan PS, Conrad W. Levels of indole-3-acetic acid in intact and decapitated coleoptiles as determined by a specific and decapitated coleoptiles as determined by a specific and highly sensitive solid-phase enzyme immunoassay. Planta. 1981;153:561–71.
Acknowledgements
We would like to thank Editage (www.editage.cn) for English language editing.
Funding
Material construction, miRNA sequencing, transcriptional sequencing and data analyses in this work was financially supported by the “National Key R&D Program of China” (2019YFD1000301–03), “National Natural Science Foundation of China” (31801847) and “Doctor Started Fund of Liaoning Province” (20180540059).
Author information
Authors and Affiliations
Contributions
LX, LTL and JJ conceived and designed the research. LX, TCC and CX performed the experiments and data analysis. LX and JJ wrote the article. LTL and ZXM revised the manuscript. All authors read and approved the manuscript.
Corresponding author
Ethics declarations
Ethics approval and consent to participate
Not applicable.
Consent for publication
Not applicable.
Competing interests
No conflicts of interest declared.
Additional information
Publisher’s Note
Springer Nature remains neutral with regard to jurisdictional claims in published maps and institutional affiliations.
Supplementary information
Additional file 1:
Table S1. Primers used in this study.
Additional file 2: Table S2.
The profiles of small RNA deep sequencing for 35S:SlmiR168a, 35S:rSlAGO1 and WT.
Additional file 3: Table S3.
List of all expressed miRNA in 35S:SlmiR168a, 35S:rSlAGO1 and WT.
Additional file 4: Table S4.
The expressed conserved miRNAs were classified into different miRNAs families.
Additional file 5: Table S5.
List of the differentially expressed miRNAs in 35S:SlmiR168a plants compared with WT.
Additional file 6: Table S6.
List of the differentially expressed miRNAs in 35S:rSlAGO1 plants compared with WT.
Additional file 7: Table S7.
List of the miRNAs whose target genes are predicted.
Additional file 8: Table S8.
Target predict annotation for the differentially expressed miRNAs.
Additional file 9: Table S9.
miRNA/mRNA pairs in the comparison of 35S:SlmiR168a and WT plants, with upregulated/upregulated,downregulated/downregulated, upregulated/downregulated, downregulated/upregulated by integrated analysis of miRNA-Seq and mRNA-Seq.
Additional file 10: Table S10.
miRNA/mRNA pairs in the comparison of 35S:rSlAGO1 and WT plants, with upregulated/upregulated,downregulated/downregulated, upregulated/downregulated, downregulated/upregulated by integrated analysis of miRNA-Seq and mRNA-Seq.
Additional file 11: Table S11.
List of the differentially expressed mRNAs in 35S:SlmiR168a plants compared with WT.
Additional file 12: Table S12.
List of the differentially expressed mRNAs in 35S:rSlAGO1 plants compared with WT.
Additional file 13: Table S13.
The biomass of the roots and shoots in JZ18, 35S:miR168a and 35S:rSlAGO1 under the normal and K+ deficiency stress conditions.
Additional file 14: Figure S1.
GO analyses of the 10 negative miRNA/mRNA pairs identified in the comparison of 35S:rSlAGO1 and WT plants by integrated analysis of miRNA-Seq and mRNA-Seq.
Additional file 15: Figure S2.
KEGG pathway enrichment analyses of the 10 negative miRNA/mRNA pairs identified in the comparison of 35S:rSlAGO1 and WT plants by integrated analysis of miRNA-Seq and mRNA-Seq.
Additional file 16: Figure S3.
GO analyses of the 2 negative miRNA/mRNA pairs identified in the comparison of 35S:SlmiR168a and WT plants by integrated analysis of miRNA-Seq and mRNA-Seq.
Additional file 17: Figure S4.
Quantitative real-time PCR validation of P68 in 35S:SlmiR168a, 35S:rSlAGO and WT. The experiments were repeated three times.
Additional file 18: Figure S5.
Comparison of morphological changes of root growth in WT, 35S:SlmiR168a, and 35S:rSlAGO1 plants under normal K+ conditions and K+ deficiency stress after 7 days.
Additional file 19: Figure S6.
Full-length rSlAGO1 gel and blots. The red line inner part is the cropping part in Fig. 3b. The marker is 10,000 bp.
Additional file 20: Figure S7.
Full-length of pre-SlmiR168a gel and blots. The black line inner part is the cropping part in Fig. 3c. The marker is 2000 bp.
Additional file 21: Figure S8.
The expression levels of SlmiR168 in 35S:SlmiR168a transformation lines; the expression levels of SlAGO1A in 35S:rSlAGO1 transformation lines. * Significant differences with P < 0.05 determined using a Duncan’s test compared with the WT.
Additional file 22: Figure S9.
The phenotype of the whole plants of JZ18, 35S:SlmiR168a and 35S:rSlAGO1 under the normal condition.
Rights and permissions
Open Access This article is licensed under a Creative Commons Attribution 4.0 International License, which permits use, sharing, adaptation, distribution and reproduction in any medium or format, as long as you give appropriate credit to the original author(s) and the source, provide a link to the Creative Commons licence, and indicate if changes were made. The images or other third party material in this article are included in the article's Creative Commons licence, unless indicated otherwise in a credit line to the material. If material is not included in the article's Creative Commons licence and your intended use is not permitted by statutory regulation or exceeds the permitted use, you will need to obtain permission directly from the copyright holder. To view a copy of this licence, visit http://creativecommons.org/licenses/by/4.0/. The Creative Commons Public Domain Dedication waiver (http://creativecommons.org/publicdomain/zero/1.0/) applies to the data made available in this article, unless otherwise stated in a credit line to the data.
About this article

Cite this article
Liu, X., Tan, C., Cheng, X. et al. miR168 targets Argonaute1A mediated miRNAs regulation pathways in response to potassium deficiency stress in tomato. BMC Plant Biol 20, 477 (2020). https://doi.org/10.1186/s12870-020-02660-5
Received:
Accepted:
Published:
DOI: https://doi.org/10.1186/s12870-020-02660-5