
Abstract
Background
Calvin cycle plays a crucial role in carbon fixation which provides the precursors of organic macromolecules for plant growth and development. Currently, no gene involved in Calvin cycle has been identified in monocotyledonous plants through mutant or/and map-based cloning approach.
Results
Here, we isolated a low-tillering mutant, c6635, in rice (Oryza sativa). The mutant displayed light green leaves and intensely declined pigment contents and photosynthetic capacity at early growth stage. Moreover, its individual plant showed a much smaller size, and most individuals produced only two tillers. At mature stage, its productive panicles, grain number and seed setting rate were significantly decreased, which lead to a sharp reduction of the grain yield. We confirmed that a single nucleotide mutation in LOC_Os04g16680 gene encoding sedoheptulose 1,7-bisphosphatase (SBPase) involved in Calvin cycle was responsible for the mutant phenotype of c6635 through map-based cloning, MutMap analysis and complementation experiments. Sequence analysis suggested that the point mutation caused an amino acid change from Gly-364 to Asp at the C-terminal of SBPase. In addition, OsSBPase gene was mainly expressed in leaf, and the encoded protein was located in chloroplast. The mutation of OsSBPase could significantly affect expression levels of some key genes involved in Calvin cycle.
Conclusions
We successfully identified a SBPase gene in monocotyledonous plants. Meanwhile, we demonstrated that a single nucleotide substitution at the 3′-end of this gene severely affects plant growth and grain yield, implying that the Gly-364 at the C-terminal of SBPase could play an important role in SBPase function in rice.
Background
The energy that human and other life on Earth depend on originally come from the Sun. Photosynthesis, as the sole biological process converting solar energy into chemical energy, is of great importance for human survival. Over 90 % of crop biomass is derived from photosynthetic products [1]. Photosynthesis efficiency of crop plants is a key factor for crop yield. Photosynthesis encompasses light reactions and dark reactions which also are called carbon fixation reactions. In the five carbon fixation pathways of autotrophs, Calvin cycle is the only biosynthetic process used in plants [2]. Photosynthetic carbon assimilation is inefficient in Calvin cycle of C3 plants, which is a limiting factor for crop yields [3, 4].
Calvin cycle is the first pathway in photosynthesis and assimilates atmospheric carbon dioxide into skeletons of organic compounds which are the precursors of organic macromolecules and the basics for plant growth and development [5, 6]. It occurs in the chloroplast stroma and comprises 13 enzymatic steps catalyzed by 11 enzymes proceeding in three distinct phases: carboxylation of ribulose 1,5-bisphosphate (RuBP), reduction of 3-phosphoglycerate and regeneration of RuBP [7, 8]. The first enzymatic reaction in Calvin cycle is carboxylation of RuBP. It converts CO2 and RuBP into two 3-phosphoglycerate and is catalyzed by ribulose bisphosphate carboxylase/oxygenase (Rubisco). Competitive inhibition of oxygen to Rubisco leads to low turnover rate of RuBP, so Rubisco is a key rate-limiting enzyme in photosynthesis [9,10,11]. Reduction of 3-phosphoglycerate into glyceraldehyde 3-phosphate consists of two enzymatic reactions catalyzed by 3-phosphoglycerate kinase (PGKinase) and glyceraldehyde-3-phosphate dehydrogenase (GAPDH). Regeneration of RuBP is a relative complex phase including 10 steps catalyzed by eight enzymes: triose phosphate isomerase (TPI), aldolase, fructose-1,6-bisphosphate aldolase (FBAase), transketolase, sedoheptulose 1,7-bisphosphatase (SBPase), ribulose 5-phosphate epimerase (RPE), ribose 5-phosphate isomerase (RPI), phosphoribulokinase (PRKase) [8]. In this phase, limited electron transport capacity for regenerative reactions is another reason for ineffective carbon assimilation in Calvin cycle [12]. FBAase and SBPase are two key enzymes in regeneration of RuBP. FBAase catalyzes two reactions: one is the conversion of glyceraldehyde 3-phosphate and dihydroxyacetone phosphate (DHAP) to fructose 1,6-bisphosphate, and the other is the conversion of erythrose 4-phosphate and DHAP to sedoheptulose 1,7-bisphosphate. SBPase catalyzes sedoheptulose 1,7-bisphosphate to sedoheptulose 7-phosphate and plays a vital role in assigning the assimilated carbon to the regenerative phase to regenerate RuBP or to starch biosynthesis out of the cycle [13, 14]. This particular role emphasizes the importance of SBPase in carbon fixation of Calvin cycle or photosynthesis [5, 15, 16].
The full-length cDNA or genomic DNA of SBPase gene has been isolated from various photosynthetic organisms. The first study cloning its full-length cDNA sequence was done in wheat (Triticum aestivum) through screening a wheat cDNA library using maize SBPase [17]. Thereafter, the full-length of SBPase gene from several organisms has been identified, such as Arabidopsis thaliana and Chlamydomonas reinhardtii which obtained cDNA or genomic DNA using library screening method [18, 19], and Mulberry (Morus alba var. multicaulis), rice (Oryza sativa) and cucumber (Cucumis sativus) which cloned cDNA sequence by RACE (rapid amplification of cDNA ends) [20,21,22]. In addition, Arabidopsis SBPase gene has been studied by T-DNA insertion mutant [7]. However, no study including rice and other monocotyledons has been reported to clone SBPase gene using mutant or/and map-based cloning approach.
In our study, a low-tillering mutant, c6635, was identified in rice. The mutant showed severely retarded growth and development and sharply reduced grain yield. Map-based cloning, high-throughput sequencing, MutMap analysis and complementation experiments indicated a single nucleotide mutation in LOC_Os04g16680 gene encoding SBPase in Calvin cycle was responsible for the mutant phenotype. OsSBPase was mainly expressed in leaf and its encoded protein was located in chloroplast. In addition, expression levels of six key genes for Calvin cycle in c6635 mutant were detected by qRT-PCR at seedling stage.
Results
The mutant shows sharply reduced grain yield due to severely retarded growth and development
The leaves of c6635 mutant displayed light green at early growth stage, and turned normal green as wild type at grain-filling stage (Fig. 1a, c). Moreover, its individual plant showed a much smaller size, and most individuals produced only two tillers (Fig. 1b, c). In addition, heading stage of the mutant was delayed by 15.6 days compared with wild type (Fig. 2a). As a result, most agronomic traits at mature stage were greatly affected in c6635 mutant. For example, plant height, number of productive panicles per plant, grain number of main stem and seed setting rate significantly declined by 27.4, 67.5, 41.8 and 35.7%, respectively (Fig. 2b, c, e, f). Eventually, the grain yield of c6635 was sharply reduced by 87.5% (Figs. 1d, 2h). The results suggested that the mutation in c6635 severely affected plant growth and grain yield.

Phenotypic comparison between wild type and c6635 mutant. The phenotype at seedling stage (a), tillering stage (b) and grain-filling stage (c). d The grain yield of each single plant

Comparison of major agronomic traits between wild type and c6635 mutant. Error bars indicate SD and * P < 0.05
To quantify the leaf colors of c6635, pigment contents of the mutant and wild type at seedling stage, booting stage and grain-filling stage were measured, respectively. Compared with wild type, the pigment contents including Chl a, Chl b and total Chl in the mutant were significantly decreased by 35.5, 43.2 and 36.5%, respectively, at seedling stage (Fig. 3). However, the pigment contents of the mutant at booting stage and grain-filling stage were still slightly reduced with no significant difference compared with wild type (Fig. 3). In fact, at grain-filling stage, the leaf color of c6635 had turned normal green, and its pigment contents also had restored to the normal level of wild type. The results indicated that the light green leaf phenotype of c6635 at seedling stage was due to the reduced pigment contents.

Comparison of pigment contents between wild type and c6635 mutant at seedling, booting and grain-filling stages. Error bars indicate SD and * P < 0.05
In order to detect the development of chloroplasts in c6635 mutant, its chloroplast ultrastructure at seedling stage were observed using transmission electron microscopy. The thylakoids of wild type were well stacked into grana (Fig. 4a), while the thylakoids of c6635 were stacked with slight distortion (Fig. 4b). The results suggested that the development of chloroplast was somewhat suppressed in c6635 mutant.
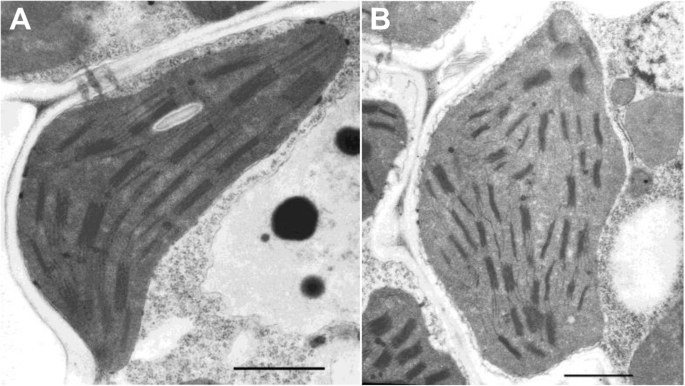
Chloroplast ultrastructure of wild type (a) and c6635 mutant (b) at seedling stage. Scale bars equal l μm
Photosynthetic capability and starch contents of the mutant leaves intensely declined at early growth stage
In order to survey whether photosynthesis was affected in c6635 mutant, net photosynthetic rate at various stages were measured with a portable photosynthetic apparatus. Net photosynthetic rates of c6635 mutant at tillering, booting and grain-filling stages were significantly decreased by 77.1, 46.0 and 15.9%, respectively, compared with those of wild type (Fig. 5). The data of photosynthetic parameter indicated that the photosynthetic capability of c6635 mutant was obviously deficient at early growth stage but gradually recovered at grain-filling stage.

Net photosynthetic rate of wild type and c6635 mutant at tillering, booting and grain-filling stages. The humidity in the chamber was about 30% at tillering stage, and about 50% at booting stage and grain-filling stage. Error bars indicate SD and * P < 0.05
To investigate whether starch accumulation was influenced in c6635 mutant, we detected the starch contents in the leaves by starch iodine test. As shown in Fig. 6, dark brown or black were observed in the leaves of wild type at seedling and booting stages, whereas light brown or light yellow were observed in the leaves of c6635 mutant at the same stages (Fig. 6a, b). At grain-filling stage, the leaves of both wild type and c6635 mutant were stained into brown, although the leaves of wild type were still slightly deeper than that of c6635 (Fig. 6c). The results indicated that only a little starch was accumulated in the leaves of c6635 mutant at seedling and booting stages, but the starch accumulated in c6635 leaves was almost recovered to the normal level of wild type at grain-filling stage, which was consistent with change of leaf color and net photosynthetic rate of the mutant.

Potassium iodide-starch staining of leaves from wild type and c6635 mutant at seeding stage (a), booting stage (b) and grain-filling stage (c)
The c6635 locus was mapped to a putative gene encoding SBPase involved in Calvin cycle
For genetic analysis of the mutant, c6635 was crossed with its wild-type parent Zhonghua11 (japonica cultivar, hereinafter ZH11) to construct F1 and F2 populations. All plants of the F1 population showed normal leaf color and tiller number as wild type. Both normal and mutant phenotypes were observed in the F2 population and showed a good fit to the segregation ratio of 3:1 (χ2 < χ20.05 = 3.84, P > 0.05). The results indicated that mutant phenotype of c6635 was controlled by a single recessive gene.
Mapping population was derived from the cross between c6635 and indica cultivar Gang46B (G46B). More than 300 SSR markers evenly distributing on the 12 chromosomes of rice were employed to carry out the preliminary mapping. Preliminary results showed that the mutant gene was located on chromosome 4 and was linked with RM335. Then SSR markers RM8213 and RM5414 and two newly designed InDel markers H1 and H2 (Table 1) were used for mapping, and c6635 locus was located in a region between RM8213 and H1 on the short arm near the centromere of chromosome 4 (Fig. 7a). Subsequently, eight more InDel markers (Table 1) were used for further mapping. Finally, the c6635 locus was limited into a region between H4 and H5 with a physical distance of 5200 kb (Fig. 7b).
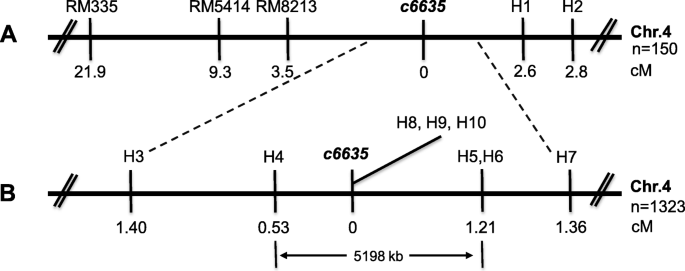
Preliminary mapping of the c6635 locus. ac6635 was limited in a region between InDel marker H1 and SSR marker RM8213 on the short arm of chromosome 4. bc6635 was limited in a 5198-kb interval between InDel markers H4 and H5
Due to the large physical distance between H4 and H5, high-throughput sequencing and MutMap method were used to identify the candidate gene in the region. High-throughput sequencing results of 25 mutant plants with light green leaf and fewer tillers from the (c6635/ZH11) F2 population showed that 14 SNPs between ZH11 and c6635 genomes located within the 5200 kb-region (Additional file 1: Table S1). Among these SNPs, only two caused missense mutations: one was located in a gene (LOC_Os04g18760) encoding retrotransposon protein Ty3-gypsy subclass and the other was located in a gene (LOC_Os04g16680) encoding fructose-1,6-bisphosphatase, according to Rice Genome Annotation Project. The result from amino acid sequence alignment using BLASTP in NCBI showed that LOC_Os04g16680 was highly homologous to SBPase of Arabidopsis thaliana. Then, we amplified and sequenced the LOC_Os04g16680 gene of the wild type and c6635 mutant, and the result uncovered that a single nucleotide G substituted with A at position 2143 in genomic sequence leaded to an amino acid change from Gly-364 to Asp at C-terminal of the encoded protein. Therefore, we identified the LOC_Os04g16680 gene as the candidate gene that was responsible for the mutant phenotype of c6635, and tentatively designated as OsSBPase.
Sequence analysis revealed that OsSBPase gene contained eight exons and seven introns with 2750-bp genomic DNA and 1179-bp cDNA, and encoded a protein of 392 amino acids with a molecular mass of approximately 42.2 kD. A chloroplast transit peptide of 21 amino acid residues at N-terminus of OsSBPase protein was predicted by ChloroP and TargetP (Fig. 8). Multiple sequence alignment revealed that homologs of OsSBPase widely existed in monocotyledonous, dicotyledonous, moss and alga. Furthermore, OsSBPase had a high similarity to its homologs of monocotyledonous plants Brachypodium distachyon, Triticum aestivum and Zea mays, and dicotyledonous plants Cucumis sativus, Nicotiana tabacum and Arabidopsis thaliana, and moss Physcomitrella patens and Marchantia polymorpha, and alga Chlamydomonas reinhardtii, Gonium pectorale and Tetrabaena socialis with identity of 94.4, 93.7, 92.9, 83.2, 81.6, 74.4, 77.0, 75.2, 69.9, 69.3 and 65.7% (Fig. 8). Phylogenetic analysis indicated that OsSBPase had the closest relationship to homolog proteins from monocotyledonous plants (Fig. 9).

Homolog sequences of OsSBPase. Black shades indicate the identical residues and gray shades indicate the similar residues (≥75% identical). The blue arrow shows the mutation site of OsSBPase; A red underline shows the putative chloroplast signal peptides. The red triangles indicate the residues of the FBP/SBP domain and the black triangles indicate residues of the AMP domain. GenBank accession numbers for the respective protein sequences are as follows: OsSBPase (Oryza sativa, LOC_Os04g16680), BdSBPase (Brachypodium distachyon, XP_003564625.1), TaSBPase (Triticum aestivum, CBH32512.1), ZmSBPase (Zea mays, ONM36378.1), CsSBPase (Cucumis sativus, ACQ82818.1), NtSBPase (Nicotiana tabacum, AII99841.1), AtSBPase (Arabidopsis thaliana, AAB33001.1), PpSBPase (Physcomitrella patens, XP_024376141.1), MpSBPase (Marchantia polymorpha, ABF68592.1), CrSBPase (Chlamydomonas reinhardtii, XP_001691997.1), GpSBPase (Gonium pectoral, KXZ56517.1), TsSBPase (Tetrabaena socialis, PNH12434.1)
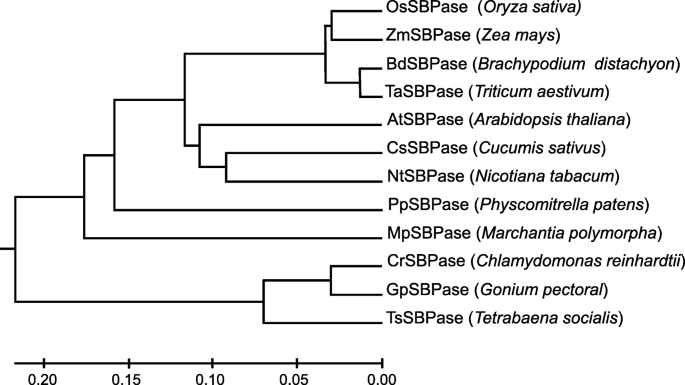
Phylogenetic analysis of OsSBPase and its homologs. GenBank accession numbers for the respective protein sequences are as Fig. 8
Mutant phenotype of c6635 was rescued by transformation with the wild-type OsSBPase gene
In order to confirm our choice on candidate gene responsible for the mutant phenotype of c6635, genetic complementation experiments were carried out by transforming wild-type full-length cDNA of OsSBPase gene with actin 1 promoter into c6635 mutant. Finally, we got 19 independent transgenic lines, and PCR tests showed 17 lines were positive transgenic lines. As expected, normal leaf color and tiller number were observed in all the 17 positive transgenic lines (Fig. 10a, b, d). Moreover, pigment contents in transgenic lines showed no difference to wild type at seedling stage (Fig. 10c). The complementation results verified that the single nucleotide substitution in OsSBPase gene was responsible for the phenotype of c6635.

Complementation of c6635 mutant with OsSBPase gene from its wild type. a Phenotypes of wild type (WT), c6635 mutant, and PCR-positive transgenic plants (TP) at seedling stage. b Phenotypes of WT, c6635 mutant, and TP plant at grain-filling stage. c Pigment contents of WT, c6635 mutant and TP plants at seedling stage. Error bars indicate SD. d PCR test of PCR-positive transgenic lines (cropped from Additional file 2: Figure S1). M: DL-2000 marker; 1: PCR-positive control (pC2300-Actin-OsSBPase plasmid); 2: PCR-negative control (c6635 mutant); 3–6: PCR-positive transgenic lines
OsSBPase protein was localized in the chloroplasts
It was predicted that the OsSBPase protein contains a chloroplast transit peptide with 21 amino acid residues at its N-terminus using ChloroP and TargetP [23, 24]. To identify the actual subcellular localization of OsSBPase, the fusion protein OsSBPase-eGFP and green fluorescent protein (eGFP) were transformed and transiently expressed in rice protoplasts. The green fluorescence from OsSBPase-eGFP fusion protein exhibited the same pattern to red fluorescence from chlorophyll (Fig. 11a). However, green fluorescence from eGFP was observed throughout the protoplasts transformed with empty vector (Fig. 11b). The results confirmed that OsSBPase was located in chloroplast, being consistent with the place where it functions as a key enzyme for Calvin cycle. It should be noted that the mutation site in c6635 mutant was out of the coding region of the chloroplast transit peptide and should not affect the localization of the mutated OsSBPase, although it affected the morphology of thylakoids, pigment contents, photosynthetic capability, biomass and grain yield.

Subcellular localization of OsSBPase protein. a The OsSBPase-eGFP fusion protein. b The empty eGFP vector. Green fluorescence displays the exciting lights of GFP, red fluorescence displays the autofluorescence from chlorophylls, and yellow fluorescence displays the merged fluorescence from GFP and chlorophylls. Scale bars equal 10 μm
OsSBPase gene was mainly expressed in leaf
To investigate spatiotemporal expression pattern of OsSBPase, total RNA extracted from various tissues or organs of wild type at seedling and booting stages were used to conduct semiquantitative and quantitative RT-PCR analysis. Both tests showed the same spatiotemporal expression pattern that it had extremely high expressions in leaf blade at seedling and booting stages, high expressions in leaf sheath and slight expression in stem and young panicle at booting stage, but no detectable expression in root at both stages (Fig. 12). The results suggested that OsSBPase was mainly expressed in leaf and scarcely expressed in root.

Expression pattern of the OsSBPase gene by semiquantitative analysis (a) (cropped from Additional file 3: Figure S2) and real-time quantitative analysis (b). R: Root, S: Stem, L: Leaf blade, LS: leaf sheath, P: young panicle. Actin 1 was examined as the internal control. Error bars indicate SD
Expression levels of some key genes for Calvin cycle were affected in the mutant
To investigate the impact of OsSBPase mutation to the transcription of genes involved in Calvin cycle, we detected the expression levels of six key genes for Calvin cycle (rbcL, rbcS, FBAase, FBPase, OsSBPase and PRKase) by real-time quantitative PCR at seedling stage. rbcL and rbcS encode the large and small subunits of Rubisco which is a rate-limiting enzyme catalyzing the first reaction in Calvin cycle. FBAase catalyzes two reactions and determines the fate of dihydroxyacetone phosphate (DHAP) in Calvin cycle. FBPase catalyzes the conversion of fructose 1,6-bisphosphate to fructose 1,6-bisphosphate. PRKase catalyzes the conversion of ribulose 5-phosphate to ribulose 1,5-bisphosphate. As shown in Fig. 13, the six key genes showed different responses to the mutation of OsSBPase in c6635 mutant. The expression levels of rbcS, FBAase and PRKase in c6635 were significantly up-regulated compared to those in wild type, while the expression levels of rbcL, FBPase and OsSBPase showed no differentiation between c6635 and wild type. Interestingly, rbcS showed the greatest expression difference with about fourfold between c6635 and wild type. The results indicated that OsSBPase mutation had a significant effect on the expression of some key genes involved in Calvin cycle.

Expression analysis of six genes for Calvin cycle in wild type and c6635 mutant at seedling stage. The expression level of each gene in the wild type was set to 1.0, and those in c6635 mutant were calculated accordingly. Error bars indicate SD and * P < 0.05
Discussion
Up to now, SBPase genes of many species have been cloned using various methods and technologies [7, 18,19,20,21,22]. However, no SBPase genes of monocotyledonous plants have been cloned using mutants and/or map-based cloning methods. In the present study, we characterized a low-tillering mutant c6635. By map-based cloning and MutMap analysis, we found that C6635 locus encoded sedoheptulose 1,7-bisphosphatase (OsSBPase) in rice. Further complementation analysis showed that the low-tillering phenotype of c6635 mutant was rescued after introducing full-length genomic sequence of wild-type OsSBPase gene. Therefore, we have successfully identified a SBPase gene in monocotyledonous plants through mutant and map-based cloning approach.
Calvin cycle is the fundamental biological process which provides precursors of organic macromolecules and is the basics for plant growth and development [5, 6]. Consequently, reduced expression levels or mutations in Calvin cycle genes could cause retarded growth and development of plants [7, 25,26,27,28,29,30,31]. For example, antisense transgenic tobacco with 20% decrease in SBPase activity displayed reduced growth rates and chlorosis [27]. T-DNA insertion in chloroplastic FBPase gene caused fewer leaves, smaller size, lower growth rates, and decreased fresh weight in Arabidopsis [30]. Arabidopsis sbp mutant, which is deficient in SBPase, showed pale-green and more compact rosette leaves, and also much smaller plant [7]. In our study, OsSBPase mutant c6635 showed light green leaves and intensely declined pigment contents and photosynthetic capacity at early growth stage. Moreover, its individual plant showed a much smaller size, and most individuals produced only two tillers. At mature stage, its productive panicles, grain number and seed setting rate were significantly decreased, which lead to a sharp reduction of the grain yield. Interestingly, c6635 mutant recovered to normal levels in leaf color, pigment content and starch accumulation at grain-filling stage (Figs. 1c, 3, 6c), which was a differentiation between c6635 and the two Arabidopsis T-DNA insertion mutants. The reason for the differentiation could be that SBPase and FBPase genes in Arabidopsis sbp and cfbp1 mutants were nearly null loss-of-function alleles due to T-DNA insertion [7, 30], while a single nucleotide substitution at the 3′-end of SBPase in c6635 mutant did not cause completely loss of function. Another explanation for the leaf-color recovery of c6635 at grain-filling stage could be that FBPase with similar function may partly compensate for the deficiency of SBPase [7, 30].
In cyanobacteria, FBP/SBPase catalyses two separate enzymatic reactions dephosphorylating sedoheptulose 1,7-bisphosphate and fructose 1,6-bisphosphate, which are executed by two separate enzymes, FBPase and SBPase, in higher plants [32]. Based on the evolutionary relationship and high similarity among FBP/SBPase, FBPase and SBPase, the structure, domains and active sites of SBPase could be speculated from FBP/SBPase and FBPase [17]. Functional FBP/SBPase was a tetrameric structure including four monomers (C1, C2, C3 and C4) and two dimer pairs (C1/C4 and C2/C3) [33]. FBP/SBPases from Thermosynechococcus elongatus and Synechocystis sp. PCC 6803 had two regulatory domains: the FBP/SBP domain and the Adenosine monophosphate (AMP) domain, and all key residues of the two domains were identical between the two cyanobacteria [32, 33]. The AMP domain constituted with residues of two adjacent monomers and AMP helped to lock the four monomers into the stable enzyme [32, 34]. FBPase from Porcus kidney had two states: active state without AMP binding and inactive state with AMP binding. The two different active states differed by a rotation between the two adjacent monomers [34, 35]. In our study, an amino acid change from Gly-364 to Asp at the C-terminal of SBPase caused severely retarded growth and development, and sharply reduced grain-yield in the c6635 mutant of rice (Figs. 1, 2, 6), suggesting that the Gly-364 could play an important role in SBPase function. The possible explanation for this speculation is that Gly-364 at the C-terminal of OsSBPase is located around a residue of the AMP domain, which was likely to affect the rotation between the two adjacent monomers and finally to remarkably reduce the activity of SBPase in c6635 mutant.
qRT-PCR analysis showed that the expression levels of rbcS, FBAase and PRKase were remarkably up-regulated while rbcL, FBPase and OsSBPase expression had no obvious differences between wild type and c6635 mutant. Interestingly, rbcL and rbcS were the two subunits of Rubisco. However, they showed different expression patterns in c6635 mutant (Fig. 13). The different expression patterns of rbcL and rbcS may be result from their different functions in Rubisco. rbcL is the large subunit encoded by the chloroplast rbcL gene and rbcS is the small subunit encoded by the nuclear rbcS gene [11]. Catalytic activity of Rubisco is determined by rbcL subunit containing catalytic domain and regulated by rbcS subunit [36], which may result in the different expression patterns of rbcL and rbcS.
Transgenic plants overexpressing heterologous SBPase or FBP/SBPase genes showed increased levels of enzymes, enhanced photosynthesis and biomass yields [37,38,39,40], and few study have reported that transgenic plants overexpressing itself SBPase gene showed increased biomass yields [14]. In rice, overexpression of rice SBPase gene had no effect on biomass and yield, while enhanced the tolerance to high temperature and salt stress [41, 42]. We also overexpressed OsSBPase gene in japonica cultivar Nipponbare, and preliminary observation showed that overexpressing OsSBPase gene in rice did not significantly enhanced biomass and grain yield, so we did not go further to investigate the agronomic traits by measurement and statistics. According to the data reported, overexpression of SBPase might have a different reaction in different plant species, especially overexpressing itself SBPase gene might not provide an advantage to some plants [41, 42].
Conclusions
We successfully identified a SBPase gene in monocotyledonous plants. Meanwhile, we demonstrated that a single nucleotide substitution at the 3′-end of this gene severely affects plant growth and grain yield, implying that the Gly-364 at the C-terminal of SBPase could play an important role in SBPase function in rice.
Methods
Plant materials and growth conditions
The plant materials used in this study were originally from our lab. Rice low-tillering mutant c6635 was derived from a mutant library (japonica cultivar Zhonghua11) mutagenized by ethyl methanesulfonate (EMS) and was genetically stable after several generations. The c6635 mutant was crossed with japonica cultivar ZH11 and indica cultivar Gang46B (G46B) respectively, in order to construct F1 and F2 population for genetic analysis and gene mapping. During the natural rice planting season, all plant materials were grown in the paddy field in Wenjiang, Chengdu, China.
Measurement of pigment contents
Fresh leaves at seedling, booting and grain-filling stages were collected to measure the pigment contents. 0.2 g leaves were cutted into pieces and extracted with 80% acetone for 48 h in the dark. UV-visible spectrophotometer (BioMate 3S, Thermo, USA) was used to measure the pigment contents at 663, 646 and 470 nm following the method from Lichtenthaler and Wellburn [43].
Observation of chloroplast ultrastructure
Chloroplast ultrastructure of wild type and c6635 mutant were observed by transmission electron microscopy (TEM). The fresh leaves at seedling stage from wild type and c6635 mutant were collected in the paddy field and immediately fixed in 3% glutaraldehyde fixation solution. Then the samples were treated according to Li et al. [44] and finally observed and photographed with an H-600IV transmission electron microscopy (Hitachi, Japan).
Measurement of photosynthetic capability
Net photosynthetic rate (Pn) were measured with full-expanded top leaves or flag leaves of wild type and c6635 mutant at tillering stage, booting stage and grain-filling stage with a portable photosynthetic apparatus (Li-6400, Li-COR Inc., USA) [45]. All measurements were conducted early in the morning from 9:00 to 9:30 a.m. in sunny days (when the solar radiation was still low). Each leaf from wild type and c6635 mutant at the same stage was measured right after each other in a short period. All measurements were conducted under the environmental control settings: a photon flux density of 1200 μmol m− 2 s− 1, temperature of 30 °C and CO2 concentration of 400 ppm.
Starch iodine test
Fresh leaves at seedling, tillering and grain-filling stages from wild type and c6635 mutant were harvested, and destained in 95% ethanol for 12 h, then submerged in iodine/potassium iodide (2%/5%) solution overnight under the shading condition [7]. The samples were observed and photographed with camera (EOS 800D, Canon, Japan).
Map-based cloning of the c6635 mutant gene
The c6635 mutant was crossed with ZH11 and G46B, respectively, to construct F2 population for genetic analysis and mapping. One thousand three hundred twenty-three individuals with low-tillering phenotype were selected from the (c6635 × G46B) F2 population for gene mapping. Three hundred fifty-one markers evenly distributing on 12 chromosomes from Gramene (http://www.gramene.org/microsat) were used for preliminary mapping. New insertion/deletions (InDel) primers were designed with Gramene and Primer5.0 based on the difference between ZH11 and G46B for further mapping. Because the region limited by gene mapping was too large to identify the candidate genes, high-throughput sequencing and MutMap method were used to identify the candidate gene. Leaves were collected from 25 low-tillering plants in the (c6635 × ZH11) F2 population, cutted into small pieces and pooled in an equal ratio. Then the mixed samples were sent to Biomarker Company (Beijing, China) for high-throughput sequencing. Single nucleotide polymorphisms (SNPs) between genomes of ZH11 and c6635 mutant were detected based on ZH11 genome as the reference genomic sequence.
Sequence analysis
Candidate genes were identified from Rice Genome Annotation Project (http://rice.plantbiology.msu.edu/). OsSBPase gene was finally selected as the candidate gene based on the annotation of each putative genes and the phenotype of mutant. Homolog sequences of OsSBPase were downloaded from NCBI. DNAMAN version 6.0 was used to analyze the multiple sequence alignment and MEGA5 was used to conduct phylogenetic analysis using the UPGMA method [46].
Complementation of the c6635 mutant
To confirm that the mutation in OsSBPase gene was responsible for the low-tillering phenotype of c6635 mutant, complementation experiments were conducted with OsSBPase gene from wild type transferring into c6635 mutant. The full-length cDNA of OsSBPase from wild type was amplified with specific primers (F1: AGGTCTAGAATGGAGACGGTGGCCGCG, R1: AGCCTGCAGTTAGGCGGCGGCGCCCAC) with an XbaI site at 5′-end and a PstI site at 3′-end. The PCR products were digested with XbaI and PstI and cloned into pC2300 binary vector under actin 1 promoter. The pC2300-OsSBPase was transformed into c6635 mutant by Agrobacterium tumefaciens-mediated transformation. All transformants were identified by amplification with specific primers (F2: TCAGTGTAGCATTCGACC, R2: CAGCAGCAACTTGGTCTC).
Subcellular localization of OsSBPase
The chloroplast transit peptide and subcellular localization and were predicted by TargetP 1.1 server and ChloroP 1.1 server [23, 24]. To determine the actual subcellular localization of OsSBPase, transient expression of OsSBPase gene in rice protoplasts was carried out. The full-length cDNA of OsSBPase was amplified with specific primers (F3: AGGGGTACCATGGAGACGGTGGCCGCG, R3: AGCTCTAGAATAGGCGGCGGCGCCCAC) with a KpnI site at the 5′-end and an XbaI site at the 3′-end. pC2300–35S-OsSBPase-eGFP vector was constructed with PCR product inserted into the pC2300–35S-eGFP vector, then transformed into rice protoplasts following the method of Zhang et al. [47]. Fluorescence signals in rice protoplasts were detected with a laser scanning confocal microscope (Nikon A1, Nikon, Japan).
RT-PCR analysis
Different tissues and organs of wild type and c6635 mutant were collected from 7:00–8:00 a.m. in the paddy field. Total RNA was extracted from tissues and organs with an RNA isolater kit (Vazyme). 2 μg of total RNA was used to obtain first-strand cDNA with HiScript II Q RT SuperMix (R223–01, Vazyme, China) according to its instructions. To detect the expression pattern of OsSBPase gene in different tissues and organs, semiquantitative and quantitative RT-PCR were performed using gene-specific primers with actin 1 gene as the internal control. The expression levels of six key genes involved in Calvin cycle were detected at seedling stage. All qRT-PCR (10 μl) was conducted in the real-time PCR system (qTOWER3 G, analytikjena) with 5 μl ChamQ Universal SYBR Mix (Q711–02, Vazyme), 1 μl primer mix, and 1 μl cDNA. The actin 1 gene was used as the reference gene. The assays were carried out with three technical and biological replicates respectively. All primers used in RT-PCR analysis were listed in Table 2.
Availability of data and materials
The datasets used and/or analysed during the current study are available from the corresponding author on reasonable request.
Abbreviations
- RuBP:
-
Ribulose 1,5-bisphosphate
- Rubisco:
-
Ribulose bisphosphate carboxylase/oxygenase
- rbcL:
-
Large subunit of Rubisco
- rbcS:
-
Small subunit of Rubisco
- FBAase:
-
Fructose-1,6-bisphosphate aldolase
- FBPase:
-
Fructose 1,6-bisphosphatase
- SBPase:
-
Sedoheptulose 1,7-bisphosphatase
- PRKase:
-
Phosphoribulokinase
References
Makino A. Photosynthesis, grain yield, and nitrogen utilization in rice and wheat. Plant Physiol. 2011;155:125–9.
Thauer RK. A fifth pathway of carbon fixation. Science. 2007;318:1732–3.
Long SP, Marshall-Colon A, Zhu X. Meeting the global food demand of the future by engineering crop photosynthesis and yield potential. Cell. 2015;161:56–66.
Janasch M, Asplund-Samuelsson J, Steuer R, Hudson EP. Kinetic modeling of the Calvin cycle identifies flux control and stable metabolomes in Synechocystis carbon fixation. J Exp Bot. 2019;70:973–83.
Geiger DR, Servaites JC. Diurnal regulation of photosynthetic carbon metabolism in C3 plants. Annu Rev Plant Physiol Plant Mol Biol. 1994;45:235–56.
De Porcellinis AJ, Nørgaard H, Brey LMF, Erstad SM, Jones PR, Heazlewood JL, Sakuragi Y. Overexpression of bifunctional fructose-1,6-bisphosphatase/sedoheptulose-1,7-bisphosphatase leads to enhanced photosynthesis and global reprogramming of carbon metabolism in Synechococcus sp. PCC 7002. Metab Eng. 2018;47:170–83.
Liu X, Yu H, Guan Y, Li J, Guo F. Carbonylation and loss-of-function analyses of SBPase reveal its metabolic interface role in oxidative stress, carbon assimilation, and multiple aspects of growth and development in Arabidopsis. Mol Plant. 2012;5:1082–99.
Buchanan BB, Wolosiuk RA. Photosynthesis: the carbon reactions. In: Lincoln T, Eduardo Z, Ian Max M, Angus M, editors. Plant physiology and development. Sunderland: Sinauer Associates; 2015. p. 203–44.
Fukayama H, Mizumoto A, Ueguchi C, Katsunuma J, Morita R, Sasayama D, Hatanaka T, Azuma T. Expression level of Rubisco activase negatively correlates with Rubisco content in transgenic rice. Photosynthesis Res. 2018;137:465–74.
Spreitzer RJ, Salvucci ME. Rubisco: structure, regulatory interactions, and possibilities for a better enzyme. Annu Rev Plant Biol. 2002;53:449–75.
Andersson I. Catalysis and regulation in Rubisco. J Exp Bot. 2008;59:1555–68.
von Caemmerer S, Farquhar GD. Some relationships between the biochemistry of photosynthesis and the gas exchange of leaves. Planta. 1981;153:376–87.
Woodrow IE, Berry JA. Enzymatic regulation of photosynthetic CO2, fixation in C3 plants. Annu Rev Plant Physiol Plant Mol Biol. 1988;39:533–94.
Ding F, Wang M, Zhang S, Ai X. Changes in SBPase activity influence photosynthetic capacity, growth, and tolerance to chilling stress in transgenic tomato plants. Sci Rep. 2016;6:32741–54.
Raines CA, Lloyd JC, Dyer TA. New insights into the structure and function of sedoheptulose-1,7-bisphosphatase; an important but neglected Calvin cycle enzyme. J Exp Bot. 1999;50:1–8.
Raines CA. The Calvin cycle revisited. Photosynthesis Res. 2003;75:1–10.
Raines CA, Lloyd JC, Willingham NM, Potts S, Dyer TA. cDNA and gene sequences of wheat chloroplast sedoheptulose-1,7-bisphosphatase reveal homology with fructose-1,6-bisphosphatases. Eur J Biochem. 1992;205:1053–9.
Willingham NM, Lloyd JC, Raines CA. Molecular cloning of the Arabidopsis thaliana sedoheptulose-1,7-biphosphatase gene and expression studies in wheat and Arabidopsis thaliana. Plant Mol Biol. 1994;26:1191–200.
Hahn D, Kück U. Nucleotide sequence of a cDNA encoding the chloroplast sedoheptulose-1,7-bisphosphatase from Chlamydomonas reinhardtii. Plant Physiol. 1994;104:1101–2.
Ji X, Gai Y, Ma J, Zheng C, Mu Z. Molecular cloning and characterization of a cDNA encoding sedoheptulose-1,7-bisphosphatase from mulberry (Morus alba var. multicaulis). Silvae Genet. 2008;57:152–7.
Wang M, Bi H, Liu P, Ai X. Molecular cloning and expression analysis of the gene encoding sedoheptulose-1,7-bisphosphatase from Cucumis sativus. Sci Hortic. 2011;129:414–20.
Chen X, Xiong J, Yu T, Li X, Li S, Hua Y, Li Y, Zhu Y. Molecular cloning and characterization of rice sedoheptulose-1,7-bisphosphatase gene that is regulated by environmental stresses. J Plant Biochem Biotechnol. 2004;13:93–9.
Emanuelsson O, Nielsen H, von Heijne G. ChloroP, a neural network-based method for predicting chloroplast transit peptides and their cleavage sites. Protein Sci. 1999;8:978–84.
Emanuelsson O, Nielsen H, Brunak S, von Heijne G. Predicting subcellular localization of proteins based on their N-terminal amino acid sequence. J Mol Biol. 2000;300:1005–16.
Rodermel SR, Abbott MS, Bogorad L. Nuclear-organelle interactions: nuclear antisense gene inhibits ribulose bisphosphate carboxylase enzyme levels in transformed tobacco plants. Cell. 1988;55:673–81.
Haake V, Zrenner R, Sonnewald U, Stitt M. A moderate decrease of plastid aldolase activity inhibits photosynthesis, alters the levels of sugars and starch, and inhibits growth of potato plants. Plant J. 1998;14:147–57.
Harrison EP, Willingham NM, Lloyd JC, Raines CA. Reduced sedoheptulose-1,7-bisphosphatase levels in transgenic tobacco lead to decreased photosynthetic capacity and altered carbohydrate accumulation. Planta. 1998;204:27–36.
Henkes S. A small decrease of plastid transketolase activity in antisense tobacco transformants has dramatic effects on photosynthesis and phenylpropanoid metabolism. Plant Cell. 2001;13:535–51.
Kossmann J, Sonnewald U, Willmitzer L. Reduction of the chloroplast fructose-1,6-bisphosphatase in transgenic potato plants impairs photosynthesis and plant growth. Plant J. 2003;6:637–50.
Rojas-González JA, Soto-Súarez M, García-Díaz Á, Romero-Puertas MC, Sandalio LM, Mérida Á, Thormählen I, Geigenberger P, Serrato AJ, Sahrawy M. Disruption of both chloroplastic and cytosolic FBPase genes results in a dwarf phenotype and important starch and metabolite changes in Arabidopsis thaliana. J Exp Bot. 2015;66:2673–89.
Price GD, Evans JR, von Caemmerer S, Yu JW, Badger MR. Specific reduction of chloroplast glyceraldehyde-3-phosphate dehydrogenase activity by antisense RNA reduces CO2 assimilation via a reduction in ribulose bisphosphate regeneration in transgenic tobacco plants. Planta. 1995;195:369–78.
Cotton C, Kabasakal B, Miah N, Murray J. Structure of the dual-function fructose-1,6/sedoheptulose-1,7-bisphosphatase from Thermosynechococcus elongatus bound with sedoheptulose-7-phosphate. Acta Crystallogr. 2015;71:1341–5.
Feng L, Sun Y, Deng H, Ding L, Wan J, Wang X, Wang W, Liao X, Hu X. Structural and biochemical characterization of fructose-1,6/sedoheptulose-1,7-bisphosphatase from the cyanobacterium Synechocystis strain 6803. FEBS J. 2013;281:916–26.
Xue Y, Huang S, Liang JY, Zhang Y, Lipscomb WN. Crystal structure of fructose-1,6-bisphosphatase complexed with fructose 2,6-bisphosphate, AMP, and Zn2+ at 2.0-Å resolution: aspects of synergism between inhibitors. P Natl Acad Sci USA. 1994;91:12482–6.
Villeret V, Huang S, Zhang Y, Xue Y, Lipscomb WN. Crystal structure of spinach chloroplast fructose-1,6-bisphosphatase at 2.8 Å resolution. Biochemistry. 1995;34:4299–306.
Spreitzer RJ. Role of the small subunit in ribulose-1,5-bisphosphate carboxylase/oxygenase. Arch Biochem Biophys. 2003;414:141–9.
Miyagawa Y, Tamoi M, Shigeoka S. Overexpression of a cyanobacterial fructose-1,6−/sedoheptulose-1,7-bisphosphatase in tobacco enhances photosynthesis and growth. Nat Biotechnol. 2001;19:965–9.
Rosenthal D, Locke A, Khozaei M, Raines C, Long S, Ort D. Over-expressing the C3 photosynthesis cycle enzyme Sedoheptulose-1-7 Bisphosphatase improves photosynthetic carbon gain and yield under fully open air CO2 fumigation (FACE). BMC Plant Biol. 2011;11:123–34.
Köhler I, Ruiz-Vera U, VanLoocke A, Thomey M, Clemente T, Long S, Ort D, Bernacchi C. Expression of cyanobacterial FBP/SBPase in soybean prevents yield depression under future climate conditions. J Exp Bot. 2016;68:715–26.
Driever S, Simkin A, Alotaibi S, Fisk S, Madgwick P, Sparks C, Jones H, Lawson T, Parry M, Raines C. Increased SBPase activity improves photosynthesis and grain yield in wheat grown in greenhouse conditions. Phil Trans R Soc B. 2017;372:20160384.
Feng L, Han Y, Liu G, An B, Yang J, Yang G, Li Y, Zhu Y. Overexpression of sedoheptulose-1,7-bisphosphatase enhances photosynthesis and growth under salt stress in transgenic rice plants. Funct Plant Biol. 2007;34:822–34.
Feng L, Wang K, Li Y, Tan Y, Kong J, Li H, Li Y, Zhu Y. Overexpression of SBPase enhances photosynthesis against high temperature stress in transgenic rice plants. Plant Cell Rep. 2007;26:1635–46.
Lichtenthaler HK, Wellburn AR. Determinations of total carotenoids and chlorophylls a and b of leaf extracts in different solvents. Biochem Soc Trans. 1983;603:591–2.
Li C, Ma F, Jiao R, Chen C, Wang Q, Xiao F, Sun C, Deng X, Dong C, Wang P. Mutation in Mg-protoporphyrin IX monomethyl ester cyclase causes yellow and spotted leaf phenotype in rice. Plant Mol Biol Report. 2019;37:253–64.
Sun Y, Ma J, Sun Y, Xu H, Yang Z, Liu S, Jia X, Zheng H. The effects of different water and nitrogen managements on yield and nitrogen use efficiency in hybrid rice of China. Field Crops Res. 2012;127:85–98.
Tamura K, Peterson D, Peterson N, Stecher G, Nei M, Kumar S. MEGA5: molecular evolutionary genetics analysis using maximum likelihood, evolutionary distance, and maximum parsimony methods. Mol Biol Evol. 2011;28:2731–9.
Zhang Y, Su J, Duan S, Ao Y, Dai J, Liu J, Wang P, Li Y, Liu B, Feng D. A highly efficient rice green tissue protoplast system for transient gene expression and studying light/chloroplast-related processes. Plant Methods. 2011;7:30–43.
Su N, Hu M, Wu D, Wu F, Fei G, Lan Y, Chen X, Shu X, Zhang X, Guo X, Cheng Z, Lei C, Qi C, Jiang L, Wang H, Wan J. Disruption of a rice pentatricopeptide repeat protein causes a seedling-specific albino phenotype and its utilization to enhance seed purity in hybrid rice production. Plant Physiol. 2012;159:227–38.
Acknowledgements
We thank Prof. Chengcai Chu from Institute of Genetics and Developmental Biology, Chinese Academy of Sciences, for kindly providing pCAMBIA2300 and pCAMBIA2300-35 s-GFP vectors.
Funding
This study was financially supported by the National Key Research and Development Program of China (2017YFD0100201) and the National Natural Science Foundation of China (91735303 and 31971869). The funding organizations played no role in the design of study and collection, analysis, and interpretation of data and in writing the manuscript.
Author information
Authors and Affiliations
Contributions
CL analyzed the experimental data and wrote the manuscript. NL, RH and CL performed most of the research. PW analyzed the experimental data and carried out subcellular localization assays. CC, JG, XY and XZ conducted some field experiments. CS provided technical assistance. PW and XD designed the experiments, supervised the study and revised the manuscript. All authors read and approved the manuscript.
Corresponding authors
Ethics declarations
Ethics approval and consent to participate
Not applicable.
Consent for publication
Not applicable.
Competing interests
The authors declare that they have no competing interests.
Additional information
Publisher’s Note
Springer Nature remains neutral with regard to jurisdictional claims in published maps and institutional affiliations.
Supplementary information
Additional file 1: Table S1.
The information of fourteen single nucleotide polymorphisms (SNPs) identified by MutMap in the target region.
Additional file 2: Figure S1.
PCR test of PCR-positive transgenic lines. M: DL-2000 marker; 1 and 18: PCR-positive control (pC2300-Actin-OsSBPase plasmid); 2: PCR-negative control (c6635 mutant); 3–6, 8–17, 19, 21, 22: PCR-positive transgenic lines; 7 and 20: PCR-negative transgenic lines.
Additional file 3: Figure S2.
Expression pattern of the OsSBPase gene by semiquantitative analysis (two replications in a gel). R: Root, S: Stem, L: Leaf blade, LS: leaf sheath, P: young panicle.
Rights and permissions
Open Access This article is licensed under a Creative Commons Attribution 4.0 International License, which permits use, sharing, adaptation, distribution and reproduction in any medium or format, as long as you give appropriate credit to the original author(s) and the source, provide a link to the Creative Commons licence, and indicate if changes were made. The images or other third party material in this article are included in the article's Creative Commons licence, unless indicated otherwise in a credit line to the material. If material is not included in the article's Creative Commons licence and your intended use is not permitted by statutory regulation or exceeds the permitted use, you will need to obtain permission directly from the copyright holder. To view a copy of this licence, visit http://creativecommons.org/licenses/by/4.0/. The Creative Commons Public Domain Dedication waiver (http://creativecommons.org/publicdomain/zero/1.0/) applies to the data made available in this article, unless otherwise stated in a credit line to the data.
About this article

Cite this article
Li, C., Li, N., Huang, R. et al. A single nucleotide substitution at the 3′-end of SBPase gene involved in Calvin cycle severely affects plant growth and grain yield in rice. BMC Plant Biol 20, 345 (2020). https://doi.org/10.1186/s12870-020-02541-x
Received:
Accepted:
Published:
DOI: https://doi.org/10.1186/s12870-020-02541-x