
Abstract
Background
Accumulating evidences show that SPLs are crucial regulators of plant abiotic stress tolerance and the highly conserved module miR156/SPL appears to balance plant growth and stress responses. The halophyte Tamarix chinensis is highly resistant to salt tress. SPLs of T. chinensis (TcSPLs) and theirs roles in salt stress responses remain elusive.
Results
In this study, we conducted a systematic analysis of the TcSPLs gene family including 12 members belonging to 7 groups. The physicochemical properties and conserved motifs showed divergence among groups and similarity in each group. The microRNA response elements (MREs) are conserved in location and sequence, with the exception of first MRE within TcSPL5. The miR156-targeted SPLs are identified by dual-luciferase reporter assay of MRE-miR156 interaction. The digital expression gene profiles cluster suggested potential different functions of miR156-targeted SPLs vs non-targeted SPLs in response to salt stress. The expression patterns analysis of miR156-targeted SPLs with a reverse expression trend to TcmiR156 suggested 1 h (salt stress time) could be a critical time point of post-transcription regulation in salt stress responses.
Conclusions
Our work demonstrated the post-transcription regulation of miR156-targeted TcSPLs and transcription regulation of non-targeted TcSPLs in salt stress responses, and would be helpful to expound the miR156/SPL-mediated molecular mechanisms underlying T. chinensis salt stress tolerance.
Background
Transcription factors (TFs) are proteins binding to cis-acting elements of target genes to activate or inhibit their transcription [1]. Dozens of plant TF gene families precisely coordinate the spatial and temporal expression of downstream genes associated with abiotic stress, such as AP2 (APETALA2), NAC (NAM, ATAF1/2, and CUC2), auxin response factors (ARFs), and SQUAMOSA promoter-binding (SBP) protein-like proteins (SPLs) [2,3,4,5]. SPLs are plant-specific TFs that contain a highly conserved DNA binding domain SBP-box consisting of two zinc finger structures [6]. The essential roles of SPLs in plant development, including shoot and leaf morphogenesis, floral organ development, flowering and fruit ripening, have been thoroughly established [7, 8].
Recent studies indicate that SPL genes are crucial regulators of abiotic stress tolerance in many plants [9,10,11]. Genome-wide profile studies of the SPL family in plant species have found many SPL responses to salt, drought, cold and heat stress [12,13,14]. Some of these SPLs participate in salt/drought stress responses by regulating the abundance of genes involved in signal transduction, reactive oxygen species (ROS) scavenging, accumulation of POD/SOD, proline synthesis and anthocyanin metabolism. For instance, VpSBP16 of Vitis pseudoreticulata enhances the salt and drought stress tolerance of overexpressed Arabidopsis by regulating the salt overly sensitive (SOS) and ROS signalling [10]. BpSPL9 confers tolerance to salt and drought stress upon Betula platyphylla by improving scavenging of ROS [15].
Furthermore, a subset of SPLs with miRNA response element (MRE) complementary to miR156 are regulated by miR156 mediated mRNA cleavage and/or translational repression at the post-transcriptional level [16, 17]. For example, SPL13 silencing caused by miRNA156 improves the drought stress tolerance of alfalfa [18]. The miR156/SPL studies increasingly illuminate that the miR156/SPL module emerges as a key bridge to the balance of plant abiotic stress responses and development [9, 11]. In Arabidopsis and rice, miR156 overexpression increased salt stress tolerance and delayed flowering. The miR156 knock-down lines and SPL9 overexpression lines showed the opposite phenotype (sensitivity to salt stress and early flowering) by anthocyanin metabolism regulation. Similar results were identified in the miR156/SPL3 study on flowering timing and hot stress memory in Arabidopsis. Accumulating evidence shows that the miR156/SPL module is highly conserved in land plants and appears to be useful molecular tools in plant growth (biomass/yield/flowing time) and stress resistance improvement [19, 20]. As a typical case, OsSPL14 and OsSPL16 in rice improve grain quality and yield as well as SPL homologues in maize do [21, 22]. Moreover, downregulation of SPL8 improved both the biomass yield and the salt/drought tolerance of transgenic alfalfa, indicating that miR156-targeted SPL8 has considerable potential in legume breeding [23].
Tamarix chinensis (T. chinensis), as a halophyte that is highly resistant to salinity, is a suitable material for investigating plant salt stress tolerance [24, 25]. Although many TF genes that are associated with salt or drought stress have been identified in Tamarix spp. [26,27,28,29,30,31], the SPLs of T. chinensis (TcSPLs) and their roles in salt stress responses remain to be elucidated. In this study, systematic identification of the TcSPL family with classification, structure analysis and expression profile analysis provided sequence characterization of TcSPLs and expression patterns under salt stress. Furthermore, we conducted a preliminary investigation of the expression patterns of miR156-targeted SPLs to determine their roles in salt stress responses by experimental verification.
Results
Identification of TcSPL genes and miR156 targets
To further explore the important role of the SPL genes in T. chinensis (TcSPLs) under salt stress, the cDNA sequences of the TcSPL family were predicted from the RNA-seq data [32]. All 14 TcSPLs, except TcSPL13 and TcSPL14, contained conserved SBP-boxes (Table 1). Six members of the TcSPL family containing miRNA response elements (MRE) are potential targets of TcmiR156 (Table 2). It is notable that two MREs are predicted in TcSPL5, including a mRNA cleavage site and a translation inhibition site.
The deduced protein length, isoelectric point (pI) and molecular weight of TcSPL protein are within a large variation range (Table 2). TcSPL proteins ranging from 191 (TcSPL4) to 1098 (TcSPL9) amino acids had a predicted molecular mass of 21.7 (TcSPL4) to 120.7 (TcSPL9) kDa, and the pI values ranged from 6.28 (TcSPL5) to 9.84 (TcSPL2). These results indicated the diversity of the SPL protein family in T. chinensis.
Phylogenetic analysis of SPL genes
The SPL gene function has been fully clarified in Arabidopsis and Populous due to its importance in plant development regulation. To further study the SPL evolutionary relationship among T. chinensis, Arabidopsis (http://planttfdb.cbi.pku.edu.cn/family.php?sp=Ath&fam=SBP), and Populous trichocarpa (http://planttfdb.cbi.pku.edu.cn/family.php?sp=Ptr&fam=SBP), the SBP-box sequences of 12 TcSPLs, 17 AtSPLs from Arabidopsis and 30 PtSPLs from P. trichocarpa were used to construct a maximum likelihood method (ML) tree (Fig. 1 and Table 2). All 59 SPL genes were divided into 7 groups containing at least one SPL from each species (Fig. 1). The topological structure of ML-tree and corresponding SPL members are consistent with multiple SPL studies, and the groups were named Group I and IIa-f according to the representative phylogenetic tree of study.

Phylogenetic tree of 59 SPLs in Tamarix chinensis (TcSPLs), Arabidopsis thaliana (AtSPLs), and Populus trichocarpa (PtSPLs). The phylogenetic tree was constructed based on the SBP-box. The numbers on the branches indicate the bootstrap value. The branches and groups are distinguished with different colours. TcSPLs are emphasized by white background
IId includes the smallest SPL gene, encoding fewer than 210 amino acids, while members in IIa encode the largest SPL proteins with approximately 1000 amino acids. The similar protein feature of SPLs in each group indicated that the SBP-box is a relatively conserved domain among all SPL genes in different species, and its degree of conservation corresponds to that of SPL proteins. In addition, the conserved MRE are identified in all members of IIc-f, except TcSPL11 and PtSPL11.
Identification of conserved motifs in TcSPLs
The SBP-boxes shared by all TcSPLs were predicted by NCBI CD-Search (Conserved Domain Search Service). The sequence alignment (Fig. 2a) showed that the SBP-boxes of TcSPLs are conserved structures that contain two zinc finger motifs (Zn-1/2) and a nuclear localization signal (NLS). The Zn-1 motif is a CCCH (C3H)-type zinc finger structure in all TcSPLs, except the first Cys residue in TcSPL8 substituted with a Val residue, and the CCCC (C4) type in TcSPL7. The Zn-2 motif (i.e., C2HC type zinc finger structure) is highly conserved in all TcSPLs, which overlap with NLSs with four residues.

Conserved motif analysis of the SPLs of Tamarix chinensis (TcSPLs). a Sequence logo of the SBP-box of TcSPLs. The overall height of each stack represents the conservation level of corresponding residue site. The height of the letters within each stack indicates the relative frequency. b Distribution of conserved motifs between TcSPLs and AtSPLs (SPLs of Arabidopsis). The conserved motifs identified by MEME are represented with boxes of different colours. The numbers 1–10 and corresponding sequence logos represent motifs 1–10, respectively. The sequence logos are based on all TcSPLs and AtSPLs
The top-8 most conserved motifs and 2 relative conserved motifs predicted in MEME are designated motifs 1 to motif 10 (Fig. 2b). Most of the domains were relatively conserved between T. chinenses and Arabidopsis [12]. Members of the same group had similar motif compositions. Motifs 3, 1 and 4 represent Zn-1/2 and NLS of SBP-boxes identified in all TcSPLs. TcSPLs of IIb and IId only contained motifs of the SBP-box. Some motifs were specifically present in one or two groups. Motif 5 was unique to IIa, and Motifs 2, 6, 7 and 8 were unique to I and IIa (Fig. 2b). For the 2 relative motifs, motif 9, including an ankyrin-repeat-containing domain, was found in four TcSPLs (TcSPL6, − 7, − 9, − 10), indicating that the biological function of these TcSPLs may be associated with protein–protein interactions. Furthermore, motif 10 consists of a conserved motif coded by MRE of miR156.
Digital gene expression profiles of the TcSPLs under salt stress
The phylogenetic and protein motif analyses showed the conservation and diversity of TcSPLs. Digital gene expression profiles (DGE) of TcSPLs in T. chinensis roots were constructed to explore their potential roles in salt stress. Based on clustering of time series consisting of 0, 0.5 h and 2.5 h NaCl treatment, 12 TcSPLs were classified into two clusters, i.e., one cluster of downregulated expression pattern and the other cluster of upregulated expression pattern (Fig. 3). All TcSPLs with MREs are clustered into the downregulated cluster with the opposite expression pattern of other TcSPLs (except TcSPL7), implying that TcmiR156-targeted TcSPLs may play different roles in T. chinensis salt stress responses compared with non-targeted TcSPLs. TcSPL3 and TcSPL5 of the downregulated cluster showed a significant upregulation in 0.5 h, indicating that the expression patterns of the two TcSPLs are complicated. Five TcSPLs showed relatively high abundance (FPKM > 20), and three of them (TcSPL6, − 9, − 10) belonged to the same group (IIa).

Digital gene expression profiles of the SPL genes in Tamarix chinensis roots. The heat map was generated based on the normalized Log2 (FPKM) represented by the red-blue gradation. The columns of ck, 0.5 h and 2.5 h represent the 0 h, 0.5 h and 2.5 h NaCl treatments, respectively. The rows represent SPL genes. The numbers in the heat map were FPKM from RNA-seq data. The branches represent clusters by complete linkage clustering of Euclidean distance
Validation of TcmiR156-targeted TcSPLs
Six TcSPLs targeted by TcmiR156 contain 7 MREs of the SPL mRNAs: 6 mRNA cleavage MREs (SPL-MREs) and one translation inhibition MRE (TcSPL5i-MRE). All SPL-MREs lie downstream of the conserved SBP-box and are part of the coding sequence (CDS) of the last exon (Additional file 3: Figure S1) with the exception of TcSPL2-MRE and TcSPL4-MRE located in the 3′ untranslated region (UTR). Unlike SPLc-MREs, TcSPL5i-MRE is located in the first exon and overlaps with 4 upstream nucleotides of the SBP-box (Fig. 4a). The alignments of the TcmiR156 reverse complement with SPL-MREs (Fig. 4b) show the perfect complementarity of TcSPL-MREs to 5′ of TcmiR156 and two mismatches to 3′ of TcmiR156 (the 14th and last nucleotides). In addition to the 14th and last nucleotides, four mismatches (the 9th, 10th, 15th and 16th nucleotides) with TcmiR156 indicated that TcSPL5 could be translationally inhibited by miR156 in TcSPL5i-MRE. The miR156-related MREs except TcSPL5i-MRE are conserved with alignment of presumed SPL orthologues of Arabidopsis and Populous [12, 33]. TcSPL1/3/8-MRE are fully conserved with MREs in the last exon of SPLs (AtSPLs and PtSPLs), and TcSPL2/4-MRE are highly conserved in the 3′ UTR of SPLs (Fig. 4c). TcSPL1/3/8-MRE and TcSPL5-MRE are in the same reading frame that participate in coding the conserved motif ALSLLS embedded in a non-conserved protein region (Fig. 4c). In particular, the TcSPL5i-MRE is poorly conserved in the 5′ half and encodes the non-conserved motif LQAPFC with different frames.

Identification and validation of miR156-targeted SPLs of Tamarix chinensis (TcSPLs). a Graphic representation of the cDNAs of all TcSPLs carrying the predicted MRE (red and blue boxes). Coding sequences are shaded grey, and the conserved SBP-box is shaded with diagonal. b Alignment of the predicted MRE sequences compared with the miR156 reverse complementary sequence (TcmiR156). Nucleotide divergences compared with TcmiR156 are highlighted by colours. Reading frames are indicated by triplet codons, and the target motif is represented by amino acid residues. c Sequence logos of MRE within TcSPLs and putative SPL orthologues of Arabidopsis thaliana and Populus trichocarpa (AtSPLs and PtSPLs). TcSPL1/3/8-MRE was aligned with, TcSPL2/4-MRE was aligned with, TcSPL1/3/8-MRE was aligned with, and the TcSPL5i-MRE targeted motif was aligned with. d Schematic representation of the dual-luciferase reporter (DLR) assay. The reporter and effector were transferred into Populus protoplasts after overnight transformation. The ratio of firefly luciferase to Renilla luciferase of four MREs represents the activity of the miR156-TcSPL interaction. mMRE are MRE mutated in 10-11th nucleotides of TcmiR156. Data are represented by percentage with SEs (n = 4). Significant differences were determined by Student’s t-test (**P < 0.01, *** P < 0.001)
The four types of miR156-related MREs, specifically TcSPL1/3/8-MRE, TcSPL2/4-MRE, TcSPL5-MRE and TcSPL5i-MRE, were validated as target sites of TcmiR156 by dual-luciferase reporter (DLR) assay (Fig. 4d). The fluorescence intensity of the control group (i.e., the DLR vector and miRNA vector co-transformation) was set as 100%. Compared with the control group, fluorescence decreased in four MRE groups (i.e., MRE vectors and miRNA vector co-transformation) and recovered in four mutated MRE (mMRE) groups mismatched to 10th and 11th nucleotides of TcmiR156 (i.e., mMRE vectors and miRNA vector co-transformation) to different intensities. The results demonstrated that TcSPL1/3/8-MRE and TcSPL5-MRE were significantly depressed (< 2% fluorescence) by TcmiR156, and TcSPL2/4-MRE and TcSPL5i-MRE were depressed to a certain degree (< 40% fluorescence) by TcmiR156. The high fluorescence (> 50%) in the mMRE groups except TcSPL5-mMRE and the significant recovery (P < 0.01) in all mMRE vs MRE comparisons indicated that the 10th and 11th nucleotides are key sites for miR156-TcSPL interaction. The DLR assay suggests that TcSPL1/2/3/4/5/8 were targeted by TcmiR156 in the manner of MRE interaction.
Salt stress responses of miR156-targeted TcSPLs
To explore the salt stress response patterns, expression levels of six miR156 target genes were examined in roots, stems and leaves during 2% NaCl treatment (Fig. 5a). All TcSPLs that were expressed in three tissues showed no tissue-specific expression pattern. The average expression level indicated that descending mRNA abundance of three tissues is as follows: stems, leaves and roots. In particular, the abundance of SPLs in stems is 2–14 times greater than that in roots under no salt stress, and SPL2 abundance differs significantly between roots and stems.
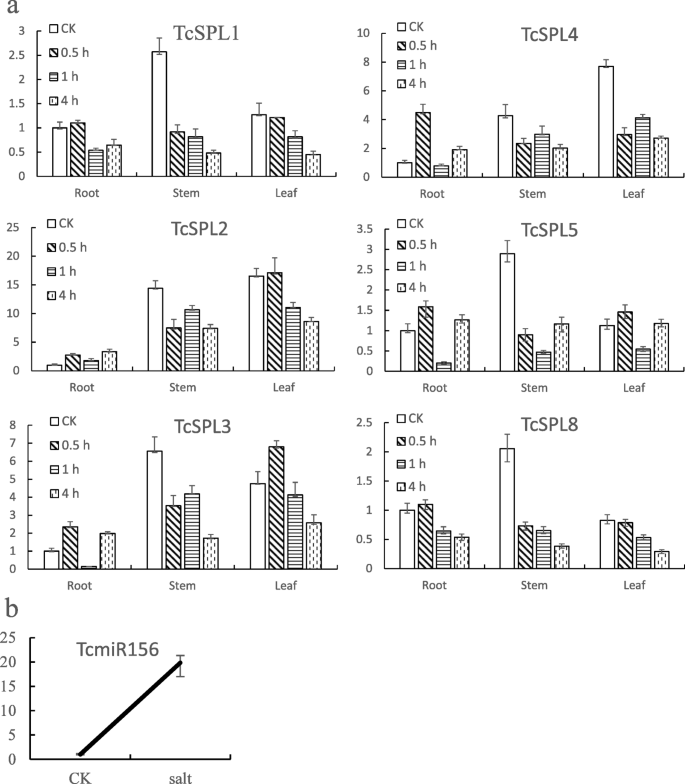
Expression profiles of the SPL genes of Tamarix chinensis (TcSPLs) targeted by miR156. a Relative expression levels of TcSPL1–5, − 8 in 340 mM NaCl-treated roots, stems and leaves during 0.5 h, 1 h and 4 h. 0 h was used as the control group in each profile for the 2-ΔΔCt relative quantification (RQ) method. Error bars represent RQmax = 2- (ΔΔCt-ΔCtSD) and RQmin = 2- (ΔΔCt + ΔCtSD) (n = 3). b Relative expression levels of miR156 in 340 mM NaCl-treated Tamarix chinensis for 1 h. 0 h was used as the control group, and the same RQ method was used
The salt stress response patterns of SPLs are similar in the same tissue and appeared to be two temporal expression patterns, that is, the shoots response pattern (tissues above ground) and the roots response pattern (tissues underground). For the shoot response pattern, SPLs were downregulated (0.5 h) and then stable (1 h and 4 h). Specifically, the more significant downregulation in stems (1.9–6.2-fold) than in leaves (1.8–2.8-fold) indicated that SPLs play important roles in the salt stress responses of stems. For the root response pattern, TcSPLs were ‘up-down-up’ -regulated with increasing salt stress time. In particular, TcSPL3, TcSPL4, and TcSPL5 were significantly repressed in the 1 h salt-treated roots. Interestingly, TcSPLs were downregulated during 1 h NaCl treatment in all tissues, suggesting that 1 h is a key timing of the temporal expression patterns. Therefore, we further detected the expression level of TcmiR156 in 2% NaCl-treated T. chinensis (Fig. 5b). The results demonstrate that the salt stress responses of TcSPLs were negatively correlated with TcmiR156 expression level. All results indicated that TcSPLs under negative control of TcmiR156 play important roles in the salt stress responses.
Discussion
Conservation and divergence of TcSPLs
SPL families have been identified in green alga, moss, lycophyte, and seed plants, and their DNA-binding domain SBP-box is highly conserved throughout the plant kingdom [8]. Our study identified 14 TcSPL genes with conserved SBP-boxes (two incomplete SBP-boxes). The classification and names of 7 groups of the phylogenetic tree closely follow the groups hypothesis from SPL evolutionary study [8], except Group CR of green alga SPLs. In SPLs originating from land plants, the oldest Group I clusters all SPLs with C4-type zinc fingers, including TcSPL7, while other TcSPLs with C3H-type zinc fingers are grouped into younger Group IIa-f. In addition, the third residue divergence of the conserved DLS motif located in the N terminus of the Zn-1 structure was found in TcSPL7 and TcSPL12, indicating that TcSPL12 appeared to be relatively early in origin. Unique motifs, including Motif 5 (unique to IIa) and Motifs 2, 6, 7 and 8 (unique to I and IIa), indicated that I and IIa may be associated with the functional diversity of the SBP family.
According to the number of SPL family members, SPL families of different plants can be roughly divided into two types: (1) canonical SPL family, such as SPL families of Physcomitrella patens [34], tomato [35], Arabidopsis, rice [36] with 13, 15, 16, 19 members, respectively, and (2) expansion of the SPL family due to gene duplication, such as SPL families of poplar [12] and maize [14] with 28 and 31 members, respectively. The TcSPL family, which has 14 members, should belong to the canonical family. Unlike one PtSPL paralogous pair or more that corresponded to one AtSPL gene, only 2 paralogous pairs (TcSPL2/4 and TcSPL3/5) were predicted in TcSPLs, and the number of TcSPLs was largely the same as that of AtSPL in each group. These results indicate that SPL gene duplication of Tamarix and Arabidopsis remains linearly dependent and appears to occur before lineage divergence. The situation is similar in the canonical SPL family, such as rice, but opposite in the expansion SPL family, such as poplar with segmental duplication after lineage divergence.
MRE within TcSPLs
The miRNA target sites within SPLs might exist before the divergence of moss and vascular plants [8]. In this study, almost all SPLs in IIc–IIf had miRNA target sites of miR156, and both the location and sequence of MREs are conserved in TcSPLs. This is consistent with the results from Arabidopsis and poplar SPLs [12, 33], suggesting that SPL posttranscriptional regulation is similar in plants. Six canonical MREs and a non-canonical TcSPL5i-MRE are predicted in TcSPL1–5 and − 8. TcSPL1/3/5/8-MREs located in their last exon had higher conservation than TcSPL2/4-MREs located in their 3′-UTR. According to the evidence of higher conservation and conserved target motif ALSLLS, we suggest that the MRE located in the last exon might suffer more selective pressure than that in UTR. For TcSPL5i-MRE, its characterizations are non-canonical to all putative SPL orthologs, such as poor complementarity with miR156, lower pairing Gibbs free energy, first exon location and target motif. We speculate that TcSPL5i-MRE seems to be a specific translation inhibition site of the SPL family compared to AtSPL3 [33]. The DLR assay proves the interaction of miR156 and MREs, and their interaction intensities are decreasing in the descending order SPL1/3/8-MRE > SPL5 > SPL2/4 > SPL5i, which is positively relative to their sequence complementarity. In addition, the DLR assay results showed that the 10-11th nucleotides are key sites for all canonical MREs, as well as the TcSPL5i-MRE, which appears to prove the uniqueness of translation inhibition.
Response patterns of miR156-targeted TcSPLs
DGE analysis suggests that TcSPLs may play different roles in response to salt stress. The non-targeted TcSPLs except TcSPL7 are induced, while targeted TcSPLs are inhibited, by salt. In maize, 57% (11/19) of targeted SPLs are inhibited by salt or/and drought, and most non-targeted SPLs are induced [14], also indicating that expression patterns between targeted SPLs and non-targeted SPLs differ. In addition, highly abundant non-targeted TcSPLs (TcSPL6, − 9, − 10) belonging to IIa may be associated with many unique motifs identified in IIa.
Furthermore, we investigated the temporal expression pattern of targeted TcSPLs in different tissues to determine their salt stress response features. The targeted TcSPLs in leaves/stems remained stable after the quick downregulation showed a simple inhibition-response pattern to salt stress. The inhibitory effect was more dominant in stems. In roots, targeted TcSPLs show a complex response pattern ‘up-down-up’ –regulation. The upregulation during 0.5 h salt stress was consistent with DGE analysis. The downregulation during 1 h salt stress is consistent in DEG profiles in 2.5 h, suggesting a delay inhibition compared to stems/leaves. Together with the abundance recovered during 4 h salt stress, the targeted TcSPLs seem to be a valley-type (U curve) expression pattern to salt stress, and 1 h should be a key inverting time point. The significant negative correlation to stem-loop qPCR of TcmiR156 during 1 h salt stress confirmed this possibility. The negative expression trend is an indicator of regulation in miRNA-target profiles [37, 38]. The TcSPLs under the negative control of TcmiR156 play important roles in the salt stress responses. We suggest that TcmiR156 may play important roles in salt stress responses by negative control of TcSPLs. Many studies have shown the functional redundancy among TcSPLs in plant development regulation [39, 40]. Similar salt stress response patterns indicated that 6 miR156-targeted TcSPLs may be redundant in post-transcriptional regulation. Therefore, functional studies of miR156-targeted TcSPLs should employ experimental design that avoid potential obstacles due to redundancy.
Conclusions
In this study, we conducted a systematic analysis of the SPL gene family in T. chinensis, examining 12 TcSPL genes clustered into 7 groups. The illustrated conserved motifs and MREs showed divergence among groups and similarity within each group. The DEG suggested potential different functions of miR156-targeted SPLs vs non-targeted SPLs in salt stress responses. MREs are conserved in location and sequence with the exception of TcSPL5i-MRE. The miR156-targeted SPLs are proved by DLR assay of MRE-miR156 interaction. The expression patterns of different tissues suggested that 1 h (salt stress time) could be a critical time point of miR156-targeted SPL salt stress responses. Our work provides a foundation for further post-transcriptional regulation studies of SPLs and would be helpful for determining the miR156/SPL-mediated molecular mechanisms underlying T. chinensis salt stress tolerance.
Methods
Plant materials
All materials were collected from the one-month-old seedings of the same T. chinenses ortet grown in campus of Nanjing Forestry University (Nanjing, Jiangsu, China). The roots of seedings were immersed in 340 mM NaCl solution for 0 h, 0.5 h, 1 h and 4 h. Roots, stems and leaves were cleaned after collection and immediately frozen in liquid nitrogen and stored at − 80 °C.
Prediction and identification of TcSPL and source of other SPLs
Genes and protein sequences were obtained from the assembled transcripts of RNA-seq data [32]. By the hidden Markov model (HMM) prediction referring to SBP domain profile from Pfam (pfam03110, http://Pfam.sanger.ac.uk/), TcSPL transcripts were predicted. All candidate TcSPL genes further were identified in plant transcription factor database by the BLASTP searches and the sequences lacking SBP-boxes were rejected. Full cDNA sequences of TcSPL1–5 were identified by Rapid Amplification of cDNA End (RACE) according to the manual of SMARTer RACE 5′/3′ Kit (Clotech, CA, USA) with slight improvement [41,42,43]. Predicted complete CDS of TcSPL6–10 were identified by sequencing of corresponding sequences amplification. TcSPL11–14 are lack of complete CDS and their partial CDS or protein sequences were used for following analysis. TcSPL13, − 14 lack of full SBP-box were rejected in phylogenetic analysis. All sequences are listed Additional file 1: Table S1.
Additionally, Genes and protein sequences of AtSPLs and PtSPLs are downloaded from the Arabidopsis information resource database (http://www.Arabidopsis.org/) and Phytozome database (https://phytozome.jgi.doe.gov/), respectively (Additional file 1: Table S1).
Sequence alignment and phylogenetic analysis
Multiple sequence alignment of the SBP-boxes of TcSPLs, AtSPLs and PtSPLs were obtained by alignment method MUSCLE. A phylogenetic analysis was performed using MEGA 7.0 [44] with the neighbor-joining method and 1000 bootstrap replicates.
Motif analyses and MRE analyses of SPL genes
The amino acid sequence length, molecular weight and isoelectric point of the putive protein were calculated using the protparam program (http://web.expasy.org/protparam/). Motifs were identified using MEME program (http://meme-suite.org/tools/meme) with default parameters. The miR156-targeted SPL genes and MREs were predicted by psRNATarget (http://plantgrn. noble.org/psRNATarget/). Compare of MRE within TcSPLs with miR156 and conservation of MRE within TcSPLs, AtSPLs and PtSPLs were analyzed by multiple sequence alignment with software CLUSTAL X [45].
Expression analysis of TcSPL targeted by TcmiR156
The total RNA extraction from different tissues of T. chinensis and cDNA synthesis was achieved using RNAprep Pure Plant Kit (DP441, Tiangen, Beijing, China) and PrimeScript™ RT Master Mix RT Master (RR036Q, Takara, Dalian, China) according to the manufacturer’s instructions. qRT-PCR analysis was performed in Viia 7 Real Time PCR System (ABI, California, USA) with saturated dye EvaGreen (Biotium, CA, USA) followed recommended qPCR Master Mix reaction mixture and amplification procedure. The gene-specific primers listed in Additional file 2: Table S2 were designed employing ExpressionSuite software (ABI, CA, USA). The relative expression levels were calculated using the 2−∆∆Ct method based on reference gene TcTIF (Additional file 2: Table S2).
Expression analysis of TcmiR156
Each 1 μg total RNA of mixed tissues of T. chinensis under no stress and under 1 h NaCl stress was reverse-transcribed using the PrimeScript RT reagent kit (Takara, Dalian, China) with additional stem-loop primer [46] of TcmiR156 (Additional file 2: Table S2). The qRT-PCR and analysis method were same as mentioned above.
The dual-luciferase reporter (DLR) assay of MRE
The dual-reporter refers to the simultaneous expression and measurement of two individual reporter enzymes within a single system. In the DLR assay, the activities of firefly (Photinus pyralis) and Renilla (Renilla reniformis) luciferases are measured sequentially from a single sample. P2GW7 vector with TcmiR156 insertion was used as effector for transient overexpression of 20-nt mature miR156. 35SGLO vector was set as reporter by inserting MRE in 3’UTR of firefly luciferase. After co-transformation of effector and reporter into Populus protoplast, the fluorescence intensity generated from firefly luciferase and Renilla luciferase were automatically detected in Glomax-96 microplate luminometer with four replicates of each DLR assay. The luciferin substrate was prepared employing the Dual-Luciferase Reporter Assay Kit (Promega, WI, USA).
Availability of data and materials
All TcSPL cDNA sequences and primers are available in Additional files.
Abbreviations
- CDS:
-
Coding sequence
- DGE:
-
Digital gene expression profiles
- DLR:
-
Dual-luciferase reporter
- HMM:
-
Hidden Markov model
- ML:
-
Maximum likelihood method
- mMRE:
-
Mutated MRE sequence
- MRE:
-
miRNA response element
- NLS:
-
Nuclear localization signal
- pI:
-
Isoelectric point
- RACE:
-
Rapid Amplification of cDNA Ends
- ROS:
-
Reactive oxygen species
- SBP:
-
SQUAMOSA promoter-binding
- SOS:
-
Salt overly sensitive
- SPL:
-
SBP protein-like proteins
- SPL-MRE:
-
mRNA cleavage MRE within SPL
- TcSPLi-MRE:
-
Translation inhibition MRE within SPL
- UTR:
-
Untranslated region
References
Jin J, Tian F, Yang D, Meng Y, Kong L, Luo J, et al. Planttfdb 4.0: toward a central hub for transcription factors and regulatory interactions in plants. Nucleic Acids Res. 2017;45:D1040–5.
Riechmann JL, Heard J, Martin G, Reuber L, Jiang C, Keddie J, et al. Arabidopsis transcription factors: genome-wide comparative analysis among eukaryotes. Science. 2000;290:2105–10.
Li S, Xie Z, Hu C, Zhang J. A review of auxin response factors (arfs) in plants. Front Plant Sci. 2016;7:47.
Wang P, Cheng T, Lu M, Liu G, Li M, Shi J, et al. Expansion and functional divergence of ap2 group genes in spermatophytes determined by molecular evolution and arabidopsis mutant analysis. Front Plant Sci. 2016;7:1383.
Nakashima K, Takasaki H, Mizoi J, Shinozaki K, Yamaguchi-Shinozaki K. NAC transcription factors in plant abiotic stress responses. Biochim Biophys Acta. 2012;1819:97–103.
Moreno MA, Harper LC, Krueger RW, Dellaporta SL, Freeling M. Liguleless1 encodes a nuclear-localized protein required for induction of ligules and auricles during maize leaf organogenesis. Genes Dev. 1997;11:616.
Chen X, Zhang Z, Liu D, Zhang K, Li A, Mao L. Squamosa promoter-binding protein-like transcription factors: star players for plant growth and development. J Integr Plant Biol. 2010;52:946–51.
Guo A, Zhu Q, Gu X, Ge S, Yang J, Luo J. Genome-wide identification and evolutionary analysis of the plant specific sbp-box transcription factor family. Gene. 2008;418:1–8.
Stief A, Altmann S, Hoffmann K, Pant BD, Scheible WR, Baurle I. Arabidopsis mir156 regulates tolerance to recurring environmental stress through spl transcription factors. Plant Cell. 2014;26:1792–807.
Hou H, Jia H, Yan Q, Wang X. Overexpression of a sbp-box gene (vpsbp16) from chinese wild vitis species in arabidopsis improves salinity and drought stress tolerance. Int J Mol Sci. 2018;19:940.
Cui L, Shan J, Shi M, Gao J, Lin H. The mir156-spl9-dfr pathway coordinates the relationship between development and abiotic stress tolerance in plants. Plant J. 2014;80:1108–17.
Li C, Lu S. Molecular characterization of the spl gene family in populus trichocarpa. BMC Plant Biol. 2014;14:131.
Wang P, Chen D, Zheng Y, Jin S, Yang J, Ye N. Identification and expression analyses of sbp-box genes reveal their involvement in abiotic stress and hormone response in tea plant (camellia sinensis). Int J Mol Sci. 2018;19:3404.
Mao H, Yu L, Li Z, Yan Y, Han R, Liu H, et al. Genome-wide analysis of the spl family transcription factors and their responses to abiotic stresses in maize. Plant Gene. 2016;6:1–12.
Ning K, Chen S, Huang H, Jiang J, Yuan H, Li H. Molecular characterization and expression analysis of the spl gene family with bpspl9 transgenic lines found to confer tolerance to abiotic stress in betula platyphylla suk. Plant Cell Tissue Organ Cult. 2017;130:469–81.
Rhoades MW, Reinhart BJ, Lim LP, Burge CB, Bartel B, Bartel DP. Prediction of plant microrna targets. Cell. 2002;110:513–20.
Yu Y, Jia T, Chen X. The ‘how’ and ‘where’ of plant micrornas. New Phytol. 2017;216:1002–17.
Arshad M, Feyissa BA, Amyot L, Aung B, Hannoufa A. Microrna156 improves drought stress tolerance in alfalfa (medicago sativa) by silencing SPL13. Plant Sci. 2017;258:122–36.
Aung B, Gruber MY, Hannoufa A. The microrna156 system: a tool in plant biotechnology. Biocatal Agric Biotechnol. 2015;4:432–42.
Wang H, Wang H. The mir156/spl module, a regulatory hub and versatile toolbox, gears up crops for enhanced agronomic traits. Mol Plant. 2015;8:677–88.
Wang S, Li S, Liu Q, Wu K, Zhang J, Wang S, et al. The osspl16—gw7 regulatory module determines grain shape and simultaneously improves rice yield and grain quality. Nat Genet. 2015;47:949.
Miura K, Ikeda M, Matsubara A, Song XJ, Ito M, Asano K, et al. Osspl14 promotes panicle branching and higher grain productivity in rice. Nat Genet. 2010;42:545–9.
Gou J, Debnath S, Sun L, Flanagan A, Tang Y, Jiang Q, et al. From model to crop: functional characterization of SPL8 in M. truncatula led to genetic improvement of biomass yield and abiotic stress tolerance in alfalfa. Plant Biotechnol J. 2018;16:951–62.
Zhang L, Li G, Dong G, Wang M, Di D, Kronzucker HJ, et al. Characterization and comparison of nitrate fluxes in Tamarix ramosissima and cotton roots under simulated drought conditions. Tree Physiol. 2019;39:628–40.
Ding F, Yang J, Yuan F, Wang B. Progress in mechanism of salt excretion in recretohalopytes. Front Biol. 2010;5:164–70.
Ji X, Nie X, Liu Y, Zheng L, Zhao H, Zhang B, et al. A bHLH gene from Tamarix hispida improves abiotic stress tolerance by enhancing osmotic potential and decreasing reactive oxygen species accumulation. Tree Physiol. 2016;36:193–207.
Zheng L, Liu G, Meng X, Liu Y, Ji X, Li Y, et al. A WRKY gene from Tamarix hispida, thwrky4, mediates abiotic stress responses by modulating reactive oxygen species and expression of stress-responsive genes. Plant Mol Biol. 2013;82:303–20.
Wang L, Li Z, Lu M, Wang Y. Thnac13, a nac transcription factor from tamarix hispida, confers salt and osmotic stress tolerance to transgenic tamarix and arabidopsis. Front Plant Sci. 2017;8:635.
Ji X, Wang Y, Liu G. Expression analysis of myc genes from tamarix hispida in response to different abiotic stresses. Int J Mol Sci. 2012;13:1300–13.
Wang L, Qin L, Liu W, Zhang D, Wang Y. A novel ethylene-responsive factor from tamarix hispida, therf1, is a gcc-box- and dre-motif binding protein that negatively modulates abiotic stress tolerance in arabidopsis. Physiol Plant. 2014;152:84–97.
Zang D, Wang C, Ji X, Wang Y. Tamarix hispida zinc finger protein thzfp1 participates in salt and osmotic stress tolerance by increasing proline content and sod and pod activities. Plant Sci. 2015;235:111–21.
Wang J, Xu M, Gu Y, Xu L. Differentially expressed gene analysis of tamarix chinensis provides insights into nacl-stress response. Trees. 2017;31:645–58.
Gandikota M, Birkenbihl RP, Höhmann S, Cardon GH, Saedler H, Huijser P. The miRNA156/157 recognition element in the 3′ UTR of the Arabidopsis SBP box gene SPL3 prevents early flowering by translational inhibition in seedlings. Plant J. 2007;49:683–93.
Riese M. Strukturelle und funktionelle untersuchungen der SBP-box gene in Physcomitrella patens; 2006.
Silva GFFE, Silva EM, Azevedo MDS, Guivin MAC, Ramiro DA, Figueiredo CR, et al. Microrna156-targeted spl/sbp box transcription factors regulate tomato ovary and fruit development. Plant J. 2014;78:604–18.
Yang Z, Wang X, Gu S, Hu Z, Xu H, Xu C. Comparative study of sbp-box gene family in arabidopsis and rice. Gene. 2008;407:1–11.
Chen G, Li J, Liu Y, Zhang Q, Gao Y, Fang K, et al. Roles of the ga-mediated spl gene family and mir156 in the floral development of chinese chestnut ( castanea mollissima ). Int J Mol Sci. 2019;20:1577.
Zhang W, Abdelrahman M, Jiu S, Guan L, Han J, Zheng T, et al. Vvmir160s/vvarfs interaction and their spatio-temporal expression/cleavage products during ga-induced grape parthenocarpy. BMC Plant Biol. 2019;19(1):111.
Cardon GH, Höhmann S, Nettesheim K, Saedler H, Huijser P. Functional analysis of the arabidopsis thaliana sbp-box gene spl3: a novel gene involved in the floral transition. Plant J. 2010;12:367–77.
Wang JW, Czech B, Weigel D. Mir156-regulated spl transcription factors define an endogenous flowering pathway in arabidopsis thaliana. Cell. 2009;138:738–49.
Wang H, Zhang W, Wang M, Cheng Q. Cloning and characterization of the PtVIP1 gene in Populus; 2018. https://doi.org/10.1007/s11676-018-0745-z.
Wang H, Wang M, Cheng Q. Capturing the alternative cleavage and polyadenylation sites of 14 nac genes in populus using a combination of 3′-race and high-throughput sequencing. Molecules. 2018;23:608.
Cheng T, Shi J, Dong Y, Ma Y, Peng Y, Hu X, et al. Hydrogen sulfide enhances poplar tolerance to high-temperature stress by increasing s-nitrosoglutathione reductase (GSNOR) activity and reducing reactive oxygen/nitrogen damage. Plant Growth Regul. 2017;84:1–13.
Kumar S, Stecher G, Tamura K. Mega7: molecular evolutionary genetics analysis version 7.0 for bigger datasets. Mol Biol Evol. 2016;33:1870.
Jeanmougin F, Thompson JD, Gouy M, Higgins DG, Gibson TJ. Multiple sequence alignment with clustal x. Trends Biochem Sci. 1998;23:403–5.
Chen C. Real-time quantification of micrornas by stem-loop rt-pcr. Nucleic Acids Res. 2005;33:e179.
Acknowledgements
Not applicable.
Funding
This research was supported by the Science and Technology Support Program of Jiangsu Province (CN), BE2011321, and the Priority Academic Program Development of Jiangsu Higher Education Institutions (PAPD).
Author information
Authors and Affiliations
Contributions
LX and MX conceived and designed the project. YY and JW undertook the molecular biology experiment. JW and YY participated in the data analysis. JW and LF drafted the manuscript. LX and JW modified the manuscript. All authors have read and approved the manuscript for publication.
Corresponding author
Ethics declarations
Ethics approval and consent to participate
Not applicable.
Consent for publication
Not applicable.
Competing interests
The authors declare that they have no competing interests.
Additional information
Publisher’s Note
Springer Nature remains neutral with regard to jurisdictional claims in published maps and institutional affiliations.
Additional files
Additional file 1:
Table S1. Source and sequences of SPLs for the phylogenetic analysis. (XLSX 24 kb)
Additional file 2:
Table S2. Primers for qRT-PCR. (XLSX 9 kb)
Additional file 3:
Figure S1. Gene structures of TcSPL1–5, − 8. (PDF 48 kb)
Rights and permissions
Open Access This article is distributed under the terms of the Creative Commons Attribution 4.0 International License (http://creativecommons.org/licenses/by/4.0/), which permits unrestricted use, distribution, and reproduction in any medium, provided you give appropriate credit to the original author(s) and the source, provide a link to the Creative Commons license, and indicate if changes were made. The Creative Commons Public Domain Dedication waiver (http://creativecommons.org/publicdomain/zero/1.0/) applies to the data made available in this article, unless otherwise stated.
About this article

Cite this article
Wang, J., Ye, Y., Xu, M. et al. Roles of the SPL gene family and miR156 in the salt stress responses of tamarisk (Tamarix chinensis). BMC Plant Biol 19, 370 (2019). https://doi.org/10.1186/s12870-019-1977-6
Received:
Accepted:
Published:
DOI: https://doi.org/10.1186/s12870-019-1977-6