
Abstract
Background
Prognostication of Breast Cancer (BC) relies largely on traditional clinical factors and biomarkers such as hormone or growth factor receptors. Due to their suboptimal specificities, it is challenging to accurately identify the subset of patients who are likely to undergo recurrence and there remains a major need for markers of higher utility to guide therapeutic decisions. MicroRNAs (miRNAs) are small non-coding RNAs that function as post-transcriptional regulators of gene expression and have shown promise as potential prognostic markers in several cancer types including BC.
Results
In our study, we sequenced miRNAs from 104 BC samples and 11 apparently healthy normal (reduction mammoplasty) breast tissues. We used Case–control (CC) and Case-only (CO) statistical paradigm to identify prognostic markers. Cox-proportional hazards regression model was employed and risk score analysis was performed to identify miRNA signature independent of potential confounders. Representative miRNAs were validated using qRT-PCR. Gene targets for prognostic miRNAs were identified using in silico predictions and in-house BC transcriptome dataset. Gene ontology terms were identified using DAVID bioinformatics v6.7. A total of 1,423 miRNAs were captured. In the CC approach, 126 miRNAs were retained with predetermined criteria for good read counts, from which 80 miRNAs were differentially expressed. Of these, four and two miRNAs were significant for Overall Survival (OS) and Recurrence Free Survival (RFS), respectively. In the CO approach, from 147 miRNAs retained after filtering, 11 and 4 miRNAs were significant for OS and RFS, respectively. In both the approaches, the risk scores were significant after adjusting for potential confounders. The miRNAs associated with OS identified in our cohort were validated using an external dataset from The Cancer Genome Atlas (TCGA) project. Targets for the identified miRNAs were enriched for cell proliferation, invasion and migration.
Conclusions
The study identified twelve non-redundant miRNAs associated with OS and/or RFS. These signatures include those that were reported by others in BC or other cancers. Importantly we report for the first time two new candidate miRNAs (miR-574-3p and miR-660-5p) as promising prognostic markers. Independent validation of signatures (for OS) using an external dataset from TCGA further strengthened the study findings.
Background
The global burden of breast cancer (BC) is 1.7 million and is one of the leading causes of cancer related death among women and the most frequently diagnosed cancer in 140 of 182 countries, as per the 2012 statistics [1]. Although advancements in diagnosis, screening and awareness help identify BC at an early stage, optimal management has remained a challenge due to its histological and molecular heterogeneity [2], and varying response to therapies even within clinical subtypes of BC [3]. Identification and validation of prognostic markers that can stratify patients based on their risk for recurrence and/or death may help in optimizing therapies to improve disease outcomes and quality of life. Estrogen Receptor (ER) and Human Epidermal Growth Factor Receptor 2 (HER2) are widely being used as both prognostic and predictive markers but remain as imperfect estimators of the risk for recurrence [4]. While, messenger RNA (mRNA) signatures from global gene expression profiling have also been put forth as potential prognostic markers for BC [5–8], their utility is limited to specific clinical settings [9]. This further emphasizes the need to identify robust prognostic markers with higher sensitivity, accuracy and reproducibility.
MicroRNAs (miRNAs, 18–25 nt) are evolutionarily conserved small non-coding RNAs that have shown promise as both diagnostic and prognostic biomarkers for several cancer types [10]. Predominantly, miRNAs behave as post-transcriptional regulators of gene expression, promoting either mRNA degradation or translation inhibition, depending upon the complementarity shared between the seed sequence of miRNAs and the corresponding 3' untranslated region of the target sequence [11–13]. However, studies have shown that they also activate gene expression [14]. Being either pleiotropic (one miRNA regulating several mRNAs) or highly redundant (several miRNAs targeting one mRNA) in nature [15], the impact of miRNA dysregulation in cancer is complex and yet promising in the overall landscape of tumorigenesis and prognostication.
Although several studies have highlighted the significance of miRNAs as diagnostic [16, 17] and prognostic markers for various cancers [18, 19], including BC [20–23], a consensus signature has not yet been identified due to differences in the profiling platforms employed, analytical approaches implemented, sample types (e.g. adjacent normal tissues or reduction mammoplasty specimens) used for analysis and tumor heterogeneity. The majority of the studies have utilized profiling platforms such as microarray or qRT-PCR, which are limited to the detection of known targets at the time of assay development. Hybridization platforms are also burdened with the problems of cross hybridization, background signal, low sensitivity and limitations on the dynamic range of detection. These problems are now overcome by Next Generation Sequencing (NGS) platforms [24]. NGS also offers the advantage of capturing not just miRNAs but a whole repertoire of small RNAs, even those present in low abundance [25], thus enabling a comprehensive analysis of small RNAome. However, despite several advantages offered by NGS, only few studies have utilized NGS platform to identify prognostic markers for BC [26, 27].
Statistical methods implemented in a study also play a vital role in determining the reproducibility of findings in a prognostic signature. Two methods to identify prognostic markers are widely used in the published literature– the case–control (CC) approach [20, 23] and the case-only (CO) approach [18, 19, 28]. While the former method utilizes a set of differentially expressed miRNAs for downstream analysis, the latter offers the advantage of being unbiased in selecting miRNAs for further analysis. Although each of the methods has been used in published miRNA studies, no study has analyzed a dataset using both the methods to compare and identify the best approach.
In this study, we hypothesized that relative variations in miRNA expression in tumors and/or apparently normal (non-malignant) tissues contribute to inter-individual differences in disease trajectory and eventual treatment outcomes. We profiled miRNAs from 104 breast cancers, predominantly of Luminal A and triple negative subtypes and 11 normal tissues (reduction mammoplasty specimens) using the NGS platform (Table 1). Our choice of reduction mammoplasty specimens from apparently healthy subjects was based on the recent literature evidence that comparisons between reduction mammoplasty specimens and tumor adjacent normal tissues showed differential expression of miRNAs, suggesting that adjacent normal tissue may not mirror the normal tissue in terms of histological and molecular characteristics [29]. Profiling of long non-coding RNAs showed differences between tumor adjacent normal tissues and tumor tissues. Differentially expressed long non-coding RNAs were not identified from tumor adjacent normal tissues vs. tumor tissues but were identified only when tumor tissues were compared with reduction mammoplasty specimens, further suggesting that reduction mammoplasty specimens may be the optimal baseline tissue [30]. Our specific objectives were as follows: (i) to identify differentially expressed miRNAs in breast tissues (normal vs. tumor tissues) and (ii) to identify miRNAs as prognostic markers (outcome: Overall Survival, OS and Recurrence Free Survival, RFS) for BC (Fig. 1) and validate the signatures using an external dataset. We have identified a total of twelve miRNAs associated with OS and/or RFS for BC. Of these twelve, we have replicated the prognostic significance of ten miRNAs already reported in literature for BC. To the best of our knowledge, this is the first study to report two novel miRNAs (miR-574-3p and miR-660-5p) for BC prognosis.
Results
Descriptive statistics of NGS and differentially expressed miRNAs
A total of 164,237,348 reads and 10,016,964 reads were detected from the tumor and normal samples, respectively, of which 59 % and 51 % of the reads were retained after adapter trimming. 84–87 % of the reads were mappable to the reference human genome and a total of 25,352,720 reads were mappable to different non-coding RNA classes (miRNAs, piRNAs, snoRNAs, snRNAs, rRNAs and tRNAs). A total of 25,003,223 reads mappable to mature human miRNAs belonged to 1,423 unique miRNAs (RNAs with at least one read count in any of the samples). A total of 126 miRNAs were retained after filtering for low read counts. Following normalization and batch effects correction (Additional file 1: Figure S1), one tumor sample was identified as a potential outlier and was removed from further analysis. Of the 126 miRNAs, 80 were differentially expressed (DE) with fold change (FC) > 2.0 and false discovery rate (FDR) cut-off of 0.05, of which 48 miRNAs were up-regulated and 32 were down-regulated (Additional file 2: Table S1). Unsupervised hierarchical clustering was performed using DE miRNAs. As expected, there was a clear separation of normal and tumor samples, illustrating that the generated miRNA signatures differentiate the two tissue types (Fig. 2). Also, the clustering of samples based on DE is to indicate that the samples are differentiated by the relative expression of a common set of miRNAs rather than by unique miRNAs.

Overall Workflow of the study. In literature, there are two widely used approaches to identify RNAs with prognostic significance – Case–control approach and Case only. In the former approach, only differentially expressed (DE) RNAs are considered for survival analysis whereas in the latter approach, all of the profiled RNAs are considered for survival analysis which therefore aids in identifying prognostic RNAs which would have otherwise not been identified in case–control. While either of the two approaches has been adopted in literature, both the approaches have been followed in this study. FF = Fresh Frozen; FFPE = Formalin Fixed Paraffin Embedded; Normalization* = Reads per kilobase per million (RPKM); FDR = False Discovery Rate; OS = Overall Survival; RFS = Recurrence Free Survival
miRNAs as prognostic signatures for OS and RFS
-
a.
Case–control approach: Eighty DE miRNAs were treated as continuous variables and were subjected to univariate Cox analysis, followed by permutation test. Four miRNAs were associated with OS and two miRNAs were associated with RFS with permutation p ≤ 0.1. The four and two miRNAs identified for OS (Table 2A) and RFS (Table 3A), respectively were used for constructing the risk score. A risk score cut-off point of 1.07 for OS was used to dichotomize the cases into low- (≤1.07) and high-risk groups (>1.07). Similarly, samples were grouped into the two risk groups based on the cut-off point estimated for RFS (0.72). Risk score was then treated as a categorical variable and entered into the univariate Cox model. Tumor stage, grade, age at diagnosis and TNBC status were considered as other clinical covariates and were first tested for their significance in the univariate Cox model. Tumor stage, grade and age at diagnosis were considered as potential confounders, and, irrespective of their significance in the univariate analysis, they were entered into the multivariate model along with the risk score. The higher-risk group was found to have both shorter OS (Hazard ratio, HR = 2.71, p = 0.004; Table 4A, Fig. 3a) and RFS (HR = 2.27, p = 0.003; Table 5A, Fig. 4a), after adjusting for confounders (tumor stage and age at diagnosis for OS and tumor stage for RFS).
Table 1 Demographics of the samples chosen for the study Table 2 miRNAs significant for overall survival (Discovery cohort) Table 3 miRNAs significant for recurrence free survival (Discovery cohort) Fig. 2 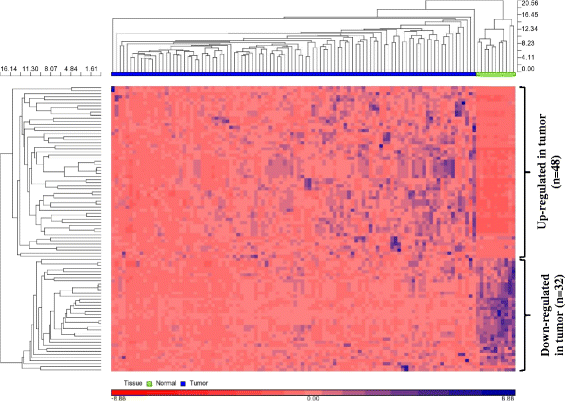
Unsupervised hierarchical clustering (HC) using differentially expressed miRNAs. Unsupervised hierarchical clustering of 80 differentially expressed miRNAs was performed using Euclidean as distance measure and Average linkage method for linkage analysis. HC shows normal and tumor tissues as distinct clusters. 48 miRNAs were up-regulated in tumor and 32 miRNAs were down-regulated in tumor relative to normal tissues. Rows represent miRNAs and columns represent samples
Table 4 Univariate and Multivariate results for overall survival (Discovery cohort) Fig. 3 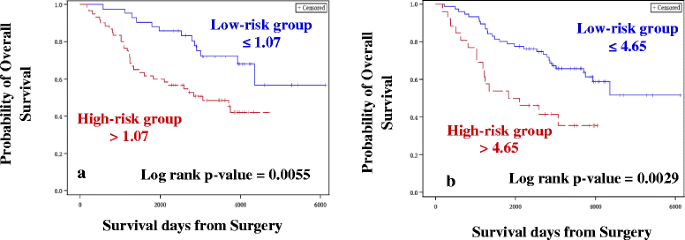
Kaplan-Meier plots for Overall Survival (Discovery cohort). Kaplan-Meier plots were used to estimate OS in Case–control approach (a) and Case-only approach (b). Log rank test was performed to assess differences in survival between the two risk groups. Patients belonging to the high-risk group had shorter OS in both (a) and (b)
-
b.
Case-only approach: One hundred and forty seven miRNAs retained after filtering for low read counts were treated as continuous variables and subjected to univariate Cox analysis followed by the permutation test. In this analysis, 11 miRNAs and 4 miRNAs were associated with OS (Table 2B) and RFS (Table 3B), respectively, and were used for constructing the risk score. A risk score cut-off point of 4.65 for OS was used to dichotomize the cases into low- (≤4.65) and high-risk groups (>4.65). Similarly, samples were grouped into two risk groups, based on the cut-off point estimated for RFS (1.17). Risk score was then treated as a categorical variable and entered into the univariate Cox model. Similar to the case–control approach, the higher-risk group was found to have both shorter OS (HR = 2.76, p = 0.002; Table 4B, Fig. 3b) and RFS (HR = 1.85, p = 0.02; Table 5B, Fig. 4b), after adjusting for confounders (tumor stage for OS and RFS).


qRT-PCR validations of miR-99b-5p, miR-574-3p, miR-769-5p and miR-660-5p
The expressions of miR-99b-5p with a FC of −2.3, miR-574-3p with a FC of −5.8, miR-769-5p with a FC of −1.3 (down-regulated) and miR-660-5p with a FC of 12.8 (up-regulated) were tested in qRT-PCR to confirm the direction of effect and relative quantification agreement between NGS and qRT-PCR. Except for miR-660-5p, that was up-regulated (Fig. 5a), remaining three miRNAs were found to be significantly down-regulated in tumor tissues relative to normal samples. qRT-PCR experiments (Fig. 5b) supported the NGS findings.

Kaplan-Meier plots for Recurrence Free Survival (Discovery cohort). Kaplan-Meier plots were used to estimate RFS in Case–control approach (a) and Case-only approach (b). Log rank test was performed to assess differences in survival between the two risk groups. Patients belonging to the high-risk group had shorter RFS in both (a) and (b)
Identification of potential targets for miRNAs and their role in cancer biology
The in-house transcriptome (mRNA) datasets available for BC were accessed (GEO accession ID GSE22820) [31] and analyzed for DE of mRNAs from a matched subset of samples (n = 17). 2,869 genes (mRNAs) were DE, of which 628 were up-regulated and 2241 were down-regulated.
A combined total of 4,762 targets were predicted by TargetScan for the 12 miRNAs associated with OS and/or RFS. Of these, only 698 targets (~15 % of in silico predicted targets) overlapped with the mRNA expression dataset. This low percent overlap between in silico and in situ comparisons is expected when breast tissue specific expression signatures filtered for histological and molecular subtypes are used to interrogate the potential interactions between miRNA-mRNA. The profiled interactions with transcriptome data also serve as an approach for functional validation of the miRNA targets within breast tissues and minimize the number of false positive targets identified. A total of 168 clusters were found and when interrogated for gene ontology (GO) classifications with an enrichment score (ES) ≥ 1.3, 57 clusters were retained (Table 6). We identified two targets for miR-574-3p (DAB2IP and SAMD4A) which did not belong to any cluster due to limited hits. From the clusters, statistically significant GO terms (p < 0.05) related to cancer were identified. Specifically, the following terms were interrogated: transcription, blood vessel development, angiogenesis, cell growth, cell morphogenesis, cell motion, cell migration, cell signaling, mammary gland development, cell differentiation, cell proliferation, cell division and cytoskeletal organization. Targets of 8 out of 12 miRNAs (miR-15a-5p, miR-27a-3p, miR-374a-3p, miR-374a-5p, miR-221-3p, miR-196a-5p, miR-146b-5p and miR-660-5p) were enriched for any one of the above-mentioned terms (Additional file 3: Table S2). Targets of miR-574-3p, miR-425-5p, miR-210-3p and miR-193b-3p were clustered with an ES ≤ 1.3 when matched miRNA-mRNA data sets were used and were therefore not probed further. Similar analysis of identifying targets from DE mRNAs was attempted using unmatched samples from the same in-house BC dataset (n = 141). Excellent concordance was observed between the results (in terms of number of targets identified, GO terms and clusters) obtained from matched samples and unmatched samples (data not shown), indicating that the use of matched or unmatched samples have no profound impact on the identification of gene targets for the miRNAs.
Validation of OS-associated miRNAs in an external (TCGA) dataset
Eleven miRNAs that were significant for OS in the CO approach were validated using an external dataset (The Cancer Genome Atlas, TCGA). Risk score was constructed using the eleven miRNAs. An optimal cut-off point was determined using ROC, to group samples into low (≤ −1.13) and high risk (> −1.13). Risk score which was considered as a categorical variable was significant with a p-value of 0.1 after adjusting for tumor stage. Similar to the discovery set, high risk group had shorter survival period with a HR of 2.07 (Fig. 6, Table 7).

qRT-PCR validations of select miRNAs. a One up-regulated miRNA (miR-660-5p, FC = 12.8) was validated in a subset of samples (9 normal samples and 56 tumor samples). b Three down-regulated miRNAs (miR-574-3p, miR-99b-5p and miR-769-5p) were validated in a subset of samples (11 normal samples and 60 tumor samples). All the miRNAs were significantly (* = p < 0.05) differentially expressed, similar to the results obtained in NGS platform. miR-574-3p and miR-660-5p were also found to be associated with Overall Survival
Discussion
In this study, we identified two miRNAs (miR-574-3p and miR-660-5p) as potential novel prognostic markers for BC, associated with OS. They have not been reported earlier for BC, for their association with either OS or RFS. Overall, from both the approaches (CC and CO) adopted for the study, eleven miRNAs and four miRNAs were significant for OS and RFS, respectively. Out of the four miRNAs identified for RFS, three miRNAs (miR-210-3p, miR-425-5p and miR-15a-5p) were also significant for OS.
In recent years, microRNAs have gained prominence as valuable prognostic markers for several cancer types, including BC. Although considerable progress has been made in this field, clinical application of these miRNAs as prognostic markers has not yet been possible because of the generation of different signatures by different studies with only a small number of overlapping molecules [9]. This discrepancy may be attributed to several reasons [32], the primary being the use of different profiling platforms. Studies employing hybridization techniques or qRT-PCR panels have generated signatures based on the available number of miRNAs. While there are ~2,588 miRNAs identified so far [33], as reported in the miRBase, only a few hundreds have been captured on these platforms [18, 34], of which even fewer have been detected in breast tissues. Therefore, we are blinded to the prognostic value of other miRNAs from the larger repertoire. On the other hand, NGS profiling of the entire miRNAome, including even the less abundant ones, can now be used to probe the larger repertoire, which was evident from our study. Approximately, breast tissue specific miRNAs comprise 55 % (n = 1,423) of the total miRNAs (n = 2,588 annotated thus far) and these were captured from the 11 normal breast tissues and 103 breast tumor tissues used for the study, which is by far the largest miRNA dataset to be interrogated for identifying prognostic markers for BC. It is also one of the largest studies in terms of number of samples with complete clinical information sequenced for BC.
Statistical considerations
More often than not, high-throughput techniques suffer from the problems of high dimensionality (a higher number of markers but lower number of samples) and collinearity (correlation between two markers), leading to the generation of instable co-efficients in a traditional Cox-proportional hazards regression model [35]. In such cases, the inclusion of individual miRNAs to build a model may not yield reliable results, whereas considering miRNAs as continuous variables and constructing risk scores overcomes both these problems. However, there are two widely used methods (CC approach and CO approach) to identify miRNAs useful for constructing a risk score. In a typical CC approach, two groups are compared to identify DE miRNAs, which are assessed for their prognostic significance. A CO approach offers a wider data set for interrogation, allowing a comprehensive understanding of miRNAs. As a proof of principle, we adopted both the approaches to identify prognostic markers. As expected, higher numbers of miRNAs were identified as significant in the CO approach. Eleven miRNAs were significant for OS and four miRNAs were significant for RFS in the CO approach as opposed to four and two miRNAs significant for OS and RFS, respectively, in the CC method. miR-210-3p, miR-425-5p and miR-15a-5p were significant for both OS and RFS. A total of 12 non-redundant miRNAs were found to play a role in BC prognosis.
Overall, the differential expression in normal vs. tumor tissues and direction of effects show excellent agreement with what is known from published literature, as detailed below.
Novel prognostic miRNAs for BC
Of the 12 miRNAs identified in this study, two miRNAs (miR-574-3p and miR-660-5p) are potential novel prognostic markers for BC. Both the miRNAs were DE in a tumor vs. normal comparison, with miR-574-3p being down-regulated (FC = −5.8) and miR-660-5p being up-regulated (FC = 12.8) in the tumor samples. A similar direction of effect has been observed for miR-574-3p and miR-660-5p for ovarian cancer [36], colorectal cancer [37] and gastric cancer [38]; and chronic lymphocytic leukemia [39], respectively. However, this is the first report of a potential prognostic role for these miRNAs in BC, although mechanistic insights are required to understand their contribution to tumorigenesis.
miRNAs with dual roles as tumor suppressor and oncogene
In our study, miR-15a-5p was found to be up-regulated in breast tissues (FC = 12.16) and the same direction of expression was observed in Kaposi sarcoma [40] and papillary thyroid carcinomas [41]. However, in other cancer types such as colorectal cancer [42], non-small-cell lung cancer (NSCLC) [43] and pituitary tumors [44], it is expressed in the opposite direction (down-regulation). Amongst BC reports, Kodahl et al. have reported an up-regulation of this miRNA [45], and a recent report by Shinden et al. has shown miR-15a as an independent prognostic marker for BC [46]. Similarly, miR-27a-3p, which was found to be up-regulated in tumors (FC = 6.45) in our study, is in accordance with the direction of expression observed in pancreatic cancer [47] and glioma [48]. Tang et al. have also reported miR-27a to be an oncomiR, the high expression of which promotes breast tumor growth and metastasis and is associated with poor OS in BC patients [49]. However, it is down-regulated in bladder cancer, compared with the normal samples [50]. The observations on miR-15a-5p and miR-27a-3p point to the dual roles of an oncogene and a tumor suppressor and their relative role may be governed in a tissue-specific manner.
miRNAs as oncogenes
We observed high expression (FC = 1.98) of miR-425-5p in breast tumors compared to the normal samples, which is concordant with the results published by Kodahl et al. for BC [45]. Likewise, Peng et al. have also observed the oncogenic function of miR-425, which promotes cell proliferation, cell cycle progression, migration and invasion in gastric cancer [51].
Up-regulation of miR-146b in tumors and its adverse effect on survival has been demonstrated in lung cancer [52, 53], thyroid carcinoma [54] and prostate cancer [55], among other cancer types. Interestingly, miR-146b-5p has also been reported to be up-regulated in BC, which is in accordance with our results (FC = 1.42) and is known to repress BRCA1 expression, thereby promoting cell proliferation [56].
miR-221 is a widely studied oncogene whose high expression is invariably associated with poor outcomes in several cancer types [57–59], including BC [60]. We also report the same direction of expression in tumor tissues with a FC of 1.27.
Cell proliferation, migration, invasion and metastasis have been found to be promoted in BC [61–63], glioblastoma [64, 65], head and neck cancer [66] and gastric cancer [67, 68] due to high expressions of miR-210, miR-196a and miR-374a (including miR-374a-3p and -5p), demonstrating their oncogenic potential. Their role as prognostic markers has also been studied in the above-mentioned cancer types. We were able to identify their prognostic significance following the CO approach, and these findings could have been missed if only the CC approach had been used. The read counts of the two groups (normal and tumor) revealed that these miRNAs were indeed present in higher amounts in tumors relative to the normal samples; the average read counts of miR-210-3p, miR-196a-5p, miR-374a-3p and miR-374a-5p in the normal samples were 2.5, 9.2, 0.7 and 1.09 respectively as against 59.7, 307.6, 46.1 and 108.9 for the tumor group. The lower read counts in normal samples have limited our ability to consider them in a CC study due to our stringent filtering criteria. Overall, the patterns of DE and prognostic significance for the above miRNAs mirror observations from other cancer types.
miRNAs as tumor suppressors
In our study, apart from miR-574-3p, miR-193b-3p was also found to be down-regulated (FC = −4.3) in tumors compared to normal samples, which is in agreement with the studies on endometrioid adenocarcinoma [69], pancreatic cancer [70], oesophageal cancer [71] and gastric cancer [68]. Even in BC, Li et al. have reported a down-regulation of miR-193b in BC cell lines, and the low expression of miR-193b was found to be associated with shorter disease-free survival [72].
Functional roles of the identified prognostic miRNAs
The prognostic significance for recurrence or survival of an associated miRNA is better appreciated from the aspect of potential functional impact on cellular signaling and metabolic pathways, as these contribute to cell death, invasion and overall outcomes for the patient. Apart from functional insights, the potential for development of therapeutics is also important. Keeping these factors in mind, the following discussion is focused on the delineation of pathways using GO terms that are specifically enriched by the identified prognostic miRNAs.
Databases such as TargetScan, miRanda (http://www.microrna.org/) and PicTar (http://pictar.mdc-berlin.de/) have predicted mRNA targets, but a validation of the predicted targets adds more credence to in silico predictions. To this end, we first predicted the targets for all 12 miRNAs using the commonly used database - TargetScan; these were then compared with DE mRNAs obtained from the in-house BC transcriptome dataset. GO terms were identified with a specific focus on terms pertaining to hallmarks of cancer. Interestingly, targets of eight miRNAs were found to be relevant for cell growth and development, indicating that these miRNAs may play key roles in tumorigenesis. Two targets (DAB2IP and SAMD4A) were found for miR-574-3p, of which DAB2IP is involved in apoptosis [73], cell survival [74], among other functions and SAMD4A functions as a translational regulator [75].
Validation of the identified signatures
In a biomarker study, a validation of the findings across different platforms is critical to rule out technical artifacts. Four miRNAs exhibiting different FC (lowest FC being −1.3) were validated using qRT-PCR, with two of the representative miRNAs identified as significant in survival analysis. The validation of representative miRNAs confirms cross-platform concordance and the relative utility of the signatures identified. However, validations using independent cohorts are also crucial for a biomarker study as they facilitate inter-study concordance of expression trends and signatures. NGS data for BC with a larger sample size and complete clinical information are limited in the public domain. We used the available data from TCGA project and applied stringent filtering criteria to obtain a dataset that would be comparable to the discovery set. A total of eleven miRNAs which were found to be associated with OS from the CO approach were considered for validation using the TCGA dataset. TCGA samples were sequenced using Illumina Genome analyzer and Illumina HiSeq platforms. However, all samples were not sequenced on a single platform limiting the analysis and comparisons. Although our discovery set of samples were sequenced using the Illumina Genome analyzer, the number of samples with events (deaths, n = 8) on this platform were limited for the data from TCGA. Therefore, we considered samples sequenced using Illumina HiSeq with sufficient follow-up and events (deaths, n = 27). Due to the fact that NGS platform specific differences in read counts may potentially influence the risk scores we did not adopt the risk scores and cut-off points generated in discovery set. We therefore generated a new risk score for the validation set and an optimal cut-off point was estimated to dichotomize the samples into low and high risk groups. Multivariate analysis revealed that the risk score was significant with p = 0.1 after adjusting for tumor stage. TCGA dataset lacks information on tumor grade. However, tumor grade did not influence the multivariate analysis even in the discovery set. Therefore we reasoned that lack of information on grade in the TCGA data set would not have influenced the study findings. Although for our initial analysis using discovery set we considered p < 0.05 as nominal, the TCGA dataset did not meet this threshold, presumably due to modest sample size (n = 84) and events (n = 27) compared to the discovery set (sample size, n = 104 and events, n = 46). Nevertheless, we still observed the same direction of effect (Hazard Ratio), i.e., patients belonging to the high-risk group was associated with shorter survival period and this validates our initial observations from the discovery set.
Several differences existed between the discovery and validation datasets: (i) the NGS platform for discovery set was Genome Analyzer IIx where as for the validation set was HiSeq; (ii) the risk score cut-off point were estimated individually due to NGS platform differences; (iii) TCGA samples considered for this study were fresh frozen breast cancer tissues whereas the discovery set of breast cancer tissues were from FFPE blocks, (iv) information on tumor grade was not available for TCGA samples and (v) percent cellularity differences were also noted between the discovery and validation cohorts (see methods). However, despite these differences and other characteristics (Table 1), we could demonstrate the trends in the direction of effects (Hazard Ratio) in both the discovery and validation cohorts. The apparent lack of statistical significance (defined nominal value of 0.05) in the OS analysis attempted with TCGA data may be due to the limited sample size and limited number of events in the validation set affecting the power. Further validation of findings is warranted using independent cohorts and higher sample size and events. Overall, we report two novel miRNAs as potential prognostic markers for breast cancer. Remaining miRNAs reported in this study showed excellent concordance to the published reports for their role in BC prognosis.
Conclusions
In summary, we identified a total of twelve non-redundant miRNAs associated with OS and/or RFS. As explained above, ten of the identified miRNAs have been reported in literature as associated with BC prognosis and lends support to the findings in this independent study. However, two miRNAs (miR-574-3p and miR-660-5p) have not been reported previously for BC prognosis. The use of NGS platform to profile miRNAs on a whole genome level in BC has been limited thus far in literature and the data provided complements such efforts towards a comprehensive search for biomarkers. The miRNAs reported for OS have also been validated in independent dataset (TCGA) and functional characterization may help to understand the complex interplay of miRNA mediated gene regulation.
Overall, despite the increasing feasibility of profiling miRNAs and their role in prognostication, mechanistic insights in to the role of miRNAs, establishing gold standard approaches for analysis, and confirmation of these findings by independent laboratories within the context of confounding variables (histological and molecular heterogeneity, stage, grade and treatment) are needed to advance these promising biomarkers into clinical validation.
There is also a growing body of evidence that other small non-coding RNAs such as tRNAs [76], snoRNAs [77] and piRNAs [78] may contribute to tumorigenesis; however their role in BC prognosis is an area of active investigation. Therefore, a deeper exploration of their roles may pave the way for a comprehensive understanding of the small non-coding RNA classes, aiding in the discovery of newer diagnostic and prognostic biomarkers for BC.
Methods
Discovery cohort
One hundred and four breast tumor samples (belonging to the invasive ductal carcinoma histological subtype), along with complete clinicopathological characteristics (Table 1), were accessed from the Alberta Cancer Research Biobank/Canadian Breast Cancer Foundation (CBCF) tumor bank (http://www.acrb.ca/). All of the samples sequenced were non-metastatic (M0) at the time of diagnosis except one, with metastatic cancer (M1) at the time of presentation. Of the 104 patients, 25 were treated with either standard chemotherapeutic drugs (neoadjuvant) or had undergone radiotherapy before tumor resection and 79 were given adjuvant therapy, and were treated predominantly with a polychemotherapy regimen of Taxotere, Adriamycin and Cyclophosphamide (TAC, n = 57). Despite standard care of therapy, 61 patients experienced recurrence and 43 did not; 46 patients had died and 58 were alive at the time of completion of this study. The median age was 50 (Range: 24–79) years and the median follow-up period was 2927.5 (Range: 170 – 6,125) days from the date of diagnosis (between years 1996 and 2008) till January 2015. Patients were further classified into different subtypes based on the presence or absence of immunohistochemical markers such as ER, progesterone receptor (PR) and HER2. Most of the samples (n = 62) belonged to Luminal A subtype with ER positive or PR positive and HER2 negative disease. Thirty samples were negative for ER, PR and HER2 based on immunohistochemical staining score and were classified as Triple Negative breast cancer (TNBC). Ten samples were positive for ER/PR and HER2 staining and were grouped into Luminal HER2 subtype. Two samples were positive for ER and PR (HER2 unknown), but the overall grade was high, and these were grouped into Luminal B subtype, as described earlier [79–81]. All the BC tissues were archived as Formalin Fixed Paraffin-Embedded (FFPE) tissue blocks. All of the samples considered for profiling of miRNAs showed ≥ 70 % tumor cells. The percent distribution of tumor cells in samples were as follows: 70 % (n = 7), 80 - 90 % (n = 13), 90 % (n = 24), 95 % (n = 35) and 100 % (n = 25). Eleven apparently normal breast tissues (confirmed by the pathologist to be free of malignancy, based on the absence of morphological and histological anomalies) were obtained from reduction mammoplasty surgery and were preserved as Fresh Frozen (FF) tissues.
We estimated the number of samples needed to detect statistically significant differences for the measured transcripts between cases and controls in the current study (http://bioinformatics.mdanderson.org/MicroarraySampleSize/ and http://linus.nci.nih.gov/brb/samplesize/) [82, 83]. The following parameters were considered to estimate the sample sizes: α = 0.05, β = 80 % and a fold difference of 2 or more in miRNA expression. Under these conditions, we needed at least 8–11 samples in each group (controls and cases). Our study design included 11 control samples and 104 cases, thus meeting the statistical rigor needed to interpret the data with confidence. Informed consent was obtained from all the patients and the study was approved by the local Institutional Research Ethics committee (Health Research Ethics board of Alberta- Cancer Committee).
Total RNA isolation for small RNA sequencing
Briefly, FF tissues were homogenized using TRIzol (Invitrogen) and total RNA was isolated using Qiagen RNeasy kit according to manufacturers' instructions. Total RNA from FFPE blocks was isolated using the RecoverAll Total Nucleic Acid Isolation Kit (Life Technologies). RNA quality and quantity were analyzed with Bioanalyzer 2100 and RNA Nano Chips (Agilent Technologies). We have followed RNA extraction protocols that have previously been optimized for FF and FFPE tissues wherein the use of different extraction protocols in a comparative miRNA study was shown to result in expression profiles that are highly reproducible and strongly correlated between FF and FFPE tissue types [24, 84].
Small RNA library preparation, sequencing and generation of .bam files
Services from PlantBiosis Ltd (Lethbridge, Alberta, Canada; http://www.plantbiosis.com/) were utilized for the preparation of small RNA libraries and for the generation of .bam files. Small RNAs were sequenced using TruSeq Small RNA Sequencing Kit (Illumina), TruSeq SR Cluster Kit v5-CS-GA (Illumina) and TruSeq SBS Kit v5-GA (Illumina) according to manufacturer’s instructions. All the samples were sequenced on Illumina Genome Analyzer IIx with 36-cycle single-end protocol. Base calling and demultiplexing were done using CASAVA 1.8.2 with default settings, followed by trimming of adapters using CutAdapt software (http://code.google.com/p/cutadapt/). Options were given to retain sequences longer than 17 nucleotides. Quality trimming was performed to retain only reads with a Sanger quality score cut-off of 30. The quality of the sequenced reads after adapter trimming was assessed using FASTQC software (http://www.bioinformatics.babraham.ac.uk/projects/fastqc/). One tumor sample was not processed further due to poor quality and was therefore excluded, leaving 103 tumor samples for further analysis. Trimmed sequences were then aligned to the reference genome using Bowtie [85] and were allowed a maximum of two mismatches. Human hg19 genomic assembly (UCSC), downloaded from Illumina iGenome repository was used as a reference for mapping. Aligned sequences were saved as .sam files, converted to more memory efficient .bam files and sorted by genomic position. Sequencing data and the normalized data for miRNAs were submitted to Gene Expression Omnibus (GEO accession ID GSE68085).
Analysis of .bam files and identification of differentially expressed miRNAs
The .bam files of 11 FF and 103 FFPE tissues were imported into in-house Partek Genomics Suite 6.6 (PGS) software for further analysis (Partek® Genomics Suite software, Version 6.6 beta, Copyright © 2009 Partek Inc., St. Louis, MO, USA). They were mapped to known mature miRNAs using miRBase V20. miRNAs were first filtered to retain only those with a minimum of 10 read counts in at least 90 % of the samples (normal and tumor). Reads per kilobase per million method (RPKM) was used for normalization [86], followed by batch effects correction using the ANOVA model. Principal Component Analysis (PCA) using batch-effects-corrected raw counts was used to identify potential sample outliers. Subsequently, differentially expressed (DE) miRNAs with a fold change (FC) >2.0 and a False Discovery Rate (FDR) cut-off of 0.05 were identified using one-way ANOVA from batch-effects-corrected and filtered normalized counts (after removing sample outliers).
Statistical considerations for the identification of miRNAs as prognostic markers for BC
Case–control approach (CC): miRNAs were filtered to retain only those with a minimum of 10 read counts in at least 90 % of the tumor and normal samples. Considered as continuous variables, DE miRNAs were subjected to univariate Cox proportional hazards regression model with permutation test (n = 10,000), using the R statistical program (‘glmperm’ package) for both OS and RFS. OS and RFS were calculated from the date of diagnosis until an event occurred (death and relapse, respectively). Further statistical analyses were done using SAS (SAS institute Inc., Cary, NC) Version 9.3. For all the statistical analyses except permutation test, p < 0.05 was considered to be statistically significant. The risk score for each sample was constructed for OS and RFS separately, using miRNAs significant in the permutation test (p ≤ 0.1) for OS and RFS. Risk score is a summation obtained by multiplying the expression values of each miRNA with its corresponding co-efficient [18]. In order to dichotomize the cases into low- and high-risk groups, Receiver Operating Characteristic (ROC) curve was used to determine the optimal cut-off point. Kaplan-Meier plots were constructed to estimate the median survival function, and log-rank tests were performed to compare the survival curves of the two survival groups (low- and high-risk groups). Furthermore, multivariate Cox proportional hazards regression model was employed to investigate whether the risk score was a potential independent prognostic factor after accounting for the following variables: age at diagnosis (continuous), tumor stage (I, II vs. III, IV), tumor grade (High vs. Low) and TNBC status (Triple Negative vs. Luminal). Luminal A, Luminal B and Luminal HER2 were grouped as Luminal. Hazard ratio (HR) and their corresponding 95 % confidence interval (CI) were reported for the univariate and multivariate Cox’ regression model.
Case-only approach (CO): miRNAs were filtered to retain only those with a minimum of 10 read counts in at least 90 % of the tumor samples. The filtered list of miRNAs was subjected to univariate analysis (with permutation test), risk score computation and multivariate tests, similar to the case–control approach.
Survival analysis for case–control and case only approaches was performed using only the outcome data from tumor samples. The overall workflow of the study is depicted in Fig. 1.

Kaplan-Meier plot for Overall Survival (External validation cohort). Kaplan-Meier plots were used to estimate OS in Case-only approach. Log rank test was performed to assess differences in survival between the two risk groups. Patients belonging to the high-risk group had shorter OS
qRT-PCR validation of select miRNAs
We have validated three down-regulated miRNAs whose FC ranged from −1.3 to −5.8 and one miRNA which was found to be up-regulated (FC = 12.8), using samples for which RNA was available following NGS. This was done to exemplify the dynamic range of detection and concordance between NGS and qRT-PCR. This analysis included two representative miRNAs (miR-574-3p and miR-660-5p) that were identified to be of prognostic value and considered as novel in BC. miR-99b-5p (FC = −2.3), miR-574-3p (FC = −5.8), miR-769-5p (FC = −1.3) and miR-660-5p (FC = 12.8) were validated using miScript II RT kit (QIAGEN), miScript SYBR Green PCR kit (QIAGEN) and their corresponding miScript Primer Assays according to manufacturers' instructions. All assays were performed in triplicates and human RNU6-2 (QIAGEN) served as the loading control. Fold-expression changes of miRNAs were calculated using the 2-ΔΔCt method [87].
Breast tumor transcriptome analysis (mRNA) and identification of targets for miRNAs
Messenger RNA (mRNA) expression datasets generated previously (GEO accession ID GSE22820) using Agilent microarray platform were available in-house for 176 tumor samples and 10 normal (reduction mammoplasty) samples. Of these, all the normal samples (n = 10) and 17 tumor samples matching with our discovery cohort were selected for analysis. Raw intensity values were Quantile normalized and log 2 transformed, and one-way ANOVA was performed to identify DE genes with FC > 2.0 and FDR cut-off of 0.05 (PGS 6.6).
mRNA targets for miRNAs associated with OS and RFS were first predicted in silico using TargetScan database (Version 6.2) (http://www.targetscan.org/). The targets thus obtained were overlapped with DE mRNAs generated from the in-house dataset. The benefit of using mRNA datasets from breast tissues is that they act as a proxy to the functional validation of mRNA targets identified by the in silico prediction algorithm. The identification of targets was not restricted to those exhibiting inverse relationships with miRNAs, but any correlation of miRNA to mRNA was captured since the miRNA-mRNA interactions are more complex. Gene ontology (GO) terms were identified for targets of every miRNA separately using DAVID bioinformatics tools v6.7 (http://david.abcc.ncifcrf.gov/) [88]. Only clusters with enrichment scores (ES) ≥ 1.3 [88] were used to identify specific GO terms related to cancer with p < 0.05.
External validation cohort
A total of 1,088 BC cases were available in The Cancer Genome Atlas (TCGA) and samples were filtered based on the following criteria: (i) female patients, (ii) no history of other malignancy, (iii) samples with no metastasis at the time of diagnosis, (iv) samples from non Caucasian subjects were removed (self declared ethnicity) and (v) invasive ductal carcinoma. A total of 479 samples were retained after filtering for the above criteria and subtype classification data based on the receptor status is available for 332 samples:203 Luminal A, 58 Luminal B, 52 TNBC and 19 HER2+. Of the 332 samples, information on tumor stage was available for 328 samples. TCGA dataset has samples sequenced in Illumina Genome analyzer and in Illumina HiSeq. Of the 328 samples, 156 were sequenced using the former whereas 172 were sequenced using the latter. Only samples sequenced using Illumina HiSeq were considered for this study as the number of samples with events (deaths) were higher in this subset. Since the discovery set did not have Her2+ subtype, we did not consider these samples from the TCGA dataset as well leaving the sample size at 162. We considered a follow up period of > 3 years for patients who were alive based on our previous work to define the minimum follow-up period [81] for recurrence or survival analysis. Overall, a total of 84 samples (with 27 events and 57 patients who were alive) were retained for survival analysis (Table 1). The percent distribution of tumor cells (cellularity) in TCGA dataset were as follows: (i) 30 – 50 % = 14, (ii) 55 – 70 % = 19 and (iii) 75 – 100 % = 50. One sample did not have any information on tumor cellularity. Compared to the TCGA samples, our discovery cohort had all 104 samples at >70 % cellularity and these differences along with NGS platforms utilized for different cohorts should be taken in to account for finer interpretations of the data.
We analyzed .bam files of 84 samples using PGS and were normalized using RPKM method. The normalized counts were adjusted for confounders such as Batch ID, plate ID and Tissue source site (data not shown). Normalized counts for the eleven miRNAs which were significant for OS in CO approach were extracted for constructing the risk score and an optimal cut-off point was determined using ROC. The new risk score was subjected to univariate and multivariate Cox proportional hazards regression model and was adjusted for tumor stage, age at diagnosis and TNBC status. Since the information on recurrence was not available or was limited, we did not consider validation of miRNAs identified for RFS.
Abbreviations
- BC:
-
Breast cancer
- CC:
-
Case–control
- CO:
-
Case-only
- DE:
-
Differentially expressed
- ER:
-
Estrogen receptor
- ES:
-
Enrichment score
- FC:
-
Fold change
- FDR:
-
False discovery rate
- FF:
-
Fresh frozen
- FFPE:
-
Formalin fixed paraffin embedded
- GO:
-
Gene ontology
- HER2:
-
Human epidermal growth factor receptor 2
- HR:
-
Hazard ratio
- miRNAs:
-
microRNAs
- mRNA:
-
messenger RNA
- NGS:
-
Next generation sequencing
- OS:
-
Overall survival
- PCA:
-
Principal component analysis
- PGS:
-
Partek genomics suite
- PR:
-
Progesterone receptor
- RFS:
-
Recurrence free survival
- ROC:
-
Receiver operating characteristic curve
- RPKM:
-
Reads per kilobase per million
- TCGA:
-
The cancer genome atlas
- TNBC:
-
Triple negative breast cancer
References
Ferlay J, Soerjomataram I, Ervik M, Dikshit R, Eser S, Mathers C, et al. GLOBOCAN 2012 v1.0, Cancer Incidence and Mortality Worldwide: IARC CancerBase No. 11 [Internet]. Lyon, France: International Agency for Research on Cancer; 2013. Available at: http://globocan.iarc.fr.
Bertucci F, Birnbaum D. Reasons for breast cancer heterogeneity. J Biol. 2008;7(2):6.
Ribelles N, Perez-Villa L, Jerez J, Pajares B, Vicioso L, Jimenez B, et al. Pattern of recurrence of early breast cancer is different according to intrinsic subtype and proliferation index. Breast Cancer Res. 2013;15(5):R98.
Paik S, Shak S, Tang G, Kim C, Baker J, Cronin M, et al. A multigene assay to predict recurrence of tamoxifen-treated, node-negative breast cancer. N Engl J Med. 2004;351(27):2817–26.
van de Vijver MJ, He YD, van't Veer LJ, Dai H, Hart AA, Voskuil DW, et al. A gene-expression signature as a predictor of survival in breast cancer. N Engl J Med. 2002;347(25):1999–2009.
Chang HY, Nuyten DS, Sneddon JB, Hastie T, Tibshirani R, Sorlie T, et al. Robustness, scalability, and integration of a wound-response gene expression signature in predicting breast cancer survival. Proc Natl Acad Sci U S A. 2005;102(10):3738–43.
Naderi A, Teschendorff AE, Barbosa-Morais NL, Pinder SE, Green AR, Powe DG, et al. A gene-expression signature to predict survival in breast cancer across independent data sets. Oncogene. 2007;26(10):1507–16.
Sotiriou C, Wirapati P, Loi S, Harris A, Fox S, Smeds J, et al. Gene expression profiling in breast cancer: understanding the molecular basis of histologic grade to improve prognosis. J Natl Cancer Inst. 2006;98(4):262–72.
Sotiriou C, Piccart MJ. Taking gene-expression profiling to the clinic: when will molecular signatures become relevant to patient care? Nat Rev Cancer. 2007;7(7):545–53.
Bertoli G, Cava C, Castiglioni I. MicroRNAs: New Biomarkers for Diagnosis, Prognosis, Therapy Prediction and Therapeutic Tools for Breast Cancer. Theranostics 2015 06/17;5(10):1122–1143.
Bartel DP. MicroRNAs: genomics, biogenesis, mechanism, and function. Cell. 2004;116(2):281–97.
Lee RC, Feinbaum RL, Ambros V. The C. elegans heterochronic gene lin-4 encodes small RNAs with antisense complementarity to lin-14. Cell. 1993;75(5):843–54.
Wightman B, Ha I, Ruvkun G. Posttranscriptional regulation of the heterochronic gene lin-14 by lin-4 mediates temporal pattern formation in C. elegans. Cell. 1993;75(5):855–62.
Vasudevan S, Tong Y, Steitz JA. Switching from repression to activation: microRNAs can up-regulate translation. Science. 2007;318(5858):1931–4.
Krek A, Grun D, Poy MN, Wolf R, Rosenberg L, Epstein EJ, et al. Combinatorial microRNA target predictions. Nat Genet. 2005;37(5):495–500.
Rabinowits G, Gercel-Taylor C, Day JM, Taylor DD, Kloecker GH. Exosomal microRNA: a diagnostic marker for lung cancer. Clin Lung Cancer. 2009;10(1):42–6.
Chen X, Ba Y, Ma L, Cai X, Yin Y, Wang K, et al. Characterization of microRNAs in serum: a novel class of biomarkers for diagnosis of cancer and other diseases. Cell Res. 2008;18(10):997–1006.
Yu SL, Chen HY, Chang GC, Chen CY, Chen HW, Singh S, et al. MicroRNA signature predicts survival and relapse in lung cancer. Cancer Cell. 2008;13(1):48–57.
Li X, Zhang Y, Zhang Y, Ding J, Wu K, Fan D. Survival prediction of gastric cancer by a seven-microRNA signature. Gut. 2010;59(5):579–85.
Gasparini P, Cascione L, Fassan M, Lovat F, Guler G, Balci S, et al. microRNA expression profiling identifies a four microRNA signature as a novel diagnostic and prognostic biomarker in triple negative breast cancers. Oncotarget. 2014;5(5):1174–84.
Cuk K, Zucknick M, Heil J, Madhavan D, Schott S, Turchinovich A, et al. Circulating microRNAs in plasma as early detection markers for breast cancer. Int J Cancer. 2013;132(7):1602–12.
Chan M, Liaw CS, Ji SM, Tan HH, Wong CY, Thike AA, et al. Identification of circulating microRNA signatures for breast cancer detection. Clin Cancer Res. 2013;19(16):4477–87.
Kleivi Sahlberg K, Bottai G, Naume B, Burwinkel B, Calin GA, Borresen-Dale A, et al. A Serum MicroRNA Signature Predicts Tumor Relapse and Survival in Triple Negative Breast Cancer Patients. Clinical Cancer Research 2014;21(5):1207-1214.
Tam S, de Borja R, Tsao MS, McPherson JD. Robust global microRNA expression profiling using next-generation sequencing technologies. Lab Investig. 2014;94(3):350–8.
Liu J, Jennings SF, Tong W, Hong H. Next generation sequencing for profiling expression of miRNAs: technical progress and applications in drug development. J Biomed Sci Eng. 2011;4(10):666–76.
Farazi TA, Horlings HM, Ten Hoeve JJ, Mihailovic A, Halfwerk H, Morozov P, et al. MicroRNA sequence and expression analysis in breast tumors by deep sequencing. Cancer Res. 2011;71(13):4443–53.
Volinia S, Croce CM. Prognostic microRNA/mRNA signature from the integrated analysis of patients with invasive breast cancer. Proc Natl Acad Sci U S A. 2013;110(18):7413–7.
Liu N, Cui RX, Sun Y, Guo R, Mao YP, Tang LL, et al. A four-miRNA signature identified from genome-wide serum miRNA profiling predicts survival in patients with nasopharyngeal carcinoma. Int J Cancer. 2014;134(6):1359–68.
Hannafon BN, Sebastiani P, de las Morenas A, Lu J, Rosenberg CL. Expression of microRNA and their gene targets are dysregulated in preinvasive breast cancer. Breast Cancer Res. 2011;13(2):R24.
Wagner E, Liu Y, Schneider B, Storniolo AM, Han J, He C. Abstract 3268: Differences in expression of lncRNAs in breast tumor, adjacent normal-appearing breast tissue, and normal breast tissue from healthy donors. Cancer Res. 2014;74(19):3268–8.
Bastani M, Vos L, Asgarian N, Deschenes J, Graham K, Mackey J, et al. A Machine Learned Classifier That Uses Gene Expression Data to Accurately Predict Estrogen Receptor Status. PLoS ONE. 2013;8(12):e82144.
Shalaby T, Fiaschetti G, Baumgartner M, Grotzer MA. MicroRNA signatures as biomarkers and therapeutic target for CNS embryonal tumors: the pros and the cons. Int J Mol Sci. 2014;15(11):21554–86.
Kozomara A, Griffiths-Jones S. miRBase: annotating high confidence microRNAs using deep sequencing data. Nucleic Acids Res. 2014;42(D1):D68–73.
Sana J, Radova L, Lakomy R, Kren L, Fadrus P, Smrcka M, et al. Risk Score based on microRNA expression signature is independent prognostic classifier of glioblastoma patients. Carcinogenesis. 2014;35(12):2756–62.
Xiong J, Bing Z, Su Y, Deng D, Peng X. An integrated mRNA and microRNA expression signature for glioblastoma multiforme prognosis. PLoS ONE. 2014;9(5):e98419.
Wang L, Zhu M, Ren A, Wu H, Han W, Tan R, et al. A Ten-MicroRNA Signature Identified from a Genome-Wide MicroRNA Expression Profiling in Human Epithelial Ovarian Cancer. PLoS ONE. 2014;9(5):e96472.
Della Vittoria Scarpati G, Calura E, Di Marino M, Romualdi C, Beltrame L, Malapelle U, et al. Analysis of differential miRNA expression in primary tumor and stroma of colorectal cancer patients. BioMed Res Int. 2014;2014:840921.
Su Y, Ni Z, Wang G, Cui J, Wei C, Wang J, et al. Aberrant expression of microRNAs in gastric cancer and biological significance of miR-574-3p. Int Immunopharmacol. 2012;13(4):468–75.
Zhu D, Zhu W, Fang C, Fan L, Zou Z, Wang Y, et al. miR-181a/b significantly enhances drug sensitivity in chronic lymphocytic leukemia cells via targeting multiple anti-apoptosis genes. Carcinogenesis. 2012;33(7):1294–301.
Wu X, Pu X, Zhao Z, Zhao Y, Kang X, Wu W, et al. The expression profiles of microRNAs in Kaposi’s sarcoma. Tumor Biol. 2014;36(1):437-446.
Liu X, He M, Hou Y, Liang B, Zhao L, Ma S, et al. Expression profiles of microRNAs and their target genes in papillary thyroid carcinoma. Oncol Rep. 2013;29(4):1415–20.
Xiao G, Tang H, Wei W, Li J, Ji L, Ge J. Aberrant Expression of MicroRNA-15a and MicroRNA-16 Synergistically Associates with Tumor Progression and Prognosis in Patients with Colorectal Cancer. Gastroenterol Res Pract. 2014;2014:8.
Tafsiri E, Darbouy M, Shadmehr M, Zagryazhskaya A, Alizadeh J, Karimipoor M. Expression of miRNAs in non-small-cell lung carcinomas and their association with clinicopathological features. Tumor Biol. 2014;36(3):1603-1612.
Renjie W, Haiqian L. MiR-132, miR-15a and miR-16 synergistically inhibit pituitary tumor cell proliferation, invasion and migration by targeting Sox5. Cancer Lett. 2015;356(2):568–78.
Kodahl AR, Lyng MB, Binder H, Cold S, Gravgaard K, Knoop AS, et al. Novel circulating microRNA signature as a potential non-invasive multi-marker test in ER-positive early-stage breast cancer: A case control study. Molecular Oncology. 2014;8(5):874–83.
Shinden Y, Akiyoshi S, Ueo H, Nambara S, Saito T, Komatsu H, et al. Diminished Expression of MiR-15a Is an Independent Prognostic Marker for Breast Cancer Cases. Anticancer Res. 2015;35(1):123–7.
Wang W, Liu L, Li G, Chen Y, Li C, Jin D, et al. Combined Serum CA19-9 and miR-27a-3p in Peripheral Blood Mononuclear Cells to Diagnose Pancreatic Cancer. Cancer Prev Res. 2013;6(4):331–8.
Xu W, Liu M, Peng X, Zhou P, Zhou J, Xu K, et al. miR-24-3p and miR-27a-3p promote cell proliferation in glioma cells via cooperative regulation of MXI1. Int J Oncol. 2013;42(2):757–66.
Tang W, Zhu J, Su S, Wu W, Liu Q, Su F, et al. MiR-27 as a Prognostic Marker for Breast Cancer Progression and Patient Survival. PLoS ONE. 2012;7(12):e51702.
Jiang X, Du L, Wang L, Li J, Liu Y, Zheng G, et al. Serum microRNA expression signatures identified from genome-wide microRNA profiling serve as novel noninvasive biomarkers for diagnosis and recurrence of bladder cancer. Int J Cancer. 2015;136(4):854–62.
Peng WZ, Ma R, Wang F, Yu J, Liu ZB. Role of miR-191/425 cluster in tumorigenesis and diagnosis of gastric cancer. Int J Mol Sci. 2014;15(3):4031–48.
Rani S, Gately K, Crown J, O'Byrne K, O'Driscoll L. Global analysis of serum microRNAs as potential biomarkers for lung adenocarcinoma. Cancer Biol Ther. 2013;14(12):1104–12.
Raponi M, Dossey L, Jatkoe T, Wu X, Chen G, Fan H, et al. MicroRNA Classifiers for Predicting Prognosis of Squamous Cell Lung Cancer. Cancer Res. 2009;69(14):5776–83.
Lee YS, Lim YS, Lee J, Wang S, Park H, Kim SY, et al. Differential expression levels of plasma-derived miR-146b and miR-155 in papillary thyroid cancer. Oral Oncol. 2015;51(1):77–83.
Walter BA, Valera VA, Pinto PA, Merino MJ. Comprehensive microRNA Profiling of Prostate Cancer. Journal of Cancer. 2013;4(5):350–7.
Garcia AI, Buisson M, Bertrand P, Rimokh R, Rouleau E, Lopez BS, et al. Down-regulation of BRCA1 expression by miR-146a and miR-146b-5p in triple negative sporadic breast cancers. EMBO Mol Med. 2011;3(5):279–90.
Kim BH, Hong SW, Kim A, Choi SH, Yoon SO. Prognostic implications for high expression of oncogenic microRNAs in advanced gastric carcinoma. J Surg Oncol. 2013;107(5):505–10.
Teixeira AL, Ferreira M, Silva J, Gomes M, Dias F, Santos JI, et al. Higher circulating expression levels of miR-221 associated with poor overall survival in renal cell carcinoma patients. Tumour Biol. 2014;35(5):4057–66.
Li J, Wang Y, Yu W, Chen J, Luo J. Expression of serum miR-221 in human hepatocellular carcinoma and its prognostic significance. Biochem Biophys Res Commun. 2011;406(1):70–3.
Falkenberg N, Anastasov N, Rappl K, Braselmann H, Auer G, Walch A, et al. MiR-221/-222 differentiate prognostic groups in advanced breast cancers and influence cell invasion. Br J Cancer. 2013;109(10):2714–23.
Cai J, Guan H, Fang L, Yang Y, Zhu X, Yuan J, et al. MicroRNA-374a activates Wnt/Î2-catenin signaling to promote breast cancer metastasis. J Clin Invest. 2012;123(2):566–79.
Rothe F, Ignatiadis M, Chaboteaux C, Haibe-Kains B, Kheddoumi N, Majjaj S, et al. Global microRNA expression profiling identifies MiR-210 associated with tumor proliferation, invasion and poor clinical outcome in breast cancer. PLoS ONE. 2011;6(6):e20980.
Hong L, Yang J, Han Y, Lu Q, Cao J, Syed L. High expression of miR-210 predicts poor survival in patients with breast cancer: A meta-analysis. Gene. 2012;507(2):135–8.
Yang G, Han D, Chen X, Zhang D, Wang L, Shi C, et al. MiR-196a exerts its oncogenic effect in glioblastoma multiforme by inhibition of IkBα both in vitro and in vivo. Neuro-Oncology. 2014;16(5):652–61.
Yan W, Li R, Liu Y, Yang P, Wang Z, Zhang C, et al. MicroRNA expression patterns in the malignant progression of gliomas and a 5-microRNA signature for prognosis. Oncotarget. 2014;5(24):12908–15.
Suh Y, Raulf N, Gäken J, Lawler K, Urbano TG, Bullenkamp J, et al. MicroRNA-196a promotes an oncogenic effect in head and neck cancer cells by suppressing annexin A1 and enhancing radioresistance. Int J Cancer 2015 01/01:n/a-n/a.
Xu X, Wang W, Su N, Zhu X, Yao J, Gao W, et al. miR-374a promotes cell proliferation, migration and invasion by targeting SRCIN1 in gastric cancer. FEBS Lett. 2015;589(3):407–13.
Mu YP, Tang S, Sun WJ, Gao WM, Wang M, Su XL. Association of miR-193b down-regulation and miR-196a up-regulation with clinicopathological features and prognosis in gastric cancer. Asian Pac J Cancer Prev. 2014;15(20):8893–900.
Wu W, Lin Z, Zhuang Z, Liang X. Expression profile of mammalian microRNAs in endometrioid adenocarcinoma. Eur J Cancer Prev. 2009;18(1):50–5.
Li J, Kong F, Wu K, Song K, He J, Sun W. miR-193b directly targets STMN1 and uPA genes and suppresses tumor growth and metastasis in pancreatic cancer. Mol Med Rep. 2014;10(5):2613–20.
Hummel R, Sie C, Watson DI, Wang T, Ansar A, Michael MZ, et al. MicroRNA signatures in chemotherapy resistant esophageal cancer cell lines. World J Gastroenterol. 2014;20(40):14904–12.
Li X, Yan P, Shao Z. Downregulation of miR-193b contributes to enhance urokinase-type plasminogen activator (uPA) expression and tumor progression and invasion in human breast cancer. Oncogene. 2009;28(44):3937–48.
Yu L, Tumati V, Tseng S, Hsu F, Kim DN, Hong D, et al. DAB2IP Regulates Autophagy in Prostate Cancer in Response to Combined Treatment of Radiation and a DNA-PKcs Inhibitor. Neoplasia. 2012;14(12):1203–12.
Shen Y, Kong Z, Wan F, Wang H, Bian X, Gan H, et al. Downregulation of DAB2IP results in cell proliferation and invasion and contributes to unfavorable outcomes in bladder cancer. Cancer Sci. 2014;105(6):704–12.
de Haro M, Al-Ramahi I, Jones KR, Holth JK, Timchenko LT, Botas J. Smaug/SAMD4A Restores Translational Activity of CUGBP1 and Suppresses CUG-Induced Myopathy. PLoS Genet. 2013;9(4):e1003445.
Pavon-Eternod M, Gomes S, Rosner MR, Pan T. Overexpression of initiator methionine tRNA leads to global reprogramming of tRNA expression and increased proliferation in human epithelial cells. RNA. 2013;19(4):461–6.
Chen L, Han L, Wei J, Zhang K, Shi Z, Duan R, et al. SNORD76, a box C/D snoRNA, acts as a tumor suppressor in glioblastoma. Sci Rep. 2015;5:8588.
Yan H, Wu Q, Sun C, Ai L, Deng J, Zhang L, et al. piRNA-823 contributes to tumorigenesis by regulating de novo DNA methylation and angiogenesis in multiple myeloma. Leukemia. 2015;29(1):196–206.
Voduc KD, Cheang MC, Tyldesley S, Gelmon K, Nielsen TO, Kennecke H. Breast cancer subtypes and the risk of local and regional relapse. J Clin Oncol. 2010;28(10):1684–91.
Bernstein L, Lacey JV. Receptors, Associations, and Risk Factor Differences by Breast Cancer Subtypes: Positive or Negative? J Natl Cancer Inst. 2011;103(6):451–3.
Sapkota Y, Ghosh S, Lai R, Coe BP, Cass CE, Yasui Y, et al. Germline DNA Copy Number Aberrations Identified as Potential Prognostic Factors for Breast Cancer Recurrence. PLoS ONE. 2013;8(1):e53850.
Dobbin KK, Simon RM. Sample size planning for developing classifiers using high-dimensional DNA microarray data. Biostatistics. 2007;8(1):101–17.
Dobbin KK, Zhao Y, Simon RM. How Large a Training Set is Needed to Develop a Classifier for Microarray Data? Clin Cancer Res. 2008;14(1):108–14.
Kolbert CP, Feddersen RM, Rakhshan F, Grill DE, Simon G, Middha S, et al. Multi-Platform Analysis of MicroRNA Expression Measurements in RNA from Fresh Frozen and FFPE Tissues. PLoS ONE. 2013;8(1):e52517.
Langmead B, Trapnell C, Pop M, Salzberg SL. Ultrafast and memory-efficient alignment of short DNA sequences to the human genome. Genome Biol. 2009;10(3):R25.
Mortazavi A, Williams BA, McCue K, Schaeffer L, Wold B. Mapping and quantifying mammalian transcriptomes by RNA-Seq. Nat Methods. 2008;5(7):621–8.
Livak KJ, Schmittgen TD. Analysis of Relative Gene Expression Data Using Real-Time Quantitative PCR and the 2(−Delta Delta C(T)) Method. Methods. 2001;25(4):402–8.
da Huang W, Sherman BT, Lempicki RA. Systematic and integrative analysis of large gene lists using DAVID bioinformatics resources. Nat Protoc. 2009;4(1):44–57.
Acknowledgements
Funding was generously provided by Canadian Breast Cancer Foundation (CBCF)- Prairies/NWT Chapter (to SD). Breast cancer specimens were accessed from the provincial tumor bank funded by Alberta Cancer Foundation and CBCF, Alberta, Canada. We thank Jennifer Dufour and Mieke Heyns for technical assistance.
Author information
Authors and Affiliations
Corresponding author
Additional information
Competing interests
The authors declare that they have no competing interests.
Authors’ contributions
PK and SG performed statistical analysis; PK analysed all of the next generation sequencing data and AN provided support; OK, BW and DL conducted qRT-PCR experiments, analysis and their interpretations, JM and KG provided breast cancer gene expression data set, SD conceived the study, designed the experiments with PK, provided analysis and interpretations of the data and is the principal investigator of the project, and RB provided pathology support. Manuscript preparation was by PK and SD; all contributing authors reviewed the manuscript and provided edits and suggestions.
Additional files
Additional file 1: Figure S1.
Batch effects correction. Description: 104 tumor and 11 normal samples were sequenced in different batches. ANOVA model was used to capture the different sources of variation. All the factors having a mean F ratio above the mean F ratio of the error bar has to be corrected for (Figure S1a). Since normal and tumor tissues are sources of biological variation, the tissue factor was not corrected for and only batch (being a technical variation) was corrected for. The value of 0 for the factor batch in Figure S1b indicates that the data has been adjusted for batch effects (implemented in Partek Genomics Suite 6.6; see methods). Tissue = Normal and Tumor tissue; Batch = Different batches in which the samples were sequenced. (PDF 39 kb)
Additional file 2: Table S1.
Differentially expressed miRNAs. Description: miRNAs were profiled from apparently healthy normal (n = 11) reduction mammoplasty breast tissues and breast tumor tissues (n = 104). RNAs were filtered for low read counts (minimum 10 read counts in at least 90 % of the samples). Following batch effects correction, sample outlier removal and RPKM normalization, differentially expressed RNAs with fold change > 2.0 and a false discovery rate (FDR) < 0.05 were identified. (PDF 63 kb)
Additional file 3: Table S2.
Gene ontology terms and associated genes. The identified miRNAs significant for OS and RFS (n = 12) from both the approaches were interrogated for mRNA targets, followed by identification of Gene ontology terms. Eight out of the 12 miRNAs had targets involved in cell growth and development (p < 0.05). (PDF 102 kb)
Rights and permissions
Open Access This article is distributed under the terms of the Creative Commons Attribution 4.0 International License (http://creativecommons.org/licenses/by/4.0/), which permits unrestricted use, distribution, and reproduction in any medium, provided you give appropriate credit to the original author(s) and the source, provide a link to the Creative Commons license, and indicate if changes were made. The Creative Commons Public Domain Dedication waiver (http://creativecommons.org/publicdomain/zero/1.0/) applies to the data made available in this article, unless otherwise stated.
About this article

Cite this article
Krishnan, P., Ghosh, S., Wang, B. et al. Next generation sequencing profiling identifies miR-574-3p and miR-660-5p as potential novel prognostic markers for breast cancer. BMC Genomics 16, 735 (2015). https://doi.org/10.1186/s12864-015-1899-0
Received:
Accepted:
Published:
DOI: https://doi.org/10.1186/s12864-015-1899-0