
Abstract
This paper presents a digital model for the powder metallurgical (PM) production chain of high-performance sintered gears based on an integrated computational materials engineering (ICME) platform. Discrete and finite element methods (DEM and FEM) were combined to describe the macroscopic material response to the thermomechanical loads and process conditions during the entire production process. The microstructural evolution during the sintering process was predicted on the meso-scale using a Monte-Carlo Model. The effective elastic properties were determined by a homogenization method based on modelling a representative volume element (RVE). The results were subsequently used for the FE modelling of the heat treatment process. Through the development of multi-scale models, it was possible obtain characteristics of the microstructural features. The predicted hardness and residual stress distributions allowed the calculation of the tooth root load bearing capacity of the heat-treated sintered gears.
1 Introduction
The rise of digital technologies in the industrial production, the fourth industrial revolution, Industry 4.0, requires interdisciplinary software solutions to create a platform for a cross-domain collaboration among the product development, production and usage. The motivation to utilize digital solutions in the production confirms the proof of the concept of the integrated computational materials engineering (ICME) within the field of material science. ICME describes the relationship among the manufacturing history, microstructural evolutions and the component properties on different length and time scales in a holistic system. Thereby, the main focus of the ICME concept lies on developing multiscale material models that describe the material response to inhomogeneous thermal, mechanical and further relevant process conditions [1]. All decisions in product development, production and usage are based on the selection and understanding of materials. Hence, the use of ICME is essential for the optimizing manufacturing processes or the definition of alternative technologies in the modern production.
Powder metallurgy offers proven advantages as an alternative production route for conventional metal-forming technologies due to its high flexibility regarding the processes, materials, shapes and products [2]. One of the major applications of powder metallurgy is the production of sintered precision parts, used in automotive transmission. The increasing trends towards light weight applications, alternative (hybrid-) drivetrain systems and downsizing of combustion engines motivate the use of sintered gears in highly loaded applications [3]. Studies have shown a reduction in the use of materials by approx. 50% and decreasing the energy consumption by approx. 10% in the entire production chain of sintered gears [4]. Furthermore, higher flexibility in shape optimization and a better noise-vibration-harshness behaviour are other potential advantages of the PM route [3]. However, sintered gears generally show lower strengths due to the remaining porosity after sintering, which severely hinders their applications in automotive transmissions [5]. To improve the load bearing capacity, several techniques were suggested to densify highly loaded sintered gears at the functional surface [6]. Surface densified and heat-treated sintered gears can achieve a tooth flank load bearing capacity that is comparable to that of conventional gears at the flank. However, the tooth root bearing capacity still needs to be improved [5, 7].
2 Process Chain
In powder metallurgy (PM), metallic powders are processed into semi-finished products and components such as high-strength sintered gears. The main process steps are the production and preparation e.g. by mixing a metal powder, the shaping mostly by mechanical pressing, sintering and, if necessary, a mechanical and/or thermal post-treatment as well as the final hard finishing, see Figure 1. While the shape of the later component is largely predetermined in the forming process, consolidation to a solid material takes place during sintering, which is understood as a heat treatment below the melting temperature. Powder properties, shaping process and sintering parameters determine, in addition to the precision of the component, the porosity and grain size of the material. In particular, the mechanical properties can be specifically adjusted by subsequent mechanical densification and heat treatment. Material defects, which mainly affect fatigue strength and fracture toughness and thus the load-bearing capacity of the components, can be created, modified or even eliminated in each of the manufacturing steps.

Schematic representation of the entire PM process chain of high strength sintered gears
A typical material for sintered gears is the water-atomized iron powder, pre-alloyed with 0.85 wt.% molybdenum and known as Astaloy 85 Mo. A lubricant is added to the powder to improve the compatibility and reduce the friction in the press die. Graphite is added to increase the hardenability. The relative density of sintered gears is typically about 90–95% without further densification [8]. During sintering, under the influence of temperature and time, the lubricant is expelled from the green compact and the strength is increased through diffusion processes. To achieve precision production of sintered gears, process parameters are adjusted to minimize the sintering shrinkage [9]. The cold rolling process is an industrially widespread process for densifying the surface zone to increase the load-bearing capacity of sintered gears [4, 6, 7, 10]. After cold rolling, the heat treatment is carried out by case hardening. Figure 2 shows the microstructure of a tooth characterized by local pores and a density gradient (part a) as well as a transition from the martensitic edge to the bainitic core (part b). During carburizing of PM parts, the existing porosity can lead to undesired case hardening depths or carbide precipitations, which could impair the load-bearing capacity of the gear. In addition to porosity, hardness and residual stresses after the heat treatment are decisive factors influencing the gear performance. According to DIN 3979 [11], the main types of damage to gears are tooth breakage, pitting, scuffing and wear. In this work, only the tooth root load bearing capacity is considered. The fatigue fracture of the tooth root usually initiates on the tensile stresses side in the area of the contact point of the 30° tangent to the tooth root rounding, see Figure 2 (part c). The load bearing capacity is determined by the material selection [12, 13], tooth root geometry, manufacturing history [14, 15] as well as the component size [16].

Cross section of a case-hardened sintered gear: a unetched teeth—porosity, b etched teeth—hardened microstructure, c 30°-tangent—high bending stresses
To prove the validity of the ICME-approach, geometry, process parameters and gear testing results were adopted from Ref. [17]. A spur gear with a modulus of 2 mm, a pressure angle of 20° and 27 teeth is produced by pressing Astaloy 85 Mo powder mixed with graphite, sintering at 1120 °C for 20 min, surface densification by cold rolling, case hardening by gas carburizing and quenching, tempering at 200 °C for 2 h and finishing by grinding. The initial carbon content and density were 0.25 wt.% and 7.1 g/cm3 after sintering, respectively. More details about the geometry and process parameters are given in Ref. [17].
3 ICME approach
The modelling approach comprises different methods that are applied individually to the corresponding process step and provide input data for the subsequent model. In each step, the “technological” side of the process is modelled by defining simple boundary conditions. The main focus of the work is on the development of a comprehensive model to quantitatively describe the material response during manufacturing. The process of die filling and pressing is modelled by means of the discrete element method (DEM) in the software LIGGGHTS-PUBLIC (DCS Computing GmbH). The result is the density of the green part on the macroscale. The macroscale sintering simulation is performed in the commercial finite element (FE) software ABAQUS and describes the density and shape of the sintered gear, considering the possible sintering shrinkage. The kinetic Monte Carlo (KMC) method is used to describe the diffusion process during sintering and the resulting morphology of the pores on a mesoscale, which provides the input information for the generation of a representative volume element (RVE) to obtain the effective elastic properties for the continuum mechanical modelling of the heat treatment process in ABAQUS.
The heat treatment simulation describes the microstructure evolution, hardness and residual stresses. The density profile after cold rolling is determined by image analysis based on experimental results in Refs. [5] and [17]. Density, hardness and residual stresses are input data for the analytical calculation of the tooth root load bearing capacity.
3.1 Modelling of the Die Filling and Powder Compaction
Since the die filling and powder compaction process is based on a granular system and each particle in this system moves independently, it is difficult to predict the behaviour of the granular system using continuum mechanical models. In this context, the discrete approach developed for numerical modelling of granular materials at particle scale has become a powerful and reliable tool, which is generally referred to as discrete element method (DEM) [18, 19]. DEM is a particle method based on Newton’s laws of motion. Particles can move with six degrees of freedom (three for translational and three for rotational movement). The particles are defined as soft particles that can only undergo elastic deformation. The simulation of the contact between particles considers a cohesive force (\({F}_{ij}^{Coh}\)) in Eq. (1), which is calculated by contact model and cohesion model. Additionally, the external pressure and gravity (\({F}_{i}^{Grav}\)) are also considered [20]:
The Hertz–Mindlin model, as a widely used contact model, describes the normal interaction by a nonlinear relationship representing the elastic contact behaviour between particles. The contact of two particles, \(i\) and \(j\), is considered with radii \({R}_{i}\) and \({R}_{j}\). The elastic deformation is adapted by the Hertz-Mindlin model for the normal and tangential contact interactions. In addition, damping in the normal direction and friction in the tangential direction are introduced into the model. A schematic description is shown in Figure 3. When the distance \(d_{ij}\) between two particles is smaller than their contact distance \(R_{i}+ R_{j}\), the model is used to calculate the Hertz–Mindlin contact force \({F}_{ij}^{HM}\).
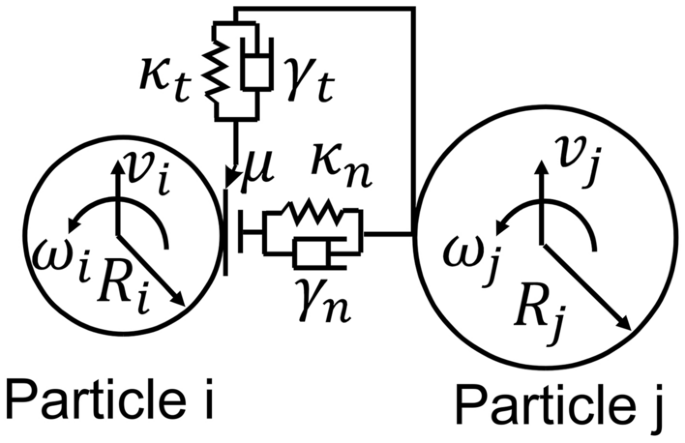
Scheme of the contact model
The first term is the normal force \({F}_{n.ij}^{HM}\) between the two particles, and the second term \({F}_{t.ij}^{HM}\) is the tangential force. The normal force has two terms, a spring force \({F}_{n,ij}^{HM,e}\) and a damping force \({F}_{n,ij}^{HM,d}\). The tangential force also has two terms: a shear force \({F}_{t,ij}^{HM,f}\) and a damping force \({F}_{t,ij}^{HM,d}\). \(\kappa\) and \(\gamma\) are the elastic constant and the viscoelastic constant, respectively. The lower limit of the tangential force \({F}_{t.ij}^{HM}\) is given by the Coulomb friction:
where \(\mu\) is the Coulomb coefficient of friction.
The simplified model of Johnson-Kendall-Roberts (SJKR) as the cohesion model adds an additional normal force contribution to the Hertz-Mindlin model. If two particles are in contact, the SJKR model adds an additional normal force \({F}_{ij}^{Coh}\), that tends to maintain contact. In addition to the contact forces, gravitational acceleration is also considered and the gravitational force \({F}_{i}^{Grav}\) is calculated.
Newton’s equations of motion are used to determine the new positions of the particles. the equations of the interaction forces and moments in a time step for particle \(i\) read as follows:
where \({m}_{i}\) is the mass, \({\ddot{x}}_{i}\) is the acceleration, \({I}_{i}\) is the Inertia tensor, \({\omega }_{i}\) is the angular velocity, \({\dot{\omega }}_{i}\) is the angular acceleration, and force \({F}_{i}^{sum}\) and moment \({t}_{i}\) are the sums of all forces and moments that act on the particle.
3.2 Multiscale Modelling of the Sintering Process
3.2.1 Continuum Mechanical Approach
FEM is used to simulate the sintering process in the ICME approach. Among different macroscopic models, the modified Abouaf model [21, 22], including the diffusion creep mechanism, is implemented to predict the densification process. The strain rate for sintering porous materials can be written as following in Eq. (6) [22]:
where \(A(T) =\text{exp}(-Q/RT)\) and \(N\) are the Dorn’s constant and the creep exponent of the fully dense material, respectively. \(Q\) is the activation energy of the particular creep mechanism, \(R\) is the gas constant, and \(T\) is the absolute temperature. \({\sigma }_{ij}^{\mathrm{^{\prime}}}\) is the deviatoric stress tensor and \({\delta }_{ij}\) is the Kronecker delta. \({\sigma }_{eq}\) is the equivalent stress of creep deformation for a porous body, which considers the volumetric changes under hydrostatic and sintering stresses:
where \({J}_{2}\) and \({I}_{1}\) are the second invariant of the deviatoric Cauchy stress tensor and the first invariant of Cauchy stress tensor. \({\sigma }_{s,A}\) is the sintering stress, which has been developed by many groups and reviewed in Ref. [23]. The sintering stress is derived from the change in the surface energy or from the chemical potential at the sintering neck. In this study, the sintering stress is calculated according Eq. (8) [23]:
where \({R}_{0}\) is the initial radius of the grain. \({\rho }_{0}\) and \(\rho\) are the relative density of the green body and the actual relative density, respectively. The rheological parameters \(c\left(\rho \right)\) and \(f\left(\rho \right)\) in Eqs. (9) and (10) are determined from results of sintering experiments presented in Ref. [24] (Table 1):
The constitutive equations, Eqs. (6)–(10), are implemented by means of the user-defined material (UMAT) subroutine. Temperature dependent thermophysical properties such as thermal conductivity, thermal expansion, specific heat and Young’s modulus are taken from Refs. [25,26,27]. In addition, the Young’s modulus was considered to be dependent on temperature and relative density. The density dependent values are calculated according to the equations from Ref. [8].
3.2.2 Kinetic Monte Carlo Model
Numerous methods to predict microstructural evolution during heat treatments such as sintering are reported in literature. Recent studies also present machine learning approaches to gather information from the microstructure depending on process parameters. In Ref. [28], artificial micrographs of additively manufactured alumina were successfully generated depending on laser power. In Ref. [29], machine learning was successfully used to predict the microstructure of steel, depending on the cooling conditions after a heat treatment. Both studies required a significant amount of SEM images as training data. Furthermore, stable approaches are still required to overcome the difficulties of extrapolation, which occur as soon as process parameters do not lie within the boundaries of the provided dataset [30]. Mesoscale simulation approaches can be considered as less sensitive towards such variations, as the physical mechanisms of the processes are incorporated within the algorithms. Moreover, they offer the possibility to investigate the time dependent evolution during the process instead of predicting the final state only. Kinetic Monte Carlo (KMC) models are often used to predict the microstructural evolution during sintering [31,32,33]. Although physical properties such as diffusivity are not necessarily required, the methods’ applicability to sintering processes has been successfully proven [34,35,36]. Apart from the capability to predict microstructural parameters, which are decisive for mechanical properties, KMC models are advantageous, as they can operate on comparably large scales, considering the neck formation between single particles as well as the interaction among the particles in a whole powder compact [37]. Unlike physically motivated approaches, the KMC method aims for the phenomenological description of the driving forces of sintering and grain growth. During the sintering process, grain coarsening as well as an increase in circularity of the pores can be observed, both leading to a reduction of interface area and consequently to a decrease of the internal energy. The KMC method predicts the microstructure by random modification of an RVE model. Experimentally obtained micrographs of green bodies are then incorporated in a KMC model implemented in Matlab by first assigning a random integer number \({q}_{i}\) to each grain, which lies in the range of the number of the grains \(Q\) within the respective image. In a subsequent conversion step, each pixel is replaced by the number \({q}_{i}\) of the respective grain, which is referred to as a ‘state’. In this way pores are described by \({q}_{i}=0\). The model is initialized by computing the interfacial energy between each lattice site \(i\) and each neighboring site \(j\), as follows [36]:
where \(\delta \left({q}_{i},{q}_{j}\right)\) is the Kronecker Delta and \({\gamma }_{i,j}\) the interfacial energy between \({q}_{i}\) and \({q}_{j}\), which is assumed to be \(1.93\) J/m2 at the surface and \(0.54\) J/m2 at a grain boundary [38]. The microstructural evolution is simulated by selecting a random site \(k\) within the domain of [1, \(n\)], where \(n\) corresponds to the number of sites that contribute to the total energy of the system. When a surface site is selected, its state is randomly exchanged with a pore site \(l\) in a predefined neighbourhood of \(k\) and then the resulting change of energy \(\Delta {E}_{kl}\) is determined. Grain growth is modelled in a similar way. An exchange of state is accepted depending on its transition probability \(P\), which is proposed as follows:
where \({E}_{A}\) is a temperature dependent variable accounting for the activation energy. A Monte Carlo step (MCS) consists of \(n\) such simulation trials. A common approach to derive a relationship between an MCS and a real time scale is to compare the experimental results with the numerical results, such as the grain size. However, a physical relationship can be derived from the mean square displacement \({x}^{2}\) performed within a MCS [39]
with the lattice size \(L\) and the surface diffusion coefficient \(D\) which is assumed as \({10}^{-10}\) m2/s as an average value of literature data [40,41,42].
3.3 Heat Treatment
The continuum mechanical modelling of the steel heat treatment process represents a multiphysics problem, involving coupling interactions between different physical fields—thermal, mechanical, metallurgical and further relevant fields [43]. The model applied in the present work is based on the early suggestions of Inoue [44] for a coupled modelling approach that comprises the calculation of heat transfer, phase transformations, transformation strains and the elastoplastic material response. Similar approaches, each with a different focus regarding the observed mechanisms, already exist in Refs. [45,46,47,48]. To model the case hardening process, carbon diffusion during the gas carburizing is considered as the first simulation step. In conventional carburizing of sintered components with open porosity, the case hardening depth is increased by gas penetration through the pore network under atmospheric pressure. Nusskern proposed an empirical approach in Ref. [46], which defines the activation energy of diffusion as a function of the density. Accordingly, a density dependent diffusion coefficient is defined here to model the gas carburizing of surface densified gears.
During quenching and tempering, phase transformations are triggered by local temperature changes. To calculate the temperature change during heat treatment, the Fourier’s heat conduction equation is solved by the ABAQUS solver. The required thermophysical material data, including the temperature and density dependent thermal conductivity and the specific heat, are adopted from Ref. [46], see Figure 4.

Thermophysical material data for the simulation of the case hardening: a thermal conductivity, b specific heat (according to Ref. [46])
The heat generation due to phase transformations is described in the user subroutine “HETVAL” according to Ref. [48]. In Ref. [46], it is reported that both carbon content and density have an influence on the kinetics of the transformations during quenching. The latter dependency was not confirmed in the dilatometric investigations of this work. For a continuum mechanical analysis of the heat treatment, most quenching models in the literature describe the microstructure quantitatively by calculating the overall phase transformation kinetics and the volume fractions of phases. Modified formulations and extensions of the Koistinen-Marburger equation [49] and the Johnson-Mehl-Avrami (JMA) equation [50,51,52] are suggested for the martensitic and the diffusion-controlled transformations, respectively. The transformation kinetic models and parameters are adopted from Ref. [46] to model the transformation of austenite (A) into martensite (M). Equation (14) describes the kinetics of the martensitic transformation:
where \({P}_{M}\) is the martensite fraction, \({P}_{A0}\) is the austenite fraction at the beginning of the transformation, \({c}_{c}\) is the carbon content in ma% and T is the temperature in K. The amount of the retained austenite is obtained according to the calculated martensite fraction at room temperature.
In the case of the diffusion-controlled transformation of austenite into bainite (B) an implicit differential form of the JMA equation is implemented as in Eq. (15), which is numerically integrated for the calculation of volume fractions. The transformation kinetic depends on the carbon content \({c}_{c}\) and the cooling rate \(\dot{T}\). The rate of the austenite transformation into bainite \({\dot{P}}_{B}\) changes with the amount of bainite \({P}_{B}\). The kinetic parameters \({\overline{P} }_{B}\) and \(\tau\) are the maximum volume fraction of bainite and the time coefficient, which are determined based on continuous quenching dilatometric experiments.
The overall effect of microstructure evolution during tempering, including the precipitation of transition carbides and the decrease of the martensite tetragonality, is modelled as a diffusion-controlled transformation based on tempering experiments. The phase transformation model is implemented in the user subroutine “USDFLD” and the volume fractions of the corresponding phases are defined as field variables that are used to determine phase dependent material properties.
The main constitutive law in the mechanical analysis describes the evolution of the strains and assumes that the total strain rate \({\dot{\varepsilon }}_{ij}^{t}\) is the sum of independent strain rate components:
where \({\dot{\varepsilon }}_{ij}^{el}\) is the elastic, \({\dot{\varepsilon }}_{ij}^{pl}\) is the plastic, \({\dot{\varepsilon }}_{ij}^{th}\) is the thermal and \({\dot{\varepsilon }}_{ij}^{tr}\) is the transformation induced strain rate due to the volume change and transformation plasticity. Elastic and plastic strains can be calculated by the ABAQUS solver itself. The Young’s modulus depends mostly on density and temperature. The yield stress shows a strong dependency on density, temperature, microstructural phases and carbon content. The corresponding values can be found in Ref. [46]. The overall yield stress of the multiphase microstructure is obtained using a nonlinear empirical mixture rule suggested by Leblond [53]. Thermal and transformation induced strains are modelled base on dilatometric investigations, describing the continuous cooling transformation behaviour of samples with different densities and carbon contents. In the user subroutine “UEXPAN”, the thermal and transformation strain components are defined. The thermal strain is determined based on the phase dependent thermal expansion of the phase mixture, which is obtained by a linear rule of mixture. Phase specific expansion coefficients \({\alpha }_{k}\) and \({\alpha }_{p}\) are adopted from Ref. [46]. The transformation strain component has two parts and is given by Eq. (17). The first part is the local isotropic strain, induced due to density and therefore volume changes as the result of microstructural evolutions during quenching and tempering. The terms \({\epsilon }_{k}\) and \({\epsilon }_{p}\) are the phase specific transformation strains of the product and the parent phases at room temperature with respect to the reference phase austenite. This formulation includes the transformation of austenite during quenching and the transformation of martensite into the tempered martensite (M′) during tempering. Obviously, the specific transformation strain of austenite itself \({\epsilon }_{A}\) as the parent phase during quenching is equal to zero. The second part is the transformation plasticity, that has a decisive impact on the development of residual stresses. The model to describe this effect is adopted from Ref. [54]. Transformation plasticity is caused by the deviatoric stress components \({S}_{ij}\) during the phase transformation and therefore is defined as an anisotropic strain, due to its directional dependency. The transformation plasticity factor \({K}_{k}\) was determined for the bainitic and martensitic transformations during quenching and for the tempering of martensite. The corresponding values were found to be 5 \(\times\) 10−5 MPa−1, 8 \(\times\) 10−5 MPa−1 and 2.5 \(\times\) 10−6 MPa−1, respectively. In Eq. (17), \({P}_{k}\) and \({\Delta P}_{k}\) are the volume fraction and the incremental change in the fraction of the product phase k:
Figure 5 summarizes the model parameters in Eqs. (15) and (17), determined by dilatometric experiments.

Besides the evolution of the microstructure and residual stresses, an empirical model is built up based on experiments to describe the overall hardness of the microstructure after case hardening, see Figure 6. Eq. (18) describes the linear rule of mixture to obtain the microstructure hardness. The hardness of bainite \({HV}_{B}\) and martensite \({HV}_{M}\) depend strongly on the carbon content. The model also covers the effect of the transformation temperature of bainite \({T}_{B}\) on the evolution of hardness.

Measurement of hardness on dilatometer samples with bainitic and martensitic microstructures
3.4 Effective Properties by RVE-modelling
Porosity is a source of heterogeneity in the microstructure, which ultimately affects the overall properties of the final product. In Ref. [46], effective thermophysical properties are defined as functions of density, mostly based on experimental investigations. Porosity has an impact on elastic properties, yield stress and thermal conductivity. Empirical investigations show that the mentioned properties can be estimated by a power law relation. Equation (19) gives an approximation of the Young’s modulus E (in MPa) depending on the density \(\rho\) (g/cm3) [8]:
In this work, an RVE modelling was performed to obtain the elastic properties depending on the porosity. Elastic properties have the highest impact on the residual stresses and the stress distribution under loading, which determines the highly loaded volume.
The first step is to investigate the actual microstructure and to extract the geometrical features such as grain size and distribution in a form of statistical distribution plots. Next, the obtained data set is inserted into the software Neper [55], which generates the synthetic RVE based on Voronoi tessellation technique. The periodicity of the geometry and its mesh are crucial features for simulating the behaviour of the surrounding material that consequently imposes a realistic reaction force on the boundaries of the RVE. In order to apply the periodic boundary conditions to the RVE, all the periodic nodes of the opposite faces must be identified to couple their displacement to the corresponding corner nodes. The coupling of the node displacements is done through a set of linear equations. For calculating each component of the orthotropic elastic stiffness tensor, six separate displacement loading conditions are applied to the RVE (three tensile tests in each principal axis and three simple shear tests).
Numerical homogenization of the effective elastic properties is based on volume averaging method so that the global stress \(\overline{\sigma }\) and strain \(\overline{\varepsilon }\) values are used for the calculation of the equivalent homogeneous Youngs’ modulus \(\overline{E }\) and Poisson’s ratio \({\overline{\nu }}_{xy}\):
The parameter \({V}_{RVE}\) in Eqs. (20) and (21) is the volume of the RVE. \(\sigma\) and \(\varepsilon\) are the calculated stress and strain values of the integration points.
3.5 Load Bearing Capacity
The calculation of the tooth root bearing capacity is based on the universal approach developed in Ref. [56] as a calculation method for designing cyclic loaded sintered parts with complex geometries. This approach assumes that sintered parts fail under cyclic loading by crack initiation at larger pores in highly stressed volume and applies the Weibull’s weakest link theory for volume defects. To develop a model regardless of the part geometry, fatigue tests were conducted on samples of different geometries and densities. Different loading modes (torsion, bending and axial loading) and stress ratios were investigated. To obtain the highly stressed volume and calculate the fatigue stress for a complex geometry, the first principal stress is evaluated in an elastic FE analysis. The criterion for the fatigue failure is based on the maximum normal stress valid for a proportional stress condition. Hajeck introduced the effect of the carbon content and residual stresses into the model and extended the method to predict the tooth root loading capacity of sintered gears [17]. In this work, the model is implemented with a minor modification by replacing the carbon content with the hardness, so that the possible effect of the cooling rate is included. With the modified model from Ref. [17], the maximum allowable stress amplitude \({\sigma }_{A,R0.05}\) is defined in Eq. (24) for a 50% survival probability under cyclic loading with a load ratio of 0.05. The parameters \(V_{ref}\), \({\rho }_{0}\) and \(HV_{0}\) are the reference volume, density and hardness: 1 mm3, 7.85 g/cm3 and 835 HV. The highly stressed volume \(V_{90}\) is defined as the material volume subjected to 90% or more of the maximum principal stress. Density \(\overline{\rho }\) and hardness \(\overline{HV}\) are average values within the volume \(V_{90}\). The model coefficients are summarized in Ref. [17] (Table 2).
4 Results
4.1 Simulation of Powder Compaction and Sintering
The DEM modelling technique was used to simulate the die filling and powder compaction process prior to sintering. Due to the irregularity of the shape of the water-atomized Astaloy 85 Mo powder, multi-sized particles in different size categories were created in the DEM model. The size distribution of the multi-sized particles was adjusted to represent the experimental values obtained from real powder particles in different size categories (Table 3).
To calibrate and validate the DEM model, die filling and powder compaction experiments were carried out by filling 9.5 g of powder into a cylindrical die (Figure 7(a)) with a diameter of D=9.5 mm. The filled powder was then pressed uniaxially with a pressure of 400 MPa by two punches from the top and bottom. To analyse the density distribution in the sample, the powder particles must be “frozen” in their positions after filling and compaction. Therefore, the cylindrical sample was cold embedded, ground, and polished. By applying a self-developed “Image Analysis” method [57], the micrographs of the samples were captured, stored, and sorted. The resolution and contrast of all the images were adjusted to distinguish between porosity and powder particles, i.e., black and white contrast respectively in Figure 7(c). The obtained images were binarized, and the relative density distribution was calculated by adding the number of white pixels and dividing by the total number of pixels in small grid windows.

a Position of the selected cross section of compacted samples in simulation model, b density distribution in the cross section after compaction simulation, c Microstructure of the cross section of the compacted sample recorded by light microscopy, d after “image analysis”
Figure 7(b) and (d) show the density distributions on cross sections of the compacted sample (image section marked by a blue rectangle in Figure 7(a)) determined by DEM and “Image Analysis”. Results show high-density regions in the centre of the sample after compaction, while relatively low densities were measured the positions near the die wall. The difference between the local density in the centre of the sample and that in the peripheral region is approximately 10%. The average compact densities of the whole powder compact, measured using Archimedes principle and simulated by DEM, are 89.1% and 88.9%, respectively, which is also in good agreement.
The sinter model was also validated on the cylindrical sample by comparing the simulated sinter shrinkage with the experimentally measured shrinkage from Ref. [24]. As shown in Figure 8, the simulated length change of the sample was plotted and compared with the experimentally measured length change from Ref. [24]. Under the given sintering condition, almost no densification was observed in the cylindrical sample, while the density distribution was evened out by grain boundary diffusion.

Length change of the cylindrical sample by experiment [24] and simulation
The validated DEM and FE models were used to predict the density distribution of the sintered gear from Ref. [17]. For the simulation, a 3D model was created, and the initial boundary conditions were defined. The geometry was reduced to a single tooth segment by defining symmetry planes as boundary conditions to reduce the element number and simulation time.
In the simulation of the die filling process, approximately 58000 single particles were used to image multi-sized particles. Figure 9(a)–(c) shows the simulated die filling by the free fall of particles from a powder reservoir into the die. After the die filling was completed, the powder was compacted to a height of 14 mm, as shown in Figure 9(c) and (d). According to the Voronoi method [58, 59], the initial local density was calculated and imported into the FE sinter model for each predefined element. The process parameters of pressing and sintering were kept as in the simulation of the cylindrical sample.

Die filling a–c and powder compaction d, e by DEM simulation; resulting density distribution in FE model f
Figure 10(a) shows the simulated final geometry and density distribution of a tooth in the PM gear. The local densities changed less than 2% in the entire geometry due to the low sinter shrinkage. A vertical section through a single tooth shows, as illustrated in Figure 10(b). This corresponds to the density distributions of the horizontal sections at different heights (0, 3.5, 7, 10.5 and 14 mm) of the tooth as shown in (Figure 10(c)–(g)). The low-density area i.e. the neutral zone in the centre of the powder compact observed after uniaxial compaction [60] was predicted by the DEM simulation of the powder compaction. As shown in Figure 9(f) and Figure 10(e), the low-density area was obtained at half height of the gear element.

Density distribution of the tooth a in b vertical cross section of a gear element and c–g in horizontal cross sections at different heights
4.2 Prediction of Microstructure by Kinetic Monte Carlo Simulation
To simulate the evolution of pore morphology and grain growth, the initial state of the microstructure was defined using a longitudinal micrograph of a compacted sample, which is shown in Figure 11(a). It can be noted that the powder particles are mostly aligned transversely to the direction of compaction, and each consists of several grains. Another sample was compacted under the same condition as the previous, then reduced in a hydrogen atmosphere and sintered under vacuum for 20 min at a temperature of 1120 °C. Further micrographs were taken to evaluate the microstructural evolution during sintering.

Cross section of samples: a etched powder compact, b etched sintered sample, c predicted microstructure of a sintered sample
Based on the micrographs of the compacted sample prior to sintering, an RVE-model was created to predict the microstructure development during sintering and the final microstructure by KMC method. The change of energy caused by a possible state exchange was calculated using Eq. (11), whereas it was accepted according to the function described in Eq. (12). The activation energy \({E}_{A}\) was assumed to be 2.5, which leads to a transition probability of less than one percent during the entire sintering process in the case of energy constancy. This considers the comparatively low sintering temperature. According to Eq. (13), the number of MCS that correspond to the sintering time is dependent on the mean square displacement, which was defined as the average displacement within a square region. Here, its width was selected as 13 pixels, which leads to \({x}^{2}=28.1\overline{6 }\) and consequently to an approximate number of MCS of 2900.
A micrograph of an etched sintered sample and the predicted microstructure of the sintered body are shown in Figure 11. To distinguish between the grains simulated with the KMC model, each grain was randomly assigned a colour, while the pores are shown in black. A qualitative comparison between the micrograph of the green body Figure 11(a) with the simulated and the sintered microstructure (Figure 11(b) and (c)) shows the formation of the sintering necks and an increase in circularity.
Considering the evolution of the grain size, a steady decrease of the growth rate during the sintering process is predicted, which is mainly due to the interaction with the pores. Pores that are sufficiently large, cause a pinning effect that limits the grain growth, whereas small pores are mostly isolated and located within the grains and have no significant impact on microstructural evolution. These observed effects are consistent with pore-grain-interactions reported in numerous studies [42]. The final grain size was estimated to be three times of the initial grain size, whereas only a slight increase of 30 percent could be observed in the experiments, Figure 11 (b). This discrepancy is mainly due to the neglection of the phase transformation. Therefore, quantitative information on grain growth is not assessible so far and the accuracy of this prediction could be further improved by considering the subsequent cooling stage.
In addition to the grain size, the shape factor \(F\) Eq. (25) is an important characteristic that is decisive for the microstructural evolution:
where, \(A\) is the projected area and \(B\) the perimeter of the pore [62]. The average shape factor \(\overline{F }\) is calculated by weighting the shape of each pore with its area. The numerically predicted value of 0.35 agrees well with the experimentally derived (pore) shape factors of 0.3 to 0.4, which were calculated on the basis of several micrographs. Using the shape factor as an example, bending fatigue strength can be described as a function of \(F\), as stated in Ref. [61].
4.3 Determination of the Effective Young’s Modulus
Based on the analysis of several micrographs with the software ImageJ the geometrical features of the pores were determined, and the initial overall size of the RVE was defined. Using the statistical data obtained, such as total porosity, pore size and distribution, the RVE can then be generated as shown in Figure 12.

Comparison of real and synthetic microstructures: a real microstructure of Astaloy 85 Mo (pores are shown in black), b synthetic RVE based on statistical analysis of the real microstructure, c histogram plot comparing the pore size and distribution real microstructure and synthetic RVE
The synthetic RVE were used for simulation studies under various loading conditions, e.g. tensile or shear load. The local notch effect of the pores leads to a heterogeneous strain distribution. Based on local stress and strain data, the Young’s modulus and Poisson’s ratio was then calculated for each specific load direction by homogenization. The stress distribution shown in Figure 13(a), corresponds to a sample with a porosity of 12.8% under uniaxial tensile test along the X-axis up to 5% total strain. The matrix was considered as a homogenous continuum with a Young’s modulus of 210 GPa and a Poisson’s ratio of 0.3. Figure 13(b) compares the simulated Young’s modulus with the power law approximation Eq. (19) and experiments of Ref. [46]. The RVE-fit in Figure 13(b) shows a power law approximation based on the calculated Young’s modulus, which is defined by an exponent equal to 2.8 instead of 3.5 in Eq. (19). It is shown that the literature data lie almost within the ±5% interval of the RVE-fit, which indicates a very good agreement for the properties of sintered steels. The RVE-based calculation of further properties such as the yield stress and the thermal conductivity will be carried out in later studies.

4.4 Hardness and Residual Stresses after Heat Treatment
For the simulation of the heat treatment process, the geometry of the sintering model was further reduced to the half width of the gear. Thermal boundary conditions were defined to model different stages of the heat treatment process. The carburizing temperature, time and the carbon potential were set to T = 940 °C, t = 35 min, and Cp= 0.85 wt.%, to model the gears investigated in Ref. [17] as the reference variant, Gref. To show the effect of the case hardening depth (CHD), a second variant, Gh, was modelled for a two-step carburizing process with Cp1= 1 wt.% for t1= 50 min and with Cp2= 0.85 wt.% for t2= 35 min. To describe the quenching process, a rapid cooling in an oil bath at 80°C and a subsequent air cooling to room temperature was modelled for both variants. The temperature dependent heat transfer coefficient was adopted from Ref. [62]. In the last simulation step, a tempering stage at 200 °C for 2 h was modelled. Based on the measurements in Ref. [17], the density profile in the surface area after cold rolling was defined.
As the functional surface is densified, carbon is transferred to the surface and diffusion starts from the surface to the bulk. However, side surfaces are not densified and thus, the carburizing gas penetrates into the pore network and leads to a higher carburizing and hardening depth. This effect is incorporated in the model by defining a density dependent diffusion coefficient. Figure 14(a) shows the simulated volume fraction of martensite. The martensitic region qualitatively corresponds to the carburized area (not shown in the Figure). According to the simulation, a retained austenite fraction of approximately 6% is given on the surface after quenching.

Results of the heat treatment simulation and validation: a martensite volume fraction, b hardness profile in the tooth root, tangential residual stress profiles in the tooth root c and in the tooth flank d
In Figure 14(b), the simulated hardness profiles along the path A-B in the tooth root are shown. In sintered parts, the macro-hardness is influenced by the porosity and cannot be used to evaluate the microstructural state. Therefore, the calculated hardness profile of the reference variant Gref is compared to the measured micro-hardness values. Micro-hardness measurements usually show a higher scatter, due to local microstructural inhomogeneities. In a phase mixture, measured values can vary between the hardness levels of the “hard” and the “soft” phases. The local hardness is calculated in the simulation according to Eq. (19) by a linear rule of mixture. In fact, the martensite and bainite hardness values, HVM and HVB, determine the upper and lower limits of the measured hardness. The comparison of the simulation and experiments shows a very good agreement regarding the CHD, i.e., the depth at which a hardness of 550 HV is given. However, the simulation model underestimates the hardness in higher depths. For a better estimation of the hardness profile, further investigations of the transformation kinetics should be performed for lower carbon contents, 0.25 wt.%<cc<0.5 wt.%. In the second variant, Gh, a CHD of approximately 0.5 mm is achieved.
Figure 10(c) and (d) compare the tangential residual stresses in the tooth root (A-B) and the tooth flank (C-D) depths. Simulation results show a very good quantitative agreement with the measured stresses for the reverence variant Gref. As expected for case hardened parts, compressive residual stresses arise in the carburized surface due to the transformation strains by the formation of martensite. The depth of the compressive stresses and the level of tensile stress increase with the CHD. Surface stresses are not affected by the CHD in tooth root, but in the flank surface; a decrease of the compressive residual stresses is caused by increasing the CHD. The load bearing capacity of the tooth flank is assessed by considering both surface and volume failure. Higher compressive residual stresses on the surface increase the resistance to pitting on the surface. On the other hand, shifting the maximum compressive stresses to the depth of the maximum Hertzian pressure due to the rolling contact can reduce the risk of volume failure. According to the results presented in Figure 14(d), it can be concluded that the CHD can have a decisive impact on the flank load bearing capacity. The tooth root load bearing capacity could be less sensitive to the CHD, since the highly stressed volume is located in the vicinity of the tooth root surface, where compressive stresses are not noticeably changed.
4.5 Calculation of the Load Bearing Capacity
For the assessment of the fatigue life of the tooth root according to the approach of Hajeck [17] a finite element analysis is required to obtain the highly stressed volume V90. For this purpose, a 3D-model was created by reducing the geometry to a 3-teeth segment with the half width of the gear. Symmetry planes and force direction were defined based on the plane bending pulsator tests carried out in Ref. [17], Figure 15(a). The tested gears were loaded with a minimum clamping force of 1 kN and the pulsating force was applied over four teeth. With linear elastic FE analysis, a highly stressed volume of V90 = 0.5924 mm3 was obtained for this geometry. Since the Young’s modulus depends on the density, the density profile of the cold rolled gear tooth was introduced into the model as obtained in Ref. [17]. The mean values of density and hardness were determined according to the results of the heat treatment simulation. The maximum allowable stress amplitude for a load ratio of R = 0.05 was calculated by Eq. (24). Considering the minimum clamping force of 1 kN and the maximum force amplitude of 3.36 kN for a 50% probability of failure, a load ratio of 0.13 was given. The mean stress \({\sigma }_{m}\) = 480 MPa was obtained by the FE analysis.

Determination of the highly stressed volume by tooth root bending: a pulsator test setup, b first principal stress in the tooth root, c visualization of the highly stressed zone
As shown in Figure 14(c) and (d), the case-hardened gears exhibit compressive residual stresses in the surface zone. Tangential residual stresses at the surface as calculated in the heat treatment simulation, were used to correct the mean stress and the load ratio for both variants Gref and Gh. The calculated stress amplitude \({\sigma }_{A, R0.05}\) was finally converted to the allowable stress amplitude for the obtained load ratios using the Haigh diagram in Ref. [17]. The calculated stress amplitudes and corrected load ratios R* are summarized in Table 4. Due to small changes in the surface hardness and residual stresses, an increase of only 2.2% of the stress amplitude was predicted by increasing the CHD from 0.28 mm to 0.5 mm. According to the simulation results it can be concluded that the tooth root load bearing capacity is almost insensitive to the CHD in relevant ranges. However, it should be noted that the calculation method proposed in Ref. [17] assumes a proportional stress state, which requires an initial residual stress-free condition. Furthermore, residual stresses are considered as scalar in tangential direction, neglecting a possible effect of the axial stresses. Therefore, a reasonable assessment of the load bearing capacity with the ICME approach requires the integration of the analytic calculation method in the FE simulation. The local equivalent stress must be obtained by a multiaxial failure hypothesis.
5 Potential of the Digital Model
Computer simulations were used in this study to understand the correlation between the process parameters and the tooth root load bearing capacity of the sintered gears. The developed ICME approach comprises process and material models across scales that cover physical interactions in the entire process chain and describes the microstructure evolutions depending on the manufacturing history. Based on the simulation of the microstructure and residual stresses, the tooth root load bearing capacity of the sintered gear can be calculated. The presented ICME approach can be used as a platform for the digitalizing of process design for the realizing of an agile production concept. The simulation tool is capable of quantitatively describing the correlation between manufacturing process, microstructure and mechanical properties of the component. Figure 16 shows schematically the vision for the integration of the ICME approach in the product development cycle. As illustrated in Figure 16 the greatest benefit of the ICME approach is the significant reduction of experimental investigations, which were previously required for process optimization mainly through “trial and error” to improve the component performance. Component testing can be replaced by laboratory material testing on small samples to determine material properties and model parameters. Furthermore, the simulation can provide results that that are not or only with difficulty obtained by experiments, such as a comprehensive measurement of the spatial residual stress state in the entire component.

Schematic representation of the development cycle including the ICME approach as a digital design tool
6 Summary and Outlook
The ICME approach presented in this paper covers most of the relevant process steps in the powder metallurgical manufacturing of sintered gears, including die filling, powder compaction, sintering, and heat treatment. The approach allows the prediction of key properties and parameters to determine the gear performance on the basis of the load bearing capacity of the tooth root. To combine the advantages of macroscopic and mesoscopic approaches, the DEM, KMC and homogenization methods were used at the mesoscopic scale to predict the pore morphology and the elastic properties of the porous material. On the component scale, the continuum modelling of sintering and heat treatment have achieved the aim of accurately predicting the density distribution, hardness and residual stresses by integrating results of mesoscopic simulations.
The simulation methods used and results obtained are summarized as follows:
-
The simulation with coupled DEM and FE modelling was used to calculate the powder density distribution after the die filling and powder compaction process and to predict the densification during the sintering process. Multi-sized particle models were implemented in the DEM modelling to consider the influences of powder morphology and size distribution on the initial density distribution after die filling and compaction. The simulation results of the density distribution in the cylindrical sample correspond well with the experimental measurements, which demonstrates the effectiveness of this approach in the sintering simulation.
-
The KMC model provides insights into the microstructural evolution during sintering. Although the modelled pore morphology and the shape factor \(F\) agree well with experimental data, further investigations are necessary to analyse the influence of sintering temperature in more detail and to derive a functional description of the dependence of the activation energy \({E}_{A}\) on the sintering temperature. In addition, an accurate measurement of the surface diffusion coefficient \(D\) is necessary to correctly estimate the number of MCS. Furthermore, extending the model to a continuous description of the entire heat treatment process, which includes phase transformation during cooling, would provide the possibility to fully describe the microstructural evolution.
-
To determine the influence of porosity in sintered parts on the mechanical properties of the material, the real microstructure was analysed regarding shape and distribution of the pores. Based on the collected statistical microstructural properties, a synthetic RVE was created. The impact of the porosity on effective elastic properties was modelled with an FE-based homogenization technique. The predicted Young’s modulus agrees well with experimental findings from literature. The influence of porosity on other effective properties such as heat conductivity and nonlinear mechanical properties is being investigated in ongoing studies.
-
The FE modelling of the heat treatment process covers the thermomechanical-metallurgical interactions. Carbon diffusion is modelled considering the effect of porosity during gas carburizing. Depending on the carbon content, local phase transformations and the associated volume change due to quenching are described to calculate the development of hardness and internal stresses. The tempering stage is modelled to predict the residual stresses after relaxation of hardening stresses. The predicted hardness and tangential residual stresses are in good agreement with experimental results from literature. The simulation model predicts compressive residual stresses in the surface zone and tensile residual stresses in the bulk. Predicted stress patterns indicate that the depth at which compressive stresses exists and the level of maximum tensile stresses increase with CHD. Surface stresses are affected by the CHD only in the tooth flank.
-
Hardness and residual stresses are input parameters for the analytical assessment of the tooth root load bearing capacity. The highly stressed volume is obtained by an elastic FE analysis, according to the plane bending pulsator tests from literature. The predicted residual stress state is considered as a scalar value in tangential direction and used to correct the applied mean stress. Due to small changes in the surface residual stresses, no significant influence on the tooth root load bearing capacity is expected by increasing CHD. The model assumes, that the subsurface porous material does not fail before the densified surface. The analytic calculation method cannot be used to predict the tooth flank load bearing capacity. The reason is that the basic assumption of proportional stresses under cyclic loading, is not valid for rolling contact conditions and the presence of considerable residual stresses. The future work would be to fully integrate the fatigue assessment into the continuum mechanical approach as a subsequent step of the heat treatment simulation. The numerical assessment of the fatigue life should be performed on the basis of valid failure hypotheses for non-proportional stress states for both the tooth root and tooth flank.
Availability of data and materials
The datasets used and/or analysed during the current study are available from the corresponding author on reasonable request.
References
J Allison, D Backman, L Christodoulou. Integrated computational materials engineering: A new paradigm for the global materials profession. JOM, 2006, 58(11): 25–27.
H Danninger. What will be the future of powder metallurgy? Powder Metallurgy Progress, 2018, 18(2): 70–79.
B Leupold, V Janzen, G Kotthoff, et al. Validation approach of PM gears for eDrive applications. International Conference on Gears 2017, VDI Verlag, Düsseldorf, 2017, 2: 119–131.
V Kruzhanov, V Arnhold. Energy consumption in powder metallurgical manufacturing. Powder Metallurgy, 2012, 55(1): 14–21.
E Gräser, M Hajeck, A Bezold, et al. Optimized density profiles for powder metallurgical gears. Production Engineering, 2014, 8(4): 461–468.
G A Kotthoff. Neue Verfahren zur Tragfähigkeitssteigerung von gesinterten Zahnrädern. Shaker, Aachen, 2003. (in German)
T Frech, P Scholzen, P Schäflein, et al. Design for PM challenges and opportunities for powder metal components in transmission technology. Procedia CIRP, 2018, 70: 186–191.
P Beiss. Pulvermetallurgische Fertigungstechnik. 2nd ed. Springer-Verlag, New York, 2013.
H Altena, H Danninger. Wärmebehandlung von Sinterstahl-Präzisionsteilen: II. Prozess- und Anlagentechnik. BHM Berg- und Hüttenmännische Monatshefte, 2005, 150(5): 170–175.
P Kauffmann. Walzen pulvermetallurgisch hergestellter Zahnräder. Apprimus, Aachen, 2013. (in German)
Norm. Zahnschäden an Zahnradgetrieben Bezeichnung. Merkmale, Ursachen, Beuth, Berlin, 1979.
J Sauter, I Schmidt, M Schulz. Einflussgrössen auf die Leistungs-fähigkeit einsatzgehärteter Zahnräder. Traitement Thermique (Paris), 1992, 252: 53–62.
D V Doane. Carburized steel-update on a mature composite. Journal of Heat Treating, 1990, 8(1): 33–53.
K Feltkamp. Untersuchungen über den Einfluß von Fertigungsfehlern und Zahnfußausrundungen auf die Zahnfußbeanspruchung und die Tragfähigkeit gehärteter Stirnräder. Rheinisch-Westfälische Technische Hochschule Aachen, 1967.
D Zuber. Fußtragfähigkeit einsatzgehärteter Zahnräder unter Berücksichtigung lokaler Materialeigenschaften. Shaker, Aachen, 2008. (in German)
H Strasser. Einflüsse von Verzahnungsgeometrie, Werkstoff und Wärmebehandlung auf die Zahnfußtragfähigkeit. München, 1984. (in German)
M Hajeck. Zahnfußtragfähigkeit pulvermetallurgisch hergestellter Zahnräder. Aachen, 2017. (in German)
P A Cundall, O D L Starck. Discrete numerical model for granular assemblies. Geotechnique, 1979, 29(1): 47–65.
T Pöschel, T Schwager. Computational granular dynamics. Springer-Verlag, Berlin/Heidelberg, 2005.
S Luding. Introduction to discrete element methods: Basic of contact force models and how to perform the micro-macro transition to continuum theory. European Journal of Environmental and Civil Engineering, 2008, 12(7–8): 785–826.
M Abouaf, J L Chenot, G Raisson, et al. Finite element simulation of hot isostatic pressing of metal powders. International Journal for Numerical Methods in Engineering, 1988, 25(1): 191–212.
C van Nguyen, S K Sistla, S van Kempen, et al. A comparative study of different sintering models for Al2O3. Journal of the Ceramic Society of Japan, 2016, 124(4): 301–312.
K Shinagawa. Micromechanical modelling of viscous sintering and a constitutive equation with sintering stress. Computational Materials Science, 1999, 13(4): 276–285.
M Selecka, V Simkulet. Mechanical properties of Fe-0,85Mo-Mn-C steels. Powder Metallurgy World Congress and Exhibition, Vienna, Austria, 2004.
E Rabald. Thermal properties of thirteen metals. ASTM Special Technical Publication Nr. 227, 29 S. American Society for Testing Materials, Philadelphia, 1958.
P D Desai. Thermodynamic properties of iron and silicon. Journal of Physical and Chemical Reference Data, 1986, 15(3): 967–983.
J A Rayne, B S Chandrasekhar. Elastic constants of iron from 4.2 to 300K. Physical Review, 1961, 122(6): 1714–1716.
J Tang, X Geng, D Li, et al. Machine learning-based microstructure prediction during laser sintering of alumina: A conditional generative approach. Scientific Reports, 2021, 11(1): 1–10.
A Iyer, B Dey, A Dasgupta, et al. A conditional generative model for predicting material microstructures from processing methods, 2019.
M McCartney, M Haeringer, W Polifke. Comparison of machine learning algorithms in the interpolation and extrapolation of flame describing functions. Journal of Engineering for Gas Turbines and Power, 2020, 142(6).
F Raether, G Seifert. Modeling inherently homogeneous sintering processes. Advanced Theory and Simulations, 2018, 1(5): 1800022.
E A Olevsky, V Tikare, T Garino. Multi-scale study of sintering: A review. Journal of the American Ceramic Society, 2006, 89(6): 1914–1922.
M R Dudek, J-F Gouyet, M Kolb. Q+1 state Potts model of late stage sintering. Surface Science, 1998, 401(2): 220–226.
S Hara, A Ohi, N Shikazono. Sintering analysis of sub-micron-sized nickel powders: Kinetic Monte Carlo simulation verified by FIB–SEM reconstruction. Journal of Power Sources, 2015, 276: 105–112.
Markus W Reiterer, Kevin G Ewsuk. An analysis of four different approaches to predict and control sintering. Journal of the American Ceramic Society, 2009, 92(7): 1419–1427.
Y Zhang, X Xiao, J Zhang. Kinetic Monte Carlo simulation of sintering behavior of additively manufactured stainless steel powder particles using reconstructed microstructures from synchrotron X-ray microtomography. Results in Physics, 2019, 13: 102336.
C G Cardona, V Tikare, B R Patterson, et al. On sintering stress in complex powder compacts. Journal of the American Ceramic Society, 2012, 95(8): 2372–2382.
S I Prokofjev. Estimations of grain-boundary surface tension in elemental solids. Journal of Materials Science, 2017, 52(8): 4265–4277.
A Takahashi, N Soneda, M Kikuchi. Computer simulation of microstructure evolution of Fe-Cu alloy during thermal ageing. Key Engineering Materials, 2006, 306–308: 917–922.
D Blundell, M Reid, N Zapuskalov, et al. Measurements of the surface diffusion coefficient in iron-carbon alloys using focused ion beam milling and high temperature laser scanning confocal microscopy. Microscopy and Microanalysis, 2005, 11(S02).
E Seebauer. Estimating surface diffusion coefficients. Progress in Surface Science, 1995, 49(3): 265–330.
R M German. Sintering theory and practice. Wiley, New York, 1996.
C Simsir, Jon L Dosett, George E Totten. Modeling and simulation of steel heat treatment: Prediction of microstructure, distortion, residual stresses and cracking. ASM Handbook 4B, 2014, 2014: 409–466.
T Inoue, T Yamaguchi, Z Wang. Stresses and phase transformations occurring in quenching of carburized steel gear wheel. Materials Science and Technology, 1985, 1(10): 872–876.
A Diemar. Simulation des Einsatzhärtens und Abschätzung der Dauerfestigkeit einsatzgehärteter Bauteile, 2007.
P Nusskern. Prozesssimulation der Herstellung einsatzgehärteter pulvermetallurgischer Bauteile. KIT-Bibliothek, Karlsruhe, 2013. (in German).
C Şimşir, C H Gür. 3D FEM simulation of steel quenching and investigation of the effect of asymmetric geometry on residual stress distribution. Journal of Materials Processing Technology, 2008, 207(1–3): 211–221.
A Eser, C Broeckmann, C Simsir. Multiscale modeling of tempering of AISI H13 hot-work tool steel – Part 2: Coupling predicted mechanical properties with FEM simulations. Computational Materials Science, 2016, 113: 292–300.
D P Koistinen, R E Marburger. A general equation prescribing the extent of the austenite-martensite transformation in pure iron-carbon alloys and plain carbon steels. Acta Metallurgica, 1959, 7(1): 59–60.
M Avrami. Kinetics of phase change: I General theory. The Journal of Chemical Physics, 1939, 7(12): 1103–1112.
M Avrami. Kinetics of phase change. II Transformation‐time relations for random distribution of nuclei. The Journal of Chemical Physics, 1940, 8(2): 212–224.
M Avrami. Granulation, phase change, and microstructure kinetics of phase change III. The Journal of Chemical Physics, 1941, 9(2): 177–184.
J-B Leblond, J Devaux, J C Devaux. Mathematical modelling of transformation plasticity in steels I: Case of ideal-plastic phases. International Journal of Plasticity, 1989, 5(6): 551–572.
F D Fischer, Q P Sun, K Tanaka. Transformation-induced plasticity (TRIP). Applied Mechanics Reviews, 1996, 49(6): 317.
R Quey, P R Dawson, F Barbe. Large-scale 3D random polycrystals for the finite element method: Generation, meshing and remeshing. Computer Methods in Applied Mechanics and Engineering, 2011, 200(17): 1729–1745.
S Keusemann, M Hajeck, C Broeckmann, et al. Schwingfestigkeitsbewertung von Sinterstählen in Abhängigkeit von Dichte, Mittelspannung und hochbelastetem Volumen. Keramische Zeitschrift, 2015, 67(7): 387–398.
C van Nguyen, A Bezold, C Broeckmann. Anisotropic shrinkage during hip of encapsulated powder. Journal of Materials Processing Technology, 2015, 226: 134–145.
F Aurenhammer. Voronoi diagrams—A survey of a fundamental geometric data structure. ACM Computing Surveys, 1991, 23(3): 345–405.
Y Deng, A Kaletsch, A Bezold, et al. Precise prediction of near-net-shape HIP components through DEM and FEM simulation. Proceedings of 12th International Conference of Hot Isostatic Pressing, 2017.
M Vattur Sundaram, A Khodaee, M Andersson, et al. Experimental and finite element simulation study of capsule-free hot isostatic pressing of sintered gears. The International Journal of Advanced Manufacturing Technology, 2018, 99(5): 1725–1733.
P Beiss, M Dalgic. Structure property relationships in porous sintered steels. Materials Chemistry and Physics, 2001, 67(1–3): 37–42.
M Steinbacher, F Hoffmann. Abschlussbericht Forschungsvorhaben: Großprobe: Vergleichbarkeit von Couponproben und Großzahnrad beim Einsatzhärten, FVA, 2009.
Acknowledgements
Not applicable.
Funding
Supported by the German Research Foundation DFG (Project-ID: 390621612) within the Cluster of Excellence Inter-net of Production (IoP).
Author information
Authors and Affiliations
Contributions
All authors were involved in the writing of the manuscript and in the interpretation of the results. YD and OS performed the Modelling and simulation of pressing and sintering. SR generated RVE-models and carried out the RVE-based simulations. AR modelled the heat treatment process and calculated the tooth load bearing capacity. AB and CB were involved in the development of the methodology, provided resources and supervised the project. All authors read and approved the final manuscript.
Authors’ Information
Ali Rajaei absolved his master’s study in production technologies (mechanical engineering) at RWTH Aachen University, Germany, in 2013. He is currently the head of the heat treatment simulation group in the Institute for Materials Applications in Mechanical Engineering (IWM) at RWTH Aachen University, Germany. His research interests include the numeric simulation of heat treatment processes on macro- and meso-scales with the objective of understanding the material processes under thermomechanical loads and predicting the microstructure evolutions, residual stresses and properties of the components.
Yuanbin Deng received his master’s degree in materials engineering at RWTH Aachen University, Germany, in 2015 and works on simulation of powder metallurgical manufacturing processes in the Institute for Materials Applications in Mechanical Engineering (IWM) at RWTH Aachen University, Germany. He is currently the head of the Process Simulation group in the Powder Technology department of IWM. His research interests centre around the macroscopic modelling and simulation of sintering and hot isostatic pressing process, geometry optimization for near net shape manufacturing.
Oliver Schenk received his master’s degree in mechanical engineering at Wuppertal University, Germany in 2020 and works on simulation of powder metallurgical manufacturing processes in the Institute for Materials Applications in Mechanical Engineering (IWM) at RWTH Aachen University, Germany. His research interests include the numerical simulation of sintering processes on the mesoscale as well as the macroscale.
Soheil Rooein received his master of science degree in Materials Science and Simulation at the ICAMS Department of Ruhr-University Bochum (RUB) in 2019. The focus of his research during master studies was material modelling, micromechanics and RVE generation. Currently, he is working as a research assistant at the Institute for Materials Applications in Mechanical Engineering (IWM) of RWTH Aachen University, Germany. As a member of the heat treatment simulation group, his research interests center around the numerical modelling of heat treatment processes, prediction of residual stresses and estimation of effective properties based on microstructure modelling.
Alexander Bezold received his diploma certificate in Material Science at University of Erlangen-Nuremberg, Germany, in 1999. He is currently the deputy head the Institute for Materials Applications in Mechanical Engineering (IWM) at RWTH Aachen University, Germany.
Christoph Broeckmann worked with the Institute of Materials Science at Bochum until 2000 after finishing his studies in Mechanical Engineering at Ruhr-University Bochum, Germany, in 1990. He got his PhD in 1994 on a thesis on the fracture of carbide rich steels. As senior scientist he established a research group on creep related problems at Bochum University. In 2000 Christoph Broeckmann got his lecture qualification (habilitation) based on a work on creep of particle reinforced materials. In 2000 he moved to the machine factory Köppern GmbH &Co. KG in Hattingen where he first was responsible for material and design related research and development. Since 2003 he became managing director of “Köppern Entwicklungs GmbH” a subsidiary dedicated to the development, production and delivery of large, powder metallurgically produced wear parts. He joined RWTH Aachen University as a professor in 2008. Since 2009 he is head of the Institute for Materials Application in Mechanical Engineering.
Corresponding author
Ethics declarations
Competing Interests
The authors declare no competing financial interests.
Rights and permissions
Open Access This article is licensed under a Creative Commons Attribution 4.0 International License, which permits use, sharing, adaptation, distribution and reproduction in any medium or format, as long as you give appropriate credit to the original author(s) and the source, provide a link to the Creative Commons licence, and indicate if changes were made. The images or other third party material in this article are included in the article's Creative Commons licence, unless indicated otherwise in a credit line to the material. If material is not included in the article's Creative Commons licence and your intended use is not permitted by statutory regulation or exceeds the permitted use, you will need to obtain permission directly from the copyright holder. To view a copy of this licence, visit http://creativecommons.org/licenses/by/4.0/.
About this article

Cite this article
Rajaei, A., Deng, Y., Schenk, O. et al. Numerical Modelling of the Powder Metallurgical Manufacturing Chain of High Strength Sintered Gears. Chin. J. Mech. Eng. 34, 143 (2021). https://doi.org/10.1186/s10033-021-00646-4
Received:
Revised:
Accepted:
Published:
DOI: https://doi.org/10.1186/s10033-021-00646-4