
Abstract
Background
Synbiotics, probiotics or prebiotics are being added to infant formula to promote growth and development in infants. Previous reviews (2007 to 2011) on term infants given probiotics or prebiotics focused on prevention of allergic disease and food hypersensitivity. This review focused on growth and clinical outcomes in term infants fed only infant formula containing synbiotics, probiotics or prebiotics.
Methods
Cochrane methodology was followed using randomized controlled trials (RCTs) which compared term infant formula containing probiotics, prebiotics or synbiotics to conventional infant formula with / without placebo among healthy full term infants. The mean difference (MD) and corresponding 95% confidence intervals (CI) were reported for continuous outcomes, risk ratio (RR) and corresponding 95% CI for dichotomous outcomes. Where appropriate, meta-analysis was performed; heterogeneity was explored using subgroup and sensitivity analyses. If studies were too diverse a narrative synthesis was provided.
Results
Three synbiotic studies (N = 475), 10 probiotics studies (N = 933) and 12 prebiotics studies (N = 1563) were included. Synbiotics failed to significantly increase growth in boys and girls. Use of synbiotics increased stool frequency, had no impact on stool consistency, colic, spitting up / regurgitation, crying, restlessness or vomiting. Probiotics in formula also failed to have any significant effect on growth, stool frequency or consistency. Probiotics did not lower the incidence of diarrhoea, colic, spitting up / regurgitation, crying, restlessness or vomiting. Prebiotics in formula did increase weight gain but had no impact on length or head circumference gain. Prebiotics increased stool frequency but had no impact on stool consistency, the incidence of colic, spitting up / regurgitation, crying, restlessness or vomiting. There was no impact of prebiotics on the volume of formula tolerated, infections and gastrointestinal microflora. The quality of evidence was compromised by imprecision, inconsistency of results, use of different study preparations and publication bias.
Authors’ conclusions
There is not enough evidence to state that supplementation of term infant formula with synbiotics, probiotics or prebiotics does result in improved growth or clinical outcomes in term infants. There is no data available to establish if synbiotics are superior to probiotics or prebiotics.
Background
The first year of life is characterized by very rapid growth. Weight increases by 115%, body length 34% and head circumference 22% [1, 2]. Many full term infants lose weight after birth and take 8–10 days to regain it back. The average infant achieves a weight gain of approximately 1.1 to 1.2 kg/month during the first 6 months, slowing down to 0.4 to 0.5 kg/month during the second 6 months. Length increases by 3.5 to 3.9 cm/month during the first 4 months, slowing down to 1.8 cm/month at 6 month of age [1]. At birth average head circumference is 35 cm and increases by an estimated 12 cm during the first year of life to approximately 47 cm. A faltering head circumference has serious implications for neural growth, maturation and is diagnostic for possible problems of brain growth [2]. Monitoring growth (weight, length and head circumference) evaluates the overall health of the infant and determines adequacy of nutritional intake [1].
To promote optimum growth, development and decrease infections, probiotics, prebiotics are added to infant formula to promote an intestinal micro flora resembling that of breastfed infants [3]. The intestinal micro flora of breastfed infants have a greater concentration of bifidobacteria and fewer potentially pathogenic bacteria compared to formula fed infants. Probiotics are “live microorganisms” which when administered in adequate amounts confer a health benefit to the host [3]. The main probiotic organisms used worldwide belong to the genera Lactobacillus and Bifidobacteria and are found in the gastrointestinal micro flora [3, 4]. Probiotics are consumed in the form of fermented food, dairy products, infant and toddler formula. Prebiotics are non- digestible food ingredients that benefit the host by selectively stimulating the growth and/or activity of one or a limited number of bacteria in the colon and thereby improving the host’s health [4, 5]. The most widely studied prebiotics are inulin, fructooligosaccharide (FOS) and galactooligosaccharide (GOS) which are plant storage carbohydrates in vegetables, cereals and fruit. Fructooligosaccharide and inulin are added to different foods as fat and sugar replacements to improve texture or for their functional benefits [5–8].
Probiotics improve health in different ways [3, 9]. The health benefits conferred by probiotic bacteria are strain specific [3, 9]. Some strains increase phagocytic activity of peripheral blood leukocytes, others strains promote production of mucosal antibodies reducing the trans-mucosal transfer of antigens. This strengthens the mucosal barrier function [10–12]. Other probiotic strains increase cytokine production such as interleukin 6 (IL-6) [13]. In healthy people probiotics rarely cause disease. The risk of developing bacteraemia from ingested lactobacilli is less than 1 per 1 million users; risk of developing fungaemia (from Saccharomyces Boulardii) is less than1 per 5.6 million users [14–16]. In many studies on infants, C- reactive protein (CRP) and IL-6 have been used to diagnose the early onset of infection [17, 18]. CRP is an acute phase protein, blood levels begin to rise to 10 – 1000 fold from 1 ug/ml within 4–6 hours at the onset of an infective or inflammatory process. C- reactive protein has a relatively short half-life making it useful in monitoring infection, inflammation and response to treatment [19]. IL-6 is a pro-inflammatory cytokine which stimulates the production of acute phase proteins (such as CRP) [20]. It is readily detected in serum during inflammation and indicates the presence of infection [18, 19].
Adding prebiotics to formula stimulates the growth of beneficial bacteria (such as bifidobacteria, lactobacilli) in the gastrointestinal tract to levels found in breastfed infants [9, 21]. As these beneficial bacteria increase, they occupy more of the “microbiological niches” in the intestine excluding pathogens. This improves the gut mucosal barrier, prevents infections with enteric pathogens or trans-located gut bacteria [22, 23]. Prebiotics have a good safety record at levels found in existing food components. Flatulence or abdominal bloating is reported at doses greater than 20g / day. Abdominal cramps or diarrhoea are reported at doses greater than 50 g / day [23].
When probiotics and prebiotics are administered simultaneously, the combination is termed Synbiotics. The prebiotic in the synbiotic mixture improves the survival of the probiotic bacteria and stimulates the activity of the host’s endogenous bacteria [9, 21, 24, 25]. The superiority of synbiotics compared to either probiotics or prebiotics have not been demonstrated. No review has examined the impact of synbiotics on clinical outcomes in formula fed term infants. Recent systematic reviews (published from 2007 to 2011) on the use of probiotics or prebiotics in term infants have focused on prevention of allergic disease and food hypersensitivity [26, 27]. Reviews on children and adults focused on upper respiratory tract infections, antibiotic associated diarrhoea and acute infectious diarrhoea [28–30]. This review focused on full term infants given only infant formula with synbiotics, probiotics or prebiotics.
The Human Research Ethics Committee at the University of Stellenbosch, South Africa reviewed the protocol, ruled that all data to be collected for this review was from the public domain and was therefore exempt from ethical approval.
Objectives
The objectives of this systematic review were:
-
1)
To determine the effects of infant formula containing synbiotics, probiotics or prebiotics on clinical outcomes in full term infants.
-
2)
To explore if synbiotics are superior over probiotics or prebiotics.
Methods
Criteria for considering studies for this review
All randomized controlled trials (RCTs), irrespective of language, which compared the use of term infant formula containing synbiotics, probiotics or prebiotics to conventional infant formula with or without placebo amongst healthy full term infants (>37 weeks gestation or ≥ 2.5 kg birth weight, age: 0–12 months, with no disease, congenital abnormality, allergy or eczema) receiving formula feeds only. Studies published as abstracts were included if sufficient information could be obtained to assess study quality and obtain relevant study findings.
Types of outcome measures
Primary outcomes
Growth changes (assessed for entire study duration): weight gain (g/day), linear growth (cm/week, mm/month), head growth (cm/week, mm/month). Secondary outcomes: Tolerance to formula: Stool characteristics: frequency, consistency, diarrhoea; Gastrointestinal symptoms (incidence of colic, spitting up/ regurgitation, vomiting, crying), average formula intake (mls/day). Infections: frequency and type of infections, use of medication (antibiotic intake); Hospitalization: Number of days in hospital. Changes in GI microflora: Changes in colony forming units (cfu/g of stool) of bifidobacteria, lactobacillus post intervention, colony forming units (cfu/g of stool) of pathogens post intervention. Immune response: C- reactive protein levels (mg/dl), Interleukin 6 (IL-6) levels (mg/dl).
Search methods for identification of studies
A literature search regardless of language was conducted on electronic databases including The Cochrane CENTRAL Register for Controlled Trials (2010), EMBASE (1980+), Scopus (1990 present), EBSCO host (1960 to 2010), PUBMED / MEDLINE (1966 to 2010), OVID (1950 to 2010), SPORTDiscus (1960 to 2010), Web of Science (1970 to 2010), Science Direct (1950 to 2010), CINAHL (1981 to 2010), Science citation index (1970 to 2010), Latin American Caribbean Health Sciences literature (LILACS) (1965 to 2010), NLMGateway (1950–1966). RCTs published in non-English language journals were translated by independent translators who were familiar with the subject matter. The search strategy used to search PUBMED is shown below. This search strategy was modified to search other electronic databases.
(synbiotic* and probiotic* OR prebiotic*) AND (FOS or fructooligosaccharide or inulin or GOS or galactooligosaccharide) AND (infant formula* OR infant feeding OR formula OR formula milk) AND (infant* or baby or babies) NOT (preterm or premature or low birth weight babies or allergy or eczema) AND (randomized controlled trial* OR controlled clinical trial* Or random allocation*) Limits: Humans.
We also conducted a hand search on abstracts of major conference proceedings such as the Pediatric Academic Society meetings from 1990 (http://www.pas-meetings.org, http://www.abstracts2view.com), cross checked references cited in RCTs and in recent reviews (published from 2005 to 2009) for additional studies not identified by electronic searches and specialty journals which were not included in any database such as Pediatrika and Chinese Journal of Microecology.
To identify on-going and unpublished trials, we contacted experts in the field, manufacturers of infant formula containing probiotics and prebiotics, we searched web sites of companies that have conducted or were conducting RCTs on probiotics and prebiotics e.g. Pfizer (http://www.pfizerpro.com/clinicaltrials), Chris Hansen Laboratory (http://www.chr-hansen.com/research_development/documentation.html). We also searched prospective trial registries such as World Health Organization (WHO) International Clinical Trials Registry Platform Search Portal (http://www.who.int/trialsearch), Clinical Trials.gov register (http://www.clinicaltrials.gov), Current Controlled Trials metaRegister of Controlled Trials [mRCT] (http://www.controlled-trials.com/mrct) and http://www.clinicaltrialresults.org.
Selection of studies
One reviewer (MM) independently reviewed all abstracts, citations and identified potentially eligible studies. The full reports of eligible studies were retrieved by one reviewer (MM) and the pre-specified selection criteria applied independently by two reviewers (MM, ML) using a study eligibility form (Figure 1). If more than one publication of a study existed, all reports of the study were grouped together under one study name. Any disagreements between the reviewers were resolved through discussion. Unresolved disagreements were resolved by a third party. Trial authors were contacted if eligibility was unclear.

Study Eligibility form.
Assessment of quality of evidence
Two reviewers (MM, ML) independently assessed the risk of bias of included studies as described in the Cochrane Handbook for Systematic Reviews for Interventions according to the following 6 components: 1) allocation sequence generation; 2) allocation concealment; 3) blinding; 4) incomplete outcome data; 5) selective outcome reporting; and 6) other sources of bias [31]. Where necessary, trial authors were contacted for clarification on the methodology of their studies. Any disagreements regarding risk of bias were resolved through discussion between MM, ML and RB. The quality of evidence was assessed using guidelines from the Grading of Recommendations Assessment, Development and Evaluation Working Group (GRADE), http://www.gradeworkinggroup.org (accessed 2012-06-07).
Data extraction and management
Two reviewers (MM, ML) independently extracted data using a pretested data extraction form. The reviewers (MM, ML) cross checked data and resolved any differences through discussion. One reviewer (MM) entered the data in Review Manager (RevMan 5) and the other reviewers (AM, ML) validated the data. Trial authors were contacted for missing data or for clarification.
Data synthesis and management
Results for probiotic, prebiotic and synbiotics studies were analysed separately. No imputation measures for missing data were applied. Trial authors were contacted if there was missing data. Available case analysis was used where there was missing data. The potential impact of missing data on results is addressed in the discussion section.
Heterogeneity of the trials used in the review was assessed by visually inspecting the forest plots to detect overlapping confidence intervals and by performing a Chi2 test (p<0.1 was considered statistically significant because of the low statistical power of this test). An I-square test (I2) was also used to test for inconsistencies across studies. If the I2 exceeded 50% and visual inspection of the forest plot supported these results, this represented substantial heterogeneity. Since all of our meta-analyses had less than ten studies, the assessment of publication bias using funnel plots could not be done [31]. If the included studies were not clinically diverse and had similar outcome measures, a meta-analysis was carried out in Review Manager (RevMan 5) by two reviewers (AM, MM). The random effects meta-analysis model was applied to all meta-analyses since the studies were clinically heterogeneous in terms of different settings (countries), doses and strains of synbiotics, probiotics or type of prebiotics, different treatment durations, and other unforeseen factors. The inverse-variance method was used for continuous data and the Mantel-Haenszel method was used for dichotomous data. For continuous outcomes the mean difference (MD) and corresponding 95% confidence intervals (CI) were calculated. For dichotomous outcomes, the risk ratio (RR) and corresponding 95% CI were calculated. The source of statistical heterogeneity was explored using subgroup and sensitivity analyses. If studies were too diverse, no meta-analysis was conducted and a narrative synthesis was provided.
Results
Results of the search and description of studies
Electronic search of available databases yielded 142 citations. After reading titles and abstracts, duplicate reports were removed, 118 articles were screened and 55 articles were excluded. A hand search yielded 2 more articles. Potentially relevant full text reports were retrieved, reviewed for eligibility and a further 38 studies were excluded. One study was published in two other reports [32–34]. The three studies were considered as one study and are referred to as Moro 2006 [32]. Another study was also published in two reports; and is referred as Moro 2002 [35, 36]. Twenty five studies (3 synbiotic, 10 probiotic and 12 prebiotic studies) and three on-going studies were included in this review [21, 24, 25, 37–56]. The selection process is shown in Figure 2. Table 1 gives a list of 38 studies which were excluded for: use of breast milk or mixed feeds (12 studies), no use of probiotic or prebiotic (2 studies), being a cross over study, not RCT (5 studies), type of feed was unspecified (3 studies), different inclusion criteria or outcomes (12 studies), no data available for end of treatment period (1 study) and data presentation inappropriate for meta- analysis (3 studies) [57–94]. No eligible studies were excluded for failure to report the review’s pre-specified outcomes.

Process of study selection.
Included studies
Summary of the included synbiotics, probiotics, prebiotics, and on-going studies are shown in Tables 2 3, 4, 5. All studies were conducted on healthy infants and used standard infant formula.
Synbiotic studies: Three studies (N = 475) used various synbiotic (probiotic and prebiotic) combinations [21, 24, 25]. Two studies [21, 24] used a probiotic combination of Bifidobacterium longum BL999 with Lactobacillus rhamnosus; Bifidobacterium animalis ssp lactis with Lactobacillus paracasei. One study [25] used Bifidobacterium longum alone. Dosage varied from 1 × 10⁷ to 2 × 10⁷ cfu/g powder to 1.28 × 10⁸ to 2.5 × 10⁸ cfu/100 ml. The prebiotics used were a combination of 90% GOS 10% FOS [24, 25] or GOS alone [21]. The prebiotic doses ranged from 0.24 g to 0.4 g/100ml. Treatment duration varied from 4 months to 6 months. The synbiotic studies were conducted in France, Italy and Netherlands. None of the synbiotic studies reported data on volume of feed tolerated, hospitalization, changes in GI microflora and immune response.
Probiotic studies: Ten probiotic studies (N = 933) were included. One study [55] used a reduced protein infant formula and one study [50] used an acidified formula given to healthy infants born to HIV positive mothers. The most widely studied probiotics were Bifidobacterium lactis (BB-12) which was administered alone [40, 44, 46, 50–52]. Other probiotic strains used were Lactobacillus reuteri and Bifidobacterium bifidum. Doses ranged widely. For Bifidobacteria: 1.5 x 10⁶ to 3.85 x 10⁸ cfu/g powder and Lactobacillus: 1 x 10⁶ to 1 x 10⁸ cfu/g powder. Treatment duration varied from 14 days to 7 months. The probiotic studies were conducted in Australia (Adelaide), Belgium, Chile (Santiago), France, Israel (Beersheva), South Africa (Johannesburg) and USA (Iowa). None of the probiotic studies reported data on immune response.
Prebiotic studies: Twelve prebiotic studies (N = 1563) were included. The studied prebiotics were FOS [37], GOS [43, 47, 53, 54], acidic oligosaccharide [42] or a mixture of GOS and FOS [32, 35, 39, 41, 49]. Two studies used long chain FOS [32, 41]. One study used poly dextrose with GOS [56]. The doses ranged from 0.15 g to 0.8 g/100 ml. Treatment duration ranged from 28 days to 12 months. The prebiotic studies were conducted in China (Nanjing), Greece, Germany (Griefswald), Italy (Ferrara, Milan, Turin, Verona), Spain (Los Palmas, Seville) and USA (Iowa). None of the prebiotic studies reported data on hospitalisation and immune response.
Risk of bias
The risk of bias of the included studies was assessed across six domains using guidelines from the Cochrane Handbook for Systematic Reviews of Interventions (Higgins 2008). See Figure 3.

Methodological qualities of included studies.
Random sequence generation
Fifteen trials described clearly the methods used for random sequence generation [21, 24, 32, 37, 41, 43, 44, 46, 49–52]. Random sequence generation was done through computer randomization [21, 37, 38, 43, 44, 50–52], random number tables [39, 46] or block randomization [32, 40, 41]. The method used for random sequence generation was not clearly described in 10 studies [25, 35, 42, 45, 47, 48, 53–56].
Allocation concealment
In seven trials, treatment allocation was adequately concealed [32, 38, 42, 44, 46, 49, 50]. Allocation concealment was adequate due to central allocation using a computer [38], use of sealed envelopes [43, 44, 49], pre – coded or colour coded containers [32, 50] and use of independent staff outside of study [46]. In the rest of the 18 studies, allocation concealment was not clearly demonstrated or described [21, 24, 25, 35, 37, 39–42, 45, 47, 48, 51–56].
Blinding
Adequate blinding of study participants, care providers and assessors was done in 9 trials. Blinding was ensured by using pre-coded or colour coded formula tins [21, 24, 25, 32, 38, 43, 44, 46, 50]. In the other 16 trials, there was not enough information given on the blinding method to make a judgement [35, 37, 39–42, 45, 47–49, 51–56].
Incomplete outcome data
Reported outcome data was satisfactory for 19 studies. In 3 studies, there was no missing outcome data [38, 40, 54]. In 16 studies, missing outcome data was balanced across the intervention groups with similar reasons reported [21, 24, 25, 32, 37, 39, 41–45, 49–52, 55]. In 4 studies there was insufficient information given to permit a judgement [35, 46, 47, 53]. In 2 studies there were no reasons given for missing data [48, 56].
Selective reporting
In 7 studies, the pre-specified outcomes in the methods section were reported in the results section [21, 25, 32, 45, 49, 54, 56]. In 18 studies the pre-specified outcomes were not reported [24, 35–44, 46, 48, 50–55].
Other potential sources of bias
Nineteen studies appeared to be free from other potential sources of bias [21, 24, 25, 32, 38–46, 49–52, 54, 56]. There was insufficient information given to permit a judgment in 6 studies [35, 37, 47, 48, 53, 55].
Effects of interventions
Synbiotics versus controls
Three studies (N = 475) investigated the effect of synbiotic administration versus no synbiotic or placebo (control group) [21, 24, 25].
Primary outcomes
Growth parameters
-
(i)
Weight gain
Only one study [24] reported weight gain in terms of grams per day (g/day). In this study, two types of synbiotics (Type 1 and Type 2) were evaluated and results for boys and girls were reported separately. The results of the two synbiotics were combined using the combined mean and pooled standard deviation. The calculated treatment effects showed that synbiotics failed to significantly increase weight gain for boys (MD 0.90, 95% CI: -1.95 to 3.75, n = 81) and girls (MD 0.90, 95% CI: -1.81 to 3.61, n = 86) compared to the controls.
One study [21] reported weight gain in terms of some score scale. A calculated treatment effect showed that synbiotics failed to significantly increase weight gain compared to controls (MD −0.07, 95% CI: -0.43 to 0.29, n = 79). Since the score scale can take negative values, the values of mean and standard deviation in this analysis do not necessarily imply that the data is skewed.
One study [25] reported weight gain (g/day) in terms of mean difference (MD) and 90% CI. These values were used in calculating the corresponding standard error (SE). The MD and SE were used in calculating the treatment effect (via the generic-inverse variance method in RevMan). Synbiotics again failed to significantly increase weight gain compared to controls (MD −1.09, 95% CI: -3.54 to 1.36, n= 97).
-
(ii)
Length gain
Two studies [24, 25] reported length gain in terms of millimetres per month (mm/month) for boys and girls separately. Results from these two studies were pooled in a meta-analysis but for Chouraqui 2008 [24] results for the two types of synbiotics were combined before meta-analysis. Results from the meta-analysis showed that synbiotics failed to significantly increase length gain compared to controls for both boys (MD 0.75, 95% CI: -0.66 to 2.17, n = 126) and girls (MD 0.75, 95% CI: -0.63 to 2.13, n = 138) [Figure 4. There was no significant heterogeneity detected between the two studies for boys (Chi2=0.50, df=1, p=0.48, I2=0%) and girls (Chi2=0.53, df=1, p=0.47, I2=0%).
Figure 4 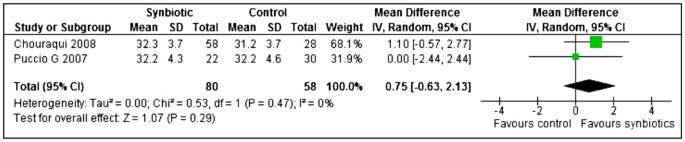
Synbiotics versus controls, Outcome: Length gain (mm/month) for girls.
One study [21] reported length gain in terms of some score scale. A calculated treatment effect showed that synbiotics failed to significantly increase length gain compared to controls (MD 0.01, 95% CI: -0.43 to 0.45, n = 79). Since the score scale can take negative values, the values of mean and standard deviation in this analysis do not necessarily imply that the data is skewed.
-
(iii)
Head circumference gain
Two studies [24, 25] reported head circumference gain in terms of mm/month for boys and girls separately. Results from these two studies were pooled in a meta-analysis but for Chouraqui 2008 [24] results for the two types of synbiotics were combined before meta-analysis. Results from the meta-analysis showed that synbiotics failed to significantly increase head circumference gain compared to controls for both boys. (MD −0.06, 95% CI: -0.96 to 0.85, n = 126) and girls (MD −0.05, 95% CI: -0.94 to 0.85, n = 138). There was no significant heterogeneity detected between the two studies for both boys (Chi2=0.64, df=1, p=0.43, I2=0%) and girls (Chi2=0.67, df=1, p=0.41, I2=0%).
One study [21] reported head circumference gain in terms of some score scale. A calculated treatment effect showed that synbiotics failed to significantly increase head circumference gain compared to controls (MD 0.01, 95% CI: -0.38 to 0.36, n = 79). Since the score scale can take negative values, the values of mean and standard deviation in this analysis do not necessarily imply that the data is skewed.

Secondary outcomes
Tolerance to formula
-
(i)
Stool frequency
Two studies [21, 25] reported stool frequency (evacuations per day) and their results were pooled in a meta-analysis. Synbiotics significantly increased stool frequency compared to the controls (MD 0.28, 95% CI: 0.08 to 0.48, n = 176) and there was no significant heterogeneity detected between the two trials (Chi2=0.93, df=1, p=0.33, I2=0%) [Figure 5.
Figure 5 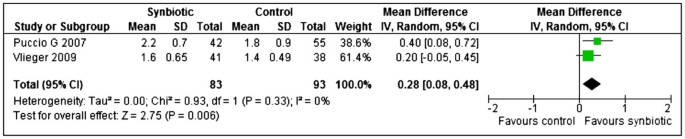
Synbiotics versus controls, outcome: Stool frequency (evacuations per day).
One study [25] reported stool frequency (evacuations per day) but values for standard deviations were not given and as a result, no treatment effect could be calculated.
-
(ii)
Stool consistency
One study [21] evaluated stool consistency using a consistency score (1=hard to 4=watery and loose) and a calculated treatment effect showed no significant difference between the synbiotic and control treated groups (MD 0.13, 95% CI: -0.15 to 0.41, n = 79).
One study [24] study reported that liquid stools occurred significantly more frequently in the synbiotic group compared to the control group (OR 3.17, 95% CI: 1.59 to 3.60, n = 66).
Puccio 2007 [25] reported that data on stool consistency showed no statistically significant differences between the two study groups (data not shown in study report).
-
(iii)
Incidence of colic, spitting up / regurgitation, vomiting, crying
Data on frequency of crying, restlessness, colic, spitting and vomiting reported by Puccio 2007 [25] showed no statistically significant differences between the two study groups (data not shown in study report).
Results from Vlieger 2009 [21] showed no significant differences in the frequency of vomiting (RR 0.46, 95% CI: 0.12 to 1.72, n = 79) and colic (RR 2.50, 95% CI: 0.46 to 13.73, n = 79) between the two study groups. The same study showed no difference in crying (hours per day) between the two study groups (MD −0.10, 95% CI: -0.46 to 0.26, n = 79).
-
(iv)
Average formula intake
One study [25] reported the mean daily intake of formula in a graph where no values could be retrieved.
One study [25] reported the mean daily intake of formula in a graph where no values could be retrieved.

Infections
-
(i)
Infections
Puccio 2007 [25] reported data on frequency of respiratory tract infections but there were no significant differences between the synbiotic and control treated groups (RR 0.71, 95% CI: 0.31 to 1.59, n = 97).
Vlieger 2009 [21] reported the mean (SD) of upper respiratory tract infections and gastrointestinal infections (times per month) but no treatment effect could be calculated because the data was skewed (mean < SD).
-
(ii)
Antibiotic intake
Vlieger 2009 [21] reported the mean (SD) of the use of antibiotics (times per month) but no treatment effect could be calculated because the data was skewed (mean < SD).
Probiotics versus controls
Ten studies (N = 933) investigated the effect of probiotic administration versus no probiotic (Control group) [38, 40, 44–46, 48, 50–52, 55].
Primary outcomes: growth parameters
-
(i)
Weight gain
Four studies [24, 44, 50, 55] reported weight gain (g/day) for boys and girls separately. The results from these four studies were pooled in meta-analyses separately for boys and girls. Probiotics failed to significantly increase weight gain compared to the controls for boys (MD 1.64, 95% CI: -0.36 to 3.64 n = 158), no statistically significant heterogeneity was detected between the studies for boys (Chi2=3.43, df=3, p=0.33, I2=13%). However, statistically significant heterogeneity was observed for girls (Chi2=9.90, df=3, p=0.02, I2=70%). An investigation of heterogeneity using subgroup analysis with respect to the type of formula (normal/ acidified/ reduced protein) yielded the following results. Two studies [24, 44] showed that normal formula with probiotics failed to significantly increase weight gain compared to the controls for girls (MD 1.33, 95% CI: -0.76 to 3.41, n = 113) with no significant heterogeneity between the two studies (Chi2=0.08, df=1, p=0.78, I2=0%). Urban 2008 [50] showed that acidified formula with probiotics significantly increased weight gain in probiotic group compared to controls for girls (MD 5.30, 95% CI: 0.46 to 10.14, n = 28). Ziegler 2003 [55] showed that reduced protein formula with probiotics significantly reduced weight gain compared to controls for girls (MD −4.80, 95% CI: -9.18 to −0.42, n = 29) (Figure 6).
Figure 6 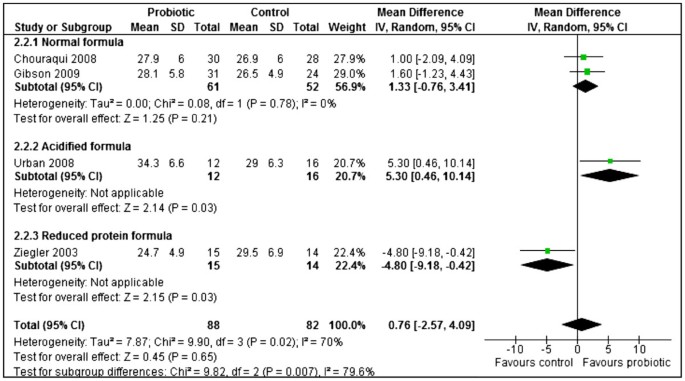
Probiotics versus controls, outcome: Weight gain (g/ day) for girls.
-
(ii)
Length gain
Four studies [24, 44, 50, 55] reported length gain for boys and girls separately. Two studies reported in terms of mm/month and two studies reported in terms of mm/day. The latter two studies results were converted to mm/month by multiplying both the mean and SD by 28, assuming a 4 week/ 28-day month. Results from these four studies were pooled in meta-analyses separately for boys and girls. Probiotics failed to significantly increase length gain compared to the controls for both boys (MD −0.37, 95% CI: -1.64 to 0.90, n = 158) and girls (MD 0.32, 95% CI: -0.81 to 1.45, n =165). No statistically significant heterogeneity was detected between the studies for both boys (Chi2=3.49, df=3, p=0.32, I2=14%) and girls (Chi2=2.94, df=3, p=0.40, I2=0%).
-
(iii)
Head circumference gain
Three studies [24, 44, 50] reported length gain for boys and girls separately. Two studies reported in terms of mm/month and one study reported in terms of mm/day. The latter study's results were converted to mm/month by multiplying both the mean and SD by 28 (assuming a 4 week/ 28-day month). Probiotics failed to significantly increase head circumference gain compared to the controls for both boys (MD 0.76, 95% CI: -1.02 to 2.54, n = 125) and girls (MD 0.27, 95% CI: -0.70 to 1.23, n = 139). No statistically significant heterogeneity was detected between the studies for both boys (Chi2=3.87, df=2, p=0.14, I2=48%) and girls (Chi2=1.12, df=2, p=0.57, I2=0%).

Secondary outcomes
Tolerance to formula
-
(i)
Stool frequency
Two studies [40, 48] reported stool frequency (evacuations per day) and meta-analysis of results from these studies showed that probiotics failed to significantly increase stool frequency compared to controls (MD 0.01, 95% CI: -0.44 to 0.46, n = 120). There was no significant heterogeneity between the studies (Chi2=0.19, df=1, p=0.66, I2=0%). Since Petschow 2005 [48] evaluated different probiotic dosages, the highest dosage was chosen for the analysis.
-
(ii)
Stool consistency
One study [48] reported stool consistency score (1–5: 1=hard, 2=formed, 3=soft, 4=loose, 5=watery). A calculated treatment effect showed that there was no difference in consistency score between the probiotic and control groups (MD 0.00, 95% CI: -0.33 to 0.33, n = 30).
Chouraqui 2008 [24] reported that liquid stools occurred significantly more frequently in the probiotic group compared to the control group (OR 2.79, 95% CI: 1.48 to 5.29, n = 64).
Ziegler 2003 [55] reported stool consistency in terms of mean (SD) separately for hard, formed, soft and liquid stools but no treatment effect was calculated because the data was skewed (mean < SD). Weizman 2006 [52] reported results for stool consistency score but again the data was skewed (mean < SD).
-
(iii)
Episodes of diarrhoea
Ziegler 2003 and Weizman 2005 [52, 55] reported episodes of diarrhoea in terms of mean (SD) but no meta-analysis was done because their results show that the data was skewed (mean < SD).
Chouraqui 2004 and Chouraqui 2008 [24, 40] reported the frequency of diarrhoea but meta-analysis of their results showed no benefit from probiotic treatment compared to controls (RR 0.80, 95% CI: 0.46 to 1.38, n = 209). No statistically significant heterogeneity was detected between the studies (Chi2=0.61, df=1, p=0.44, I2=0%).
-
(iv)
Incidence of colic, spitting up / regurgitation, vomiting, crying
Chouraqui 2004 [40] reported the number of infants having spitting or regurgitation and there was no difference observed between the probiotic and control groups (RR 0.80, 95% CI: 0.26 to 2.42, n = 90). Weizman 2006 [52] reported the daily crying episodes and there were significantly less crying episodes in favour of the control group (MD 0.60, 95% CI: 0.20 to 1.00, n = 59). The results from the two probiotic groups were combined before meta-analysis. Gibson 2009 [44] reported that stools, colic, spitting up, vomiting, restlessness occurred at similar frequencies in the two groups (data not shown in report). Ziegler 2003 [55] reported that that there was no significant formula effects on crying and colic (data not shown in report).
-
(v)
Average formula intake
One study [38] reported the average formula intake (ml/kg body-weight /day) and the calculated treatment effect showed no differences between the probiotic and control groups (MD 5.00, 95% CI: -12.60 to 22.60, n = 58). Two studies [44, 51] reported the average formula intake (ml/day) and meta-analysis showed that infants in the probiotic group had a significantly higher formula intake compared to the controls (MD 46.74, 95% CI: 23.93 to 69.54, n = 292). No statistically significant heterogeneity was detected between the studies (Chi2=0.45, df=1, p=0.50, I2=0%).
Infections
-
(i)
Infections
One study [44] reported the number of infants having respiratory infections and the calculated treatment effect showed no differences between the probiotic and control groups (RR 0.93, 95% CI: 0.74 to 1.17, n = 142). One study [51] reported episodes of respiratory illness in terms of mean (95% CI). The mean (95% CI) were used in calculating the SDs. However, no treatment effect was calculated because the data was skewed (mean < SD). One study [44] reported the number of infants having gastrointestinal infections and the calculated treatment effect showed no differences between the probiotic and control groups (RR 0.70, 95% CI: 0.45 to 1.11, n = 142).
-
(ii)
Antibiotic intake
One study [51] reported prescription of antibiotics in terms of mean (95% CI). The mean (95% CI) were used in calculating the SDs. However, no treatment effect was calculated because the data was skewed (mean < SD).
Hospitalization
Only one study [55] reported hospitalization but no treatment effect was calculated because the data was skewed (mean < SD)
Changes in gastrointestinal microflora
-
(i)
Bifidobacteria
Two studies [38, 46] reported results for bifidobacteria measured as log10 (CFU) per gram stool. A meta-analysis showed that the control group had significantly increased counts of bifidobacteria compared to probiotic group. (MD −1.27, 95% CI: -2.03 to −0.51, n = 57). No statistically significant heterogeneity was detected between the studies (Chi2=0.71, df=1, p=0.40, I2=0%) [Figure 7.
Figure 7 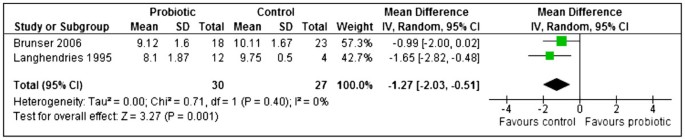
Probiotics versus controls, outcome: Bifidobacteria -log10(CFU) per gram of stool.
-
(ii)
Lactobacillus
Only one study [38] reported results for lactobacillus, measured as log10 (cfu) per gram stool and the calculated treatment effect showed that probiotics failed to increase the counts of Lactobacillus compared to the controls (MD 0.22, 95% CI: -0.72 to 1.16, n = 41).

Pathogens
-
(iii)
Enterobacteria
Two studies [38, 46] reported results for enterobacteria measured as log10 (cfu) per gram stool and meta-analysis showed that probiotics significantly reduced counts of Enterobacteria compared to the controls (MD −0.61, 95% CI: -1.20 to −0.03, n = 51). No statistically significant heterogeneity was detected between the studies (Chi2=0.62, df=1, p=0.43, I2=0%).
-
(iv)
Bacteriodes
Two studies [38, 46] reported results for bacteriodes measured as log10 (cfu) per gram stool and meta-analysis showed that probiotics failed to significantly reduce counts of Bacteriodes compared to the controls (MD −0.11, 95% CI: -1.01 to 0.78, n = 51). No statistically significant heterogeneity was detected between the studies (Chi2=0.95, df=1, p=0.33, I2=0%).
Prebiotics versus controls
Twelve studies (N = 1563) investigated the effect of prebiotic administration versus placebo or no prebiotic in formula (Control group) [32, 35, 37, 39, 41–43, 47, 49, 53, 54, 56].
Primary outcomes: growth parameters
-
(i)
Weight gain
Eight studies [32, 35, 41, 42, 47, 49, 54, 56] reported weight gain (g/day) and meta-analysis of their results showed that prebiotics significantly increased weight gain compared to the controls (MD 0.97, 95% CI: 0.24 to 1.70, n = 861). No statistically significant heterogeneity was detected between the studies (Chi2=4.67, df=7, p=0.70, I2=0%). Three studies [35, 42, 56] evaluated different types of prebiotics (acidic oligosaccharides with maltodextrin or neutral GOS FOS, GOS FOS, GOS with polydextrose alone or with lactulose). The results for the prebiotics in each of these studies were combined before meta-analysis using combined mean and pooled standard deviation (Figure 8).
Figure 8 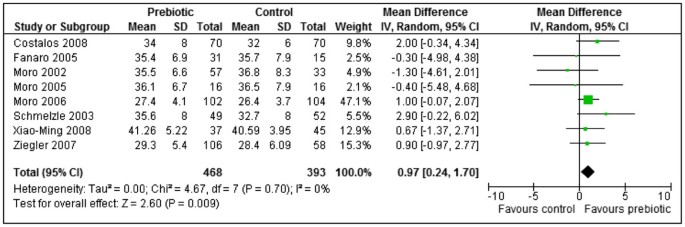
Prebiotics versus controls, outcome: weight gain (g/day).
-
(ii)
Length gain
Seven studies [32, 35, 41, 42, 47, 49, 54] reported length gain either as cm/week or in units that were converted to cm/week. Meta-analysis of their results showed that prebiotics failed to significantly increase length gain compared to the controls (MD 0.01, 95% CI: -0.01 to 0.04, n = 697). No statistically significant heterogeneity was detected between the studies (Chi2=5.05, df=6, p=0.54, I2=0%). Two studies [35, 42] each evaluated different types of prebiotics (Acidic oligosaccharides 0.2 g/dl with maltodextrin, acidic oligosaccharides 0.2 g/dl with neutral GOS FOS 0.6 g/dl; GOS, FOS 0.4 g/dl and GOS FOS 0.8 g/dl). The results for the prebiotics in each of these studies were combined before meta-analysis using combined mean and pooled standard deviation.
-
(iii)
Head circumference gain
Three studies [32, 41, 49] reported head circumference gain either as cm/week or in units that were converted to cm/week. Meta-analysis of their results showed that prebiotics failed to significantly increase head circumference gain compared to the controls (MD −0.01, 95% CI: -0.02 to 0.00, n = 438). No statistically significant heterogeneity was detected between the studies (Chi2=2.18, df=2, p=0.34, I2=8%).

Results from Ziegler 2007 [56] were not used because they reported head circumference gain only at 30 days and not at the end of treatment period which was 120 days. (All other studies reported results for end of treatment period).
Secondary outcomes
Tolerance to formula
-
(i)
Stool frequency
Four studies [32, 35, 43, 56] reported stool frequency (evacuations per day) and meta-analysis of their results showed that prebiotics significantly increased stool frequency compared to the controls (MD 0.18, 95% CI: 0.06 to 0.30, n = 539). No statistically significant heterogeneity was detected between the studies (Chi2=2.97, df=3, p=0.40, I2=0%). Two studies [35, 56] each evaluated different types of prebiotics (GOS FOS; GOS with polydextrose alone or with lactulose). The results for the prebiotics in each of these studies were combined before meta-analysis using combined mean and pooled standard deviation.
Costalos 2008 [41] reported the median (range) of stool frequency (Table 6).
Table 6 Stool characteristics -
(ii)
Stool consistency
Results from the two studies [32, 42] using a 5-point scale (1=watery, 2=soft, 3=seedy, 4=formed, 5=hard) were pooled in a meta-analysis but due to significant heterogeneity detected between the two studies, their results are reported separately. Stools from the prebiotic group were significantly softer compared to controls for both Fanaro 2005 [42] (MD −1.20, 95% CI: -1.61 to −0.79, n = 46) and Moro 2006 [32] (MD −0.78, 95% CI: -1.00 to −0.56, n = 206). Fanaro 2005 [42] evaluated two types of prebiotics (acidic oligosaccharides with maltodextrin or neutral GOS FOS), the results for the prebiotics were combined before meta-analysis using combined mean and pooled standard deviation.
Fanaro 2008 [43] used an opposite 5 point scale (1=hard, 2=formed, 3=seedy, 4=soft, 5=watery) and reported the mean (SD) of area under the curve. A calculated treatment effect showed that stools from the prebiotic group were significantly softer compared to controls (MD 0.53, 95% CI: 0.31 to 0.75, n = 88).
Results from two studies [54, 56] used a 4-point scale (1=watery, 2=soft, 3=seedy, 4=formed) were pooled in a meta-analysis but due to significant heterogeneity detected between the two studies, their results are reported separately. Stools from the prebiotic group were significantly softer compared to controls for both Xiao-Ming 2008 [54] (MD −0.65, 95% CI: -0.87 to −0.43, n = 82) and Ziegler 2007 [56] (MD −0.25, 95% CI: -0.44 to −0.06, n = 157). Ziegler 2007 [56] evaluated two types of prebiotics (GOS with polydextrose alone or with lactulose). The results for the prebiotics were combined before meta-analysis using combined mean and pooled standard deviation.
Costalos 2008 [41] reported the median (range) of stool consistency score (Table 6).
Moro 2002 [35] reported the median (IQR) of stool consistency score (Table 6).
-
(iii)
Diarrhoea
Two studies [39, 56] reported the number of infants having diarrhoea and a meta-analysis showed that prebiotics failed to significantly decrease the incidence of diarrhoea compared to the controls (RR 0.62, 95% CI: 0.19 to 1.99, n = 237). No statistically significant heterogeneity was detected between the studies (Chi2=1.65, df=1, p=0.20, I2=39%). Since Ziegler 2007 [56] evaluated two types of prebiotics (GOS with polydextrose alone or with lactulose), the number of events and totals for the prebiotics were summed before meta-analysis.
-
(iv)
Incidence of colic, spitting up / regurgitation, vomiting, crying
Moro 2006 [32] reported no vomiting and very few infants crying but the number of infants experiencing regurgitation were significantly reduced in the prebiotic group compared to the control group (RR 0.11, 95% CI: 0.02 to 0.49, n = 206).
According to Xiao-Ming 2008 [54], there was no difference in crying score (MD 0.01, 95% CI: -0.00 to 0.02, n = 82), regurgitation score (MD −0.01, 95% CI: -0.27 to 0.25, n = 82), and vomiting score (MD −0.03, 95% CI: -0.21 to 0.15, n = 82) between the prebiotic and control groups. All scores were 3 point scores. Crying score: 1= practically not crying, 2 = crying in connection to feeding, 3 = crying independently from meals. Regurgitation score: 1 = no regurgitation, 2 = 1–2 regurgitations, 3 = > 2 regurgitations per day. Vomiting score: 1= no vomiting, 2 = 1 episode of vomiting, 3 = >1 episode of vomiting.
Ziegler 2007 [56] reported that none of the infants had colic; the numbers having excessive spitting were too few; vomiting was similar between the two groups (RR 1.12, 95% CI: 0.43 to 2.89, n = 32). The prebiotic results were summed for the two types before calculation of treatment effect.
Both Moro 2002 and Fanaro 2005 [35, 42] reported no difference in the incidence of crying, regurgitation and vomiting episodes (data values not shown in study reports).
-
(v)
Average formula intake
Five studies [35, 38, 47, 49, 54] reported formula intake (ml/kg body-weight/ day) and meta-analysis of their results showed statistically significant heterogeneity between the studies (Chi2=10.80, df=4, p=0.03, I2=63%,). Sensitivity analysis by removing the one study [49] showing significantly less formula intake for the prebiotics (MD −21.00, 95% CI: -31.86 to −10.14, n = 101) yielded no significant heterogeneity between the four remaining studies (Chi2=1.79, df=3, p=0.62, I2=0%) but no significant difference between the two groups (MD 0.31, 95% CI: -8.40 to 9.02, n = 269). The prebiotic results for the two types of prebiotics (GOS, FOS 0.4 g/dl, GOS FOS 0.8 g/dl) in Moro 2002 [35] were combined before meta-analysis using combined mean and pooled standard deviation.
Infections
-
(i)
Infections
According to Moro 2006 [32], prebiotics significantly reduced overall infections compared to the controls (RR 0.45, 95% CI: 0.29 to 0.69, n = 204). The number of infants having gastrointestinal infections, urinary tract infections (UTI) and otitis media were very few [32].
Two studies [32, 39] reported the number of infants with upper respiratory tract infections (URTI) and their results were pooled in a meta-analysis. However, due to significant heterogeneity detected between the two studies (Chi2=7.69, df=1, p=0.006, I2=87%), their results are reported separately. Although Moro 2006 [32] showed that the prebiotic group significantly reduced the number of infants with URTI compared to the controls (RR 0.48, 95% CI: 0.27 to 0.84, n = 206), there was no difference between the two groups according to Bruzzese 2009 [39] (RR 1.07, 95% CI: 0.86 to 1.33, n = 203).
-
(ii)
Antibiotic intake
According to Moro 2006 [32], prebiotics failed to significantly reduce antibiotic intake compared to the controls (RR 0.51, 95% CI: 0.26 to 1.00, n = 206).
Changes in gastrointestinal microflora
-
(i)
Bifidobacteria
Five studies [38, 42, 47, 53, 54] (n = 280) reported Bifidobacteria (log10 CFU per gram stool) and their results were pooled in a meta-analysis. However, statistically significant heterogeneity was detected between the studies (Chi2=60.23, df=4, p < 0.00001, I2=93%). Heterogeneity persisted after conducting subgroup analysis with respect to duration of supplementation or dosage of treatment. The results for each study are therefore reported separately. Four studies showed that prebiotics significantly increased bifidobacteria: Fanaro 2005 [42] (MD 0.30, 95% CI: 0.13 to 0.47, n = 46); Moro 2005 [47] (MD 2.70, 95% CI: 0.37 to 5.03, n = 32); Xiao-Ming 2004 [53] (MD 1.90, 95% CI: 1.51 to 2.29, n = 121); Xiao-Ming 2008 [54] (MD 0.85, 95% CI: 0.16 to 1.54, n = 38). The prebiotic results for the two types of prebiotics (acidic oligosaccharides with maltodextrin or neutral GOS FOS) in Fanaro 2005 [42] were combined before meta-analysis using combined mean and pooled SD. However, Brunser 2006 [38] showed no significant difference in the number of bifidobacteria between the two groups (MD −0.39, 95% CI: -1.49 to 0.71, n = 43) [Figure 9.
Figure 9 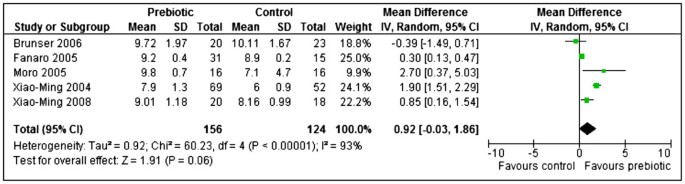
Prebiotics versus controls, outcome: Bifidobacteria -log10(CFU) per gram stool.
Four studies reported their results in median; therefore no conclusions could be made. Costalos 2008 [41] reported the median (range) of Bifidobacteria (log10 CFU per gram stool) as a percentage of total bacteria (Table 7). Three studies [32, 35, 43] reported the median (IQR) of Bifidobacteria (log10 CFU per gram stool) (Table 8).
Table 7 Summary of findings table: Synbiotic studies Table 8 Gastrointestinal microflora -
(ii)
Lactobacillus
Three studies [38, 53, 54] reported Lactobacillus (log10 CFU per gram stool) and meta-analysis of their results showed statistically significant heterogeneity between the studies (Chi2=26.44, df=2, p < 0.00001, I2=92%). Sensitivity analysis was done by removing the one study [38] that showed no difference between the two groups (MD −0.30, 95% CI: -1.08 to 0.48, n = 43). This yielded no significant heterogeneity (Chi2=0.33, df=1, p =0.57, I2=0%) between the remaining two studies. Meta-analysis showed that prebiotics significantly increased lactobacillus counts compared to the controls (MD 1.96, 95% CI: 1.58 to 2.34, n = 159).
Three studies reported their results in median; therefore no conclusions could be made. Fanaro 2008, Moro 2002 and Moro 2006 [32, 35, 43] reported the median (IQR) of Lactobacillus (log10 CFU per gram stool) (Table 8).

Pathogens
-
(iii)
Enterobacteria
According to Brunser 2006 [38], there was no difference in the number of Enterobacteria counts between the prebiotic and control groups (MD −0.48, 95% CI: -1.88 to 0.22, n = 43). Fanaro 2008 [43] reported the median (IQR) of Enterobacteria (log10 CFU per gram stool) (Table 8).
-
(iv)
Bacteriodes
According to Brunser 2006 [38], there was no difference in the number of Bacteriodes between the prebiotic and control groups (MD −0.35, 95% CI: -1.40 to 0.70, n = 43). Fanaro 2008 [43] reported the median (IQR) of Bacteriodes (log10 CFU per gram stool) (Table 8).
-
(v)
E. coli
Two studies [53, 54] reported E. coli (log10 CFU per gram stool) and their results were pooled in a meta-analysis. However, statistically significant heterogeneity was detected between the studies (Chi2=5.96, df=1, p=0.01, I2=83%). The results are therefore reported separately. Xiao-Ming 2004 [53] showed that prebiotics significantly reduced E. coli counts compared to the controls (MD −0.90, 95% CI: -1.29 to −0.51, n = 121) while Xiao-Ming 2008 [54] showed no significant difference between the two groups (MD 0.67, 95% CI: -0.53 to 1.87, n = 38).
Two studies reported their results in median; therefore no conclusions could be made. Costalos 2008 [41] reported the median (range) of E. coli (log10 CFU per gram stool) as a percentage of total bacteria (Table 8). Fanaro 2008 [43] reported the median (IQR) of E. coli and clostridia (log10 CFU per gram stool) (Table 8).
Discussion
The objectives of this systematic review were to determine the effects of infant formula containing probiotics, prebiotics or both (synbiotics) on clinical outcomes in full term infants and to explore if synbiotics are superior over probiotics or prebiotics. Studies that used breast milk or mixed feeds (breast and infant formula or other types of milk) were excluded. All included RCTs evaluated either synbiotics, probiotics or prebiotics use in full term infants. The studies varied in enrolment criteria, sample size, intervention and treatment duration.
Summary of main findings
Synbiotics
Addition of synbiotics to infant formula did not have any significant effect on growth (weight gain, length and head circumference). Synbiotics significantly increased stool frequency. However, two studies [21, 25] reported no differences in stool consistency, while one study [24] reported an increase in liquid stools in synbiotic group. There were no significant differences between study groups on the incidence and frequency of colic, spitting up / regurgitation, crying, restlessness or vomiting. The effect of synbiotics on the volume of formula tolerated was not reported. Effect of synbiotics on frequency of infections was under reported. In one study [25], there were no differences in the frequency of infections between study groups, while in another study [21], the treatment effect could not be calculated or any conclusions made on the frequency of infections or antibiotic intake. Effects of synbiotics on hospitalization, GI microflora and immune response were not reported in any study therefore these parameters could not be evaluated.
Interpreting the effects of synbiotic supplementation of infant formula on clinical outcomes was difficult due to the limited number of studies. The synbiotic studies had short treatment duration (4 to 6 months) and treatment varied in all 3 studies. There was not enough evidence to state that synbiotics in infant formula have a significant effect on growth or lower the incidence of colic, spitting up / regurgitation, crying, restlessness. There is limited evidence that synbiotics do increase stool frequency and effects on stool consistency were inconclusive. There is not enough evidence to state that synbiotics reduce the risk of infections or decrease use of antibiotics. There is no data on the effects of synbiotics on GI microflora. The available data is very limited to draw reliable conclusions on the effects of synbiotics on clinical outcomes in formula fed infants.
Probiotics
A limited number of studies analyzed the effects of probiotic supplementation on growth by gender. These studies had small sample sizes and the follow-up periods were short. Addition of probiotics to infant formula did not have any significant effect on growth (weight gain, length gain or head circumference) in boys or girls. No study reported any weight loss. Probiotic infant formula was well tolerated. The limited available data shows that probiotics did not have any significant effect on stool frequency or consistency. Probiotic supplementation was not associated with fewer episodes of diarrhoea, a lower incidence of colic, spitting up / regurgitation, restlessness, vomiting. In one study [52] there were fewer crying episodes in the control group than probiotic group. Probiotic effects on infections, antibiotic use and length of hospitalization were inconclusive. Probiotic supplementation did result in a significantly higher formula intake compared to controls.
Effects of probiotic supplementation on intestinal microflora were conflicting. Probiotics failed to increase counts of bifidobacteria and lactobacillus. Probiotics significantly reduced counts of enterobacteria but failed to reduce counts of bacteriodes. None of the studies reported on immune response (CRP, IL-6), therefore the impact of probiotics on these parameters could not be evaluated. All 10 probiotic studies used various strains of bifidobacteria and lactobacillus with different doses. Treatment duration also varied from 14 days to 7 months. This confirms the ESPGHAN Committee on nutrition statement that there is a lack of published evidence on clinical benefits from long term use of probiotic containing infant formula [95]. Well designed long term follow – up RCTs using similar treatment regimens (same probiotics strains, dose and treatment duration) are needed to establish the effects of probiotics on healthy formula fed infants.
Prebiotics
Prebiotic addition to infant formula did have a significant effect on weight gain but had no significant effect on length and head circumference. None of the studies reported any weight loss. Prebiotic supplementation increased stool frequency but failed to improve stool consistency or decrease incidence of diarrhoea. Prebiotic supplementation did not reduce the incidence of spitting up / regurgitation, vomiting or crying (no study reported colic) or increased volume of formula tolerated. Prebiotic supplementation failed to significantly reduce upper respiratory infections. However, one study [32] did report a significant reduction in overall infections and antibiotic intake. Prebiotics supplementation failed to increase counts of bifidobacteria, lactobacillus or decrease the levels of pathogens (enterobacteria, bacteriodes, E – coli). None of the studies reported on hospitalization (days in hospital) and immune response (CRP, IL-6), therefore the impact of prebiotics on these parameters could not be evaluated.
Majority of the studies had a short treatment duration ranging from 28 days to 12 months. The prebiotic doses ranged from 0.15 g to 0.8 g/100 ml which did not exceed the level recommended by the European Committee on food in order to minimize intolerance and maximize the bifidogenic effect of the prebiotic.
Quality of the evidence and potential biases in the review process
We used guidelines from GRADE working group and GRADEpro 3.6 software to assess the quality of evidence in this review (Table 7, 9, 10). Overall the quality of evidence for primary outcomes is low, meaning that further research is very likely to have an important impact on our confidence in the estimate of effect and is likely to change the estimate. The quality of the evidence was compromised by: Imprecision (majority of studies had a small sample size ranging from 97 to 227 in the synbiotic studies, 54 to 201 in probiotic studies, 32 to 271 in the prebiotic studies); limitations in study design and execution (inadequate information was published to assess methodological quality of the study. Information was missing on sequence generation, allocation concealment, blinding, incomplete outcome data, selective reporting, free of other bias domains; Inconsistency of results); unexplained heterogeneity; use of different study preparations (types of synbiotic, probiotic, prebiotics) and different doses regimens were used and publication bias.
At the conclusion of the review process and preparation of the manuscript (for this review), one on-going study [96] was recruiting, one study [97] was not yet recruiting, one study [98] was still on-going, no longer recruiting. Therefore data from these studies could not be included in this review. The reviewers used thorough comprehensive search strategies adopted for the available databases. All attempts were made to minimize publication bias. All steps of this review were conducted independently by the reviewers. Only randomised controlled studies were included in this review.
Breast feeding statement
By conducting this review on exclusively formula fed infants, the authors do not seek to diminish the importance of breastfeeding and promote formula feeding. The reviewers acknowledge the importance of breastfeeding for infants. They support exclusive breastfeeding for 6 months, thereafter safe complementary feeding from 6 months of age with continued breastfeeding up to 2 years and beyond as per the global recommendations for optimal infant feeding of WHO and United Nations Children's Fund (UNICEF). This is because breastfeeding is the ideal feeding method for infants [99].
Conclusion
There is not enough evidence to state that supplementation of term infant formula with synbiotics, probiotics or prebiotics does result in improved growth and clinical outcomes in full term infants. There is no data available to establish if synbiotics are superior to probiotics or prebiotics. Therefore this review does not support the routine supplementation of term infant formula with synbiotics, probiotics or prebiotics.
Implications for practice
Probiotics: The limited evidence shows synbiotic or probiotic supplementation of infant formula did not have any adverse effects, significant impact on growth or clinical outcomes. All studies used different probiotic strains, the effects of one type of probiotic cannot be extrapolated to other types of probiotic bacteria. Prebiotic supplementation of infant formula also did not result in any adverse effects on infants. There are some clinical benefits such as improved weight gain and stool frequency.
Implications for research
For clear recommendations to be made, well designed large RCTs with long term follow - up are required on exclusively formula fed term infants to investigate the effect of the same synbiotic combinations on clinical outcomes; the effect of the same probiotics (with similar doses and treatment duration) on clinical outcomes because available studies used different probiotic doses and treatment durations; the effect of the same prebiotics (with similar doses and treatment duration) on clinical outcomes because available studies used similar prebiotics with different doses and treatment duration; the effects of synbiotics, probiotics or prebiotics on clinical outcomes that have not been adequately addressed in previous studies; if synbiotics are superior to probiotics or prebiotics. Future RCTs should have treatment arms that include both synbiotics, probiotic and prebiotics.
Authors’ information
1Division of Human Nutrition, Faculty of Medicine and Health Sciences, Stellenbosch University, South Africa, 2Wits Reproductive Health & HIV Institute (WRHI), Faculty of Health Sciences, University of the
Witwatersrand, Johannesburg, South Africa, 3Centre for Evidence-Based Health Care, Faculty of Medicine and Health Sciences, Stellenbosch University, South Africa
Abbreviations
- Cfu:
-
Colony Forming Units
- CI:
-
Confidence Interval
- cm:
-
Centimetres
- ESPGHAN:
-
European society for paediatric, gastroenterology, hepatology and nutrition
- FOS:
-
Fructooligosaccharide
- g/day:
-
Grams per day
- GI:
-
Gastrointestinal
- GOS:
-
Galactooligosaccharide
- GRAS:
-
Generally regarded as safe
- IQR:
-
Inter quartile range
- IL-6:
-
Interleukin – 6
- MD:
-
Mean difference
- mm:
-
millimetres
- RCTs:
-
Randomized controlled trials
- RR:
-
Risk ratio
- SD:
-
Standard deviation
- UNICEF:
-
United nations children's fund
- UTI:
-
Urinary tract infections
- URTI:
-
Upper respiratory tract infections
- WHO:
-
World Health Organisation.
References
Vanderhoof J, Berseth CL: Growth during the first year of life. Perinatal Nutrition. Optimizing Infant Health and Development. Edited by: Bhatia J. 2005, New York: Marcel Dekker, 291-298.
Chumlea WC, Guo SS: Physical growth and development. Handbook of Pediatric Nutrition. Edited by: Samour PQ, Helm KK, Lang CE. 2005, Sudbury, Massachusetts: James and Bartlett Publishers, 4-5. 2
Shah NP: Functional cultures and health benefits. Int Dairy J. 2007, 17: 1262-1277. 10.1016/j.idairyj.2007.01.014.
Parvez S, Malik KA, Kang SA, Kim H-Y: Probiotics and their fermented food products are beneficial for health. J Appl Microbiol. 2006, 100: 1171-1185. 10.1111/j.1365-2672.2006.02963.x.
Gibson GR, Nathalie D: Inulin and oligofructose. New scientific developments. Nutr Today. 2008, 43: 54-59. 10.1097/01.NT.0000303311.36663.39.
Macfarlane GT, Steed H, Macfarlane S: Bacterial metabolism and health related effects of galactooligosaccharides and other prebiotics. J Appl Microbiol. 2008, 104: 305-344.
Losada MA, Olleros T: Towards a healthier diet for the colon: the influence of fructooligosaccharides and lactobacilli on intestinal health. Nutr Res. 2002, 22: 71-84. 10.1016/S0271-5317(01)00395-5.
Watzl B, Girrbach S, Monika R: Inulin, oligofructose and immunomodulation. Br J Nutr. 2005, 93 (Suppl 1): S49-S55.
Underwood MA, Salzmand NH, Bennett SH, Barman M, Mills DA, Marcobal A, Tancredi DJ, Bevins CL, Sherman M: A randomized placebo -controlled comparison of 2 prebiotic/probiotic combinations in preterm infants: Impact on weight gain, intestinal micro biota and fecal short chain fatty acids. J Pediatr Gastroenterol Nutr. 2009, 48: 216-225. 10.1097/MPG.0b013e31818de195.
Schlee M, Harder J, KÖten B, Stange EF, Wehkamp J, Fellermann K: Probiotic lactobacilli and VSL#3 induce enterocyte beta-defensin 2. Clin Exp Immunol. 2008, 151 (3): 528-535. 10.1111/j.1365-2249.2007.03587.x.
Fedorak RN, Madsen Karen K: Probiotics and prebiotics in gastrointestinal disorders. Curr Opin Gastroenterol. 2004, 20: 146-155. 10.1097/00001574-200403000-00017.
Heyman M, Terpend K, Menard S: Effects of specific lactic acid bacteria on the intestinal permeability to macromolecules and the inflammatory condition. Acta Pediatr. 2005, 94 (Suppl 449): 34-36.
Gill HS: Probiotics enhance anti- effective defences in the gastrointestinal tract. Best Pract Res Clin Gastroenterol. 2003, 17: 755-773. 10.1016/S1521-6918(03)00074-X.
Williams NT: Probiotics. Am J Health Syst Pharm. 2010, 67: 449-458. 10.2146/ajhp090168.
Snydman DR: The safety of probiotics. Clin Infect Dis. 2008, 46 (Suppl 2): S104-S111.
Adams MR, Mateau P: On the safety of lactic acid bacteria from food. Int J Food Microbiol. 1995, 27: 263-264. 10.1016/0168-1605(95)00067-T.
Rego MAC, Martinez FE, Elias JJ, Mussi-Pinhata MM: Diagnostic value of interleukin-6 and C-reactive protein on early onset bacterial infection in preterm neonates. J Perinat Med. 2010, 38: 527-533.
Detrick B, Hooks JJ: From Cytokines in Human Immunology. Handbook of Human Immunology. Edited by: Leffel MS, Donnenberg AD, Rose NR, Boca R. 1997, New York: CRC Press LLC, 250-252.
Peakman M, Vergani D: From Innate immunity I: Physical and human protection. Basic and Clinical Immunology. 2009, Churchill Livingstone: Elsevier, 22-108. 2
Abbas AK, Lichtman AH: Basic immunology. Functions and Disorders of the Immune System. 2006, Philadelphia PA: Elsevier Saunders
Vlieger AM, Robroch A, Van Buuren S, Kiers J, Rijkers G, Benninga MA, Biesebeke RT: Tolerance and safety of lactobacillus paracasei ssp paracasei in combination with bifidobacterium animalis ssp lactis in a prebiotic - containing infant formula: a randomised controlled trial. Br J Nutr. 2009, 102: 869-875. 10.1017/S0007114509289069.
Guarner F: Studies with Inulin-type fructans on intestinal infections, permeability and inflammation. J Nutr. 2007, 137 (Suppl 11): 2568S-2571S.
Cherbut C, Michel C, Raison V, Kravtchenko T, Severine M: Acacia gum is a bifidogenic dietary fibre with high digestive tolerance in healthy humans. Microb Ecol Health Dis. 2003, 15: 43-50. 10.1080/08910600310014377.
Chouraqui JP, Grathwohl D, Labaune JM, Hascoet JM, de Montgolger I, Leclaire M, Giarre M, Steenhout P: Assessment of the safety, tolerance and protective effect against diarrhoea of infant formulas containing mixtures of probiotics or probiotics and prebiotics in a randomized controlled trial. Am J Clin Nutr. 2008, 87: 1365-1373.
Puccio G, Cajozzo C, Meli F, Rochat F, Grathwohl D, Steenhout P: Clinical evaluation of a new starter formula for infants containing live Bifidobacterium longum BL999 and prebiotics. Nutrition. 2007, 23: 1-8. 10.1016/j.nut.2006.09.007.
Osborn DA, Sinn JKH: Prebiotics in infants for prevention of allergic disease and food hypersensitivity. Cochrane Database of Systematic Reviews: Reviews 2007. 2007, Chichester, UK: John Wiley & Sons, Ltd, pub2, Issue 4
Osborn DA, Sinn JKH: Probiotics in infants for prevention of allergic disease and food hypersensitivity. Cochrane Database of Systematic Reviews: Reviews 2007. 2007, Chichester, UK: John Wiley & Sons Ltd, Issue 4
Qiukui H, Zhenchan L, Rong DB, Quan HC, Taixiang W: Probiotics for preventing acute upper respiratory tract infections. Cochrane Database of Systematic Reviews: Reviews 2011. 2011, Chichester, UK: John Wiley & Sons Ltd, Issue 9
Allen SJ, Martinez EG, Gregorio GV, Dans LF: Probiotics for treating acute infectious diarrhoea. Cochrane Database of Systematic Reviews: Reviews 2010. 2010, Chichester, UK: John Wiley & Sons Ltd, Issue 11
Johnston BC, Goldenberg JZ, Vandvik PO, Sun X, Guyatt GH: Probiotics for the prevention of pediatric antibiotic-associated diarrhoea. Cochrane Database of Systematic Reviews: Reviews 2011. 2011, Chichester, UK: John Wiley & Sons Ltd, Issue 11
Higgins JPT, Green S: Cochrane Handbook for Systematic Reviews of Interventions. 2008, Chichester (UK): John Wiley & Sons
Moro G, Arslanoglu S, Stahl B, Jelinek J, Wahn U, Boehm G: A mixture of prebiotic oligosaccharides reduces the incidence of atopic dermatitis during the first six months of age. Arch Dis Child. 2006, 91: 814-819. 10.1136/adc.2006.098251.
Arslanoglu S, Moro GE, Boehm G: Early supplementation of prebiotic oligosaccharides protects formula-fed infants against infections during the first 6 months of life. J Nutr. 2007, 137: 2420-2423.
Arslanoglu S, Moro GE, Schmitt J, Tandoi L, Rizzardi S, Boehm G: Early dietary intervention with a mixture of prebiotic oligosaccharides reduces the incidence of allergic manifestations and infections during the first two years of life. J Nutr. 2008, 138: 1091-1095.
Moro G, Minoli I, Mosca M, Fanaro S, Jelinek K, Stahl B, Boehm G: Dosage-related bifidogenic effects of galacto- and fructooligosaccharides in formula-fed term infants. J Pediatr Gastroenterol Nutr. 2002, 34: 291-295. 10.1097/00005176-200203000-00014.
Moro GE, Mosca F, Miniello V, Fanaro S, Jelinek J, Stahl B, Boehm G: Effects of a new mixture of prebiotics on faecal flora and stools in term infants. Acta Paediatr Suppl. 2003, 92 (Suppl 441): 77-79.
Bettler J, Euler AR: An evaluation of the growth of term infants fed formula supplemented with fructooligosaccharide. Int J Probiotics Prebiotics. 2006, 1: 19-26.
Brunser O, Figueroa G, Gotteland M, Hascke-Becher E, Magliola C, Rochat F, Cruchet S, Palframan R, Gibson G, Chauffard F, Haschke F: Effects of probiotic or prebiotic supplemented milk formulas on fecal microbiota composition of infants. Asia Pac J Clin Nutr. 2006, 15: 368-376.
Bruzzese E, Volpicelli M, Squeglia V, Bruzzese D, Salvini F, Bisceglia M, Lionetti P, Cinquetti M, Giuseppe I, Amarri S, Guarino A: A formula containing galacto- and fructo-oligosaccharides prevents intestinal and extra-intestinal infections: an observational study. Clin Nutr. 2009, 28: 156-161. 10.1016/j.clnu.2009.01.008.
Chouraqui JP, Van Egroo LD, Fichot MC: Acidified milk formula supplemented with bifidobacterium lactis: impact on infant diarrhoea in residential care settings. J Pediatr Gastroenterol Nutr. 2004, 38: 288-292. 10.1097/00005176-200403000-00011.
Costalos C, Kapiki A, Apostolou M, Papathoma E: The effect of a prebiotic supplemented formula on growth and stool microbiology of term infants. Early Hum Dev. 2008, 84: 45-49. 10.1016/j.earlhumdev.2007.03.001.
Fanaro S, Jelinek J, Stahl B, Boehm G, Kock R, Vigi V: Acidic oligosaccharides from pectin hydrolysate as new component for infant formulae: effect on intestinal flora, stool characteristics and pH. J Pediatr Gastroenterol Nutr. 2005, 41: 186-190. 10.1097/01.mpg.0000172747.64103.d7.
Fanaro S, Marten B, Bagna R, Vigi V, Fabris C, Pena-Quintana L, Arguelles F, Scholz-Ahrens KE, Sawatzki G, Zelenka R, Schrezenmeir J, de Vrese M, Bertin E: Galactooligosaccharides are bididogenic and safe at weaning: a double-blind randomized multicenter study. J Pediatr Gastroenterol Nutr. 2008, 48: 82-88.
Gibson RA, Barclay D, Marshal H, Moulin J, Maire JC, Makrides M: Safety of supplementing infant formula with long chain polyunsaturated fatty acids and Bifidobacterium lactis in terms infants: a randomised controlled trial. Br J Nutr. 2009, 101: 1706-1713. 10.1017/S0007114508084080.
Haschke-Becher E, Brunser O, Cruchet S, Gotteland M, Haschke F, Bachmann C: Urinary D-lactate excretion in infants receiving lactobacillus johnsonii with formula. Ann Nutr Metab. 2008, 53: 240-244. 10.1159/000185642.
Langhendries JP, Detry J, van Hees J, Lambray JM, Darimont J, Mozin MJ, Secretin MC, Senterre J: Effect of a fermented infant formula containing viable bifidobacteria on the faecal flora composition and pH of healthy full- term infants. J Pediatr Gastroenterol Nutr. 1995, 2: 177-181.
Moro GE, Stahl B, Fanaro S, Jelinek J, Boehm G, Coppa G: Dietary prebiotic oligosaccharides are detectable in the faeces of formula-fed infants. Acta Paediatr. 2005, 94 (Suppl 449): 27-30.
Petschow BW, Figueroa R, Harris CL, Beck LB, Ziegler E, Goldin B: Effects of feeding an infant formula containing Lactobacillus GG on the colonization of the intestine. J Clin Gastroenterol. 2005, 39: 786-790. 10.1097/01.mcg.0000177245.53753.86.
Schmelzle H, Wirth S, Skopnik H, Radke M, Knol J, Böckler HM, Brönstrup A, Wells J, Fusch C: Randomized double blind study of the nutritional efficacy and bifidogenicity of a new infant formula containing partially hydrolyzed protein, a high beta-palmitic Acid level and nod digestible oligosaccharides. J Pediatr Gastroenterol Nutr. 2003, 36: 342-351.
Urban MF, Mokhachane M, Mphalele RM, Monaheng L, Beckh Arnold E, Cooper PA: Growth of infants born to HIV-infected women when fed a biologically acidified starter formula with and without probiotics. South Afr J Clin Nutr. 2008, 21: 28-32.
Weizman Z, Asli G, Alsheikh A: Effect of a probiotic infant formula on infections in child care centers: comparison of two probiotic agents. Pediatrics. 2005, 115: 5-9.
Weizman Z, Alsheikh A: Safety and tolerance of a probiotic formula in early infancy, comparing two probiotic agents: a Pilot study. J Am Coll Nutr. 2006, 25: 415-419.
Xiao-Ming B, Xiao-Yu Z, Wei-Hua Z, Wen-Liang Y, Wei P, Wei-li Z, Sheng-Mei W, Van Beusekom CM, Schaafsma A: Supplementation of milk formula with galactooligosaccharides improves intestinal micro-flora and fermentation in term infants. Chin Med J. 2004, 117: 927-931.
Xiao-Ming B, Li J, Feng Z-T, Shi S-Y, Lu Y-D, Chen R, Zhou XY: Low level of galactooligosaccharide in infant formula stimulated growth of intestinal bifidobacteria and lactobacilli. World J Gastroenterol. 2008, 14: 6564-6568. 10.3748/wjg.14.6564.
Ziegler EE, Jeter JM, Drulis JM, Nelson SE, Haschke F, Steenbout P, Brown C, Maire JC, Hager C: Formula with reduced content of improved, partially hydrolyzed protein and probiotics: infant growth and health. Monatsschr Kinderheilkd. 2003, 151 (Suppl 1): S65-S71.
Ziegler E, Vanderhoof JA, Petschow B, Mitmesser SH, Stolz S, Harris CL, Berseth CL: Term infants fed formula supplemented with selected blends of prebiotics grow normally and have soft stools similar to those reported for breast-fed infants. J Pediatr Gastroenterol Nutr. 2007, 44: 359-364. 10.1097/MPG.0b013e31802fca8c.
Agustina R, Lukito W, Firmansyah A, Suhardjo HN, Murniati D, Bindels J: The effect of early nutritional supplementation with a mixture of probiotic, prebiotic, fiber and micronutrients in infants with acute diarrhoea in Indonesia. Asia Pac J Clin Nutr. 2007, 16: 435-442.
Allen SJ, Jordan S, Storey M, Thornton CA, Gravenor M, Garaiova I, Plummer SF, Wang D, Morgan G: Dietary supplementation with Lactobacilli and Bifidobacteria is well tolerated and not associated with adverse events during late pregnancy and early infancy. J Nutr. 2010, 140: 483-488. 10.3945/jn.109.117093.
Alliet P, Scholten P, Raes M, Hensen K, Jongen H, Rummens JL, Boehm G, Vandenplas Y: Effect of prebiotic galacto-oligosaccharide, long-chain fructooligosaccharide infant formula on serum cholesterol and triacyglycerol levels. Nutrition. 2007, 23: 719-723. 10.1016/j.nut.2007.06.011.
Bakker-Zierikzee AM, Alles MS, Knol J, Kok FJ, Tolboom JJM, Bindels JG: Effects of infant formula containing a mixture of galacto - and fructo-oligosaccharides or viable Bifidobacterium animalis on the intestinal microflora during the first 4 months of life. Br J Nutr. 2005, 94: 783-790. 10.1079/BJN20051451.
Bakker-Zierikzee AM, van Tol EAF, Kroes H, Alles MS, Kok FJ, Bindels JG: Faecal SIgA secretion in infants fed on pre- or probiotic infant formula. Pediatr Allergy Immunol. 2006, 17: 134-140. 10.1111/j.1399-3038.2005.00370.x.
Baldeon ME, Naranjo G, Granja D: Effect of infant formula with probiotics on intestinal microbiota. Arch Latinoam Nutr. 2008, 58 (1): [ISSN 0004–0622]-
Bongers MEJ, de Lorijn F, Reitsma JB, Groeneweg M, Taminiau JAJM, Benninga MA: The clinical effect of a new infant formula in term infants with constipation: a double-blind, randomized cross-over trial. Nutrition Journal. 2007, 6: http://www.nutritionj.com/content/6/1/8,
Brunser O, Araya M, Espinoza J, Guesry PR, Secretin MC, Pacheco I: Effect of an acidified milk on diarrhoea and the carrier state in infants of low socio-economic stratum. Acta Pediatr Scand. 1989, 78: 259-264. 10.1111/j.1651-2227.1989.tb11066.x.
Chandra RK: Effect of Lactobacillus on the incidence and severity of acute rotavirus diarrhoea in infants. A prospective placebo-controlled double-blind study. Nutr Res. 2002, 22: 65-69. 10.1016/S0271-5317(01)00367-0.
Correa NBO, Filho LAP, Penna FJ, Lima FMLS, Nicoli JR: A randomized formula controlled trial of Bifidobacterium lactis and Streptococcus thermophilus for prevention of antibiotic associated diarrhoea in infants. J Clin Gastrotenterol. 2005, 39: 385-389. 10.1097/01.mcg.0000159217.47419.5b.
Decsi T, Arató A, Balogh M, Dolinay T, Kanjo AH, Szabó É, Várkonyi Á: Randomised placebo controlled double blind study on the effect of prebiotic oligosaccharides on intestinal flora in healthy infants [Prebiotikus hatású oligoszacharidok egészséges csecsemok székletflórájára gyakorolt hatásának randomizált, placébóval kontrollált vizsgálata]. Orvosi Hetilap. 2005, 146: 2445-2450.
Euler AR, Mitchell DK, Kline R, Pickering LK: Prebiotic effect of fructooligosaccharide supplemented term infant formula at two concentrations compared with unsupplemented formula and human milk. J Pediatr Gastroenterol Nutr. 2005, 40: 157-164. 10.1097/00005176-200502000-00014.
Hol JB, van Leer EHG, Schuurman BEE, de Ruiter LF, Samson JN, Hop W, Neijens HJ, de Jongste JC, Nieuwenhuis EES: The acquisition of tolerance towards cow's milk through probiotic supplementation: a randomized controlled trial. J Allergy Clin Immunol. 2008, 121: 1448-1454. 10.1016/j.jaci.2008.03.018.
Isolauri E, Arvola T, Sutas Y, Moilanen E, Salminen S: Probiotics in the management of atopic ezema. Clin Exp Allergy. 2000, 30: 1604-1610.
Kim SH, Lee DH, Meyer D: Supplementation of infant formula with native inulin has a prebiotic effect in formula-fed babies. Asia Pac J Clin Nutr. 2007, 16: 172-177.
Knol J, Scholtens P, Kafka C, Steenbakkers J, Grob S, Helm K, Klarczyk M, Schopfer H, Bockler HM, Wells J: Colon microflora in infants fed formula with galacto- and fructo-oligosaccharides: more like breast fed infants. J Pediatr Gastroenterol Nutr. 2005, 40: 36-42. 10.1097/00005176-200501000-00007.
Kuitunen M, Kukkonen K, Savilahti E: Pro- and prebiotic supplementation induces a transient reduction in Hemoglobin concentration in infants. J Pediatr Gastroenterol Nutr. 2009, 49: 626-630. 10.1097/MPG.0b013e31819de849.
Kukkonen K, Savilahti E, Haahtela T, Juntunen-Backman K, Korpela R, Poussa T, Tuure T, Kuitunen M: Probiotics and prebiotic galacto-oligosaccharides in the prevention of allergic diseases: a randomized, double-blind placebo-controlled trial. J Allergy Clin Immunol. 2007, 119: 192-198. 10.1016/j.jaci.2006.09.009.
Kukkonen K, Savilahti E, Haahtela T, Juntumen-Backman K, Korpela R, Poussa T, Tuure T, Kuitunen M: Long-term safety and impact on infection rates of postnatal probiotic and prebiotic (synbiotic) treatment: randomized, double-blind, placebo-controlled trial. Pediatrics. 2008, 122: 8-12. 10.1542/peds.2007-1192.
Magne F, Hachelaf W, Suau A, Boudras G, Bouziane Nedjadi K, Rigottier Gois L, Touhami M, Desjeux JF, Pochart P: Effects on faecal microbiota of dietary and acidic oligosaccharides in children during partial formula feeding. J Pediatr Gastroenterol Nutr. 2008, 46: 580-588. 10.1097/MPG.0b013e318164d920.
Mah KW, Chin Vanessa IL, Wong WS, Lay C, Tannock G, Shek LP, Aw MAW, Chua KY, Wong HB, Panchalingham A, Lee BW: Effect of a milk formula containing probiotics on the fecal microbiota of Asian infants at risk of Atopic diseases. Pediatric Research. 2007, 62: 674-679. 10.1203/PDR.0b013e31815991d5.
Nopchinda S, Varavithya W, Phuapradit P, Sangchai R, Suthutvoravut U, Chantraruksa V, Haschke F: Effect of Bifidobacterium Bb12 with or without Streptococcus thermophilus supplemented formula on nutritional status. J Med Assoc Thai. 2002, 85 (Suppl 4): S1225-S1231.
Panigrahi P, Parida S, Pradhan L, Mohapatra SS, Misra PR, Johnson JA, Chaudry R, Taylor S, Hansen NI, Gewolb IH: Long-term colonization of a Lactobacillus plantarum synbiotic preparation in the neonatal gut. J Pediatr Gastroenterol Nutr. 2009, 47: 45-53.
Rautava S, Salminen S, Isolauri E: Specific probiotics in reducing the risk of acute infections in infancy - a randomised controlled, double-blind, placebo-controlled study. Br J Nutr. 2009, 101: 1722-1726. 10.1017/S0007114508116282.
Rigo J, Pieltain C, Studzinski F: Growth, weight gain composition and mineral accretion in term infants fed a new experimental formula containing hydrolysed protein, beta palmitate and prebiotics. Pediatrika. 2001, 21: 387-396.
Rinne MM, Gueimonde M, Kalliomaki M, Hoppu U, Salminen SJ, Isolauri E: Similar bifidogenic effects of prebiotic-supplemented partially hydrolyzed infant formula and breastfeeding on infant gut microbiota. FEM Immunol Med Microbiol. 2005, 43: 59-65. 10.1016/j.femsim.2004.07.005.
Rinne M, Kalliomaki M, Salminen S, Isolauri E: Probiotic intervention in the first months of life: Short-term effects on gastrointestinal symptoms and long-term effects on gut microbiota. J Pediatr Gastroenterol Nutr. 2006, 43: 200-205. 10.1097/01.mpg.0000228106.91240.5b.
Rivero M, Chifre R, Roca A, Conde M, Rodriguez M, Sanamaria A: Effect of a new infant formulae enriched prebiotics, probiotics, nucleotides and LC-PUFA on infants recovery after an infection. [Abstract PC28]. J Pediatr Gastroenterol Nutr. 2004, 39 (Suppl 1): S522-
Saavedra JM, Abi-Hanna A, Moore N, Yolken RH: Long-term consumption of infant formulas containing live probiotic bacteria: tolerance and safety. Am J Clin Nutr. 2004, 79: 261-267.
Savino F, Cresi F, Maccario S, Cavallo F, Dalmasso P, Fanaro S, Oggero R, Vigi V, Silvestro L: Minor feeding problems during the first months of life: effect of a partially hydrolysed milk formula containing fructo- and galacto-oligosaccharides. Acta Paediatr Suppl. 2003, 92 (Suppl 441): 86-90.
Sepp E, Mikelsaar M, Salminen S: Effect of Administration of Lactobacillus casei strain GG on the gastrointestinal microbiota of newborns. Microb Ecol Health Dis. 1993, 6: 309-314. 10.3109/08910609309141340.
Thibault H, Aubert-Jacquin C, Goulet O: Effects of long-term consumption of a fermented infant formula (with Bifidobacterium breve c50 and Streptococcus thermophilus 065) on acute diarrhoea in health infants. J Pediatr Gastroenterol Nutr. 2004, 38: 147-152.
Urao M, Fujimoto T, Lane G, Seo I, Miyano T: Does probiotics administration decrease serum endotoxin levels in infants. J Pediatr Surg. 1999, 34: 273-276. 10.1016/S0022-3468(99)90189-6.
van der Aa LB, Heymans HS, van Aalderen WM, Smitt JHS, Knol J, Amor KB, Goosens DA, Sprikkleman AB, Synbad study group: Effect of a new synbiotic mixture on atopic dermatitis in infants: A randomized controlled trial. Clin Exp Allergy. 2010, 40: 795-804.
Velaphi SC, Cooper PA, Bolton K, Mokhachane M, Mphahlele RM, Beckh-Arnold E, Monaheng L, Hascke-Becher E: Growth and metabolism of infants born to women infected with human immunodeficiency virus and fed acidified whey adapted starter formulas. Nutrition. 2008, 24: 203-211. 10.1016/j.nut.2007.11.002.
Vendt N, Grunberg H, Tuure T, Malminiemi O, Wuolijoki E, Tillmann V, Sepp E, Korpela R: Growth during the first 6 months of life in infants using formula enriched with Lactobacillus rhamnosus GG: double blind, randomized trial. J Hum Nutr Dietet. 2006, 19: 51-58. 10.1111/j.1365-277X.2006.00660.x.
Connolly E, Vesikari T, Karvonen AV, Sinkiewicz G: Safety and colonization of the probiotic Lactobacillus reuteri ATCC 55730 in newborn infants and premature infants. Clinical study 1. 1999, Stockholm, Sweden: BioGaia AB Research Laboratories, Unpublished
Connolly E, Vesikari T, Karvonen AV, Sinkiewicz G: Safety and colonization of the probiotic Lactobacillus reuteri ATCC 55730 in newborn infants and premature infants. Clinical study 2. 2001, Stockholm, Sweden: BioGaia AB Research Laboratories, Unpublished
ESPGHAN Committee on Nutrition: Probiotic Bacteria in dietetic products for infants: a commentary by the ESPGHAN Committee on Nutrition. J Pediatr Gastroenterol Nutr. 2004, 38: 365-374. 10.1097/00005176-200404000-00001.
Cabana MD, Cruz H: Growth of infants fed new starter formula. http://www.clinicaltrials.gov. Identifier: NCT01079208
Zegerman C: Evaluation of the effect of milk based infant formula supplemented either with probiotic microorganisms and/or with prebiotic on the intestinal microflora during the first 4 months of life of healthy, full term infants and its long term effect on morbidity up to the age of 9 months. http://www.clinicaltrials.gov. Identifier: NCT00836771
Ye Lee L: Growth of infants consuming starter formula containing Synbiotics. http://www.clinicaltrials.gov. Identifier: NCT01010113
World Health Organisation: Infant and young child feeding: model chapter for textbooks for medical students and allied health professionals. http://whqlibdoc.who.int/publications/2009/9789241597494_eng.pdf,
Acknowledgments
This review was supported through a grant from the University of Stellenbosch, Faculty of Medicine and Health Sciences. South Africa. The sponsors had no role in study design, data collection, analysis and interpretation, report writing or conclusions reached in this review.
Author information
Authors and Affiliations
Corresponding author
Additional information
Competing interests
All reviewers declared no competing interests.
Authors’ contributions
The reviewers contributed the following: MM: Developed review protocol (unpublished), selected RCTs, conducted data extraction, assessment of risk of bias in included studies, developed, edited and critically reviewed the manuscript. ML: Selected RCTs, conducted data extraction, assessment of risk of bias in included studies, critically reviewed the manuscript. AM: Conducted the statistical analysis, interpretation of results and critically reviewed the manuscript. TY: Assisted in designing the review and critically reviewed the manuscript. RB: Assisted in designing the review and critically reviewed the manuscript. All authors’ read and approved the final manuscript.
Authors’ original submitted files for images
Below are the links to the authors’ original submitted files for images.
Rights and permissions
This article is published under license to BioMed Central Ltd. This is an Open Access article distributed under the terms of the Creative Commons Attribution License (http://creativecommons.org/licenses/by/2.0), which permits unrestricted use, distribution, and reproduction in any medium, provided the original work is properly cited.
About this article
Cite this article
Mugambi, M.N., Musekiwa, A., Lombard, M. et al. Synbiotics, probiotics or prebiotics in infant formula for full term infants: a systematic review. Nutr J 11, 81 (2012). https://doi.org/10.1186/1475-2891-11-81
Received:
Accepted:
Published:
DOI: https://doi.org/10.1186/1475-2891-11-81