Abstract
Background
Duikers in the subfamily Cephalophinae are a group of tropical forest mammals believed to have first originated during the late Miocene. However, knowledge of phylogenetic relationships, pattern and timing of their subsequent radiation is poorly understood. Here we present the first multi-locus phylogeny of this threatened group of tropical artiodactyls and use a Bayesian uncorrelated molecular clock to estimate divergence times.
Results
A total of 4152 bp of sequence data was obtained from two mitochondrial genes and four nuclear introns. Phylogenies were estimated using maximum parsimony, maximum likelihood, and Bayesian analysis of concatenated mitochondrial, nuclear and combined datasets. A relaxed molecular clock with two fossil calibration points was used to estimate divergence times. The first was based on the age of the split between the two oldest subfamilies within the Bovidae whereas the second was based on the earliest known fossil appearance of the Cephalophinae and molecular divergence time estimates for the oldest lineages within this group. Findings indicate strong support for four major lineages within the subfamily, all of which date to the late Miocene/early Pliocene. The first of these to diverge was the dwarf duiker genus Philantomba, followed by the giant, eastern and western red duiker lineages, all within the genus Cephalophus. While these results uphold the recognition of Philantomba, they do not support the monotypic savanna-specialist genus Sylvicapra, which as sister to the giant duikers leaves Cephalophus paraphyletic. BEAST analyses indicate that most sister species pairs originated during the Pleistocene, suggesting that repeated glacial cycling may have played an important role in the recent diversification of this group. Furthermore, several red duiker sister species pairs appear to be either paraphyletic (C.callipygus/C. ogilbyi and C. harveyi/C. natalensis) or exhibit evidence of mitochondrial admixture (C. nigrifrons and C. rufilatus), consistent with their recent divergence and/or possible hybridization with each other.
Conclusions
Molecular phylogenetic analyses suggest that Pleistocene-era climatic oscillations have played an important role in the speciation of this largely forest-dwelling group. Our results also reveal the most well supported species phylogeny for the subfamily to date, but also highlight several areas of inconsistency between our current understanding of duiker taxonomy and the evolutionary relationships depicted here. These findings may therefore prove particularly relevant to future conservation efforts, given that many species are presently regulated under the Convention for Trade in Endangered Species.
Background
The Equatorial forests of central Africa are one of the most biologically diverse regions in the world. Understanding the mechanisms that gave rise to such extraordinary tropical diversity remains a subject of intense interest to evolutionary and conservation biologists [1, 2]. Critical to this debate has been the role that Pleistocene climate change has played in tropical vertebrate speciation. The periodic fluctuations in climatic conditions that resulted from Earth’s orbital shifts are well known to have affected the range dynamics of many temperate taxa [3]. However, the extent to which these fluctuations impacted the distribution and diversification of tropical forest taxa has been a subject of intense debate. Proponents of Pleistocene refuge theory (e.g. [4]) have argued that the drier, cooler temperatures experienced during successive glacial maxima led to the repeated fragmentation of formerly contiguous forests, which in turn led to allopatric speciation of forest-associated taxa. Although there is currently little evidence to suggest that tropical forest refugia played a major role in the Amazon [5–7], support for their role as drivers of evolutionary diversification in tropical Africa is much greater (e.g. [8–12]). However, the majority of studies to date suggest that these effects are most evident at the population level [8, 11–16] but see [17] with most species divergence times pre-dating the Pleistocene [18–20].
The duikers in the subfamily Cephalophinae (family Bovidae) constitute an ideal group for testing the role of Pleistocene refugia in tropical vertebrate speciation because of their recent origin in the Late Miocene and subsequent rapid radiation [21, 22]. Currently, three duiker genera are recognized: (a) the recently derived, species-rich, forest dwelling Cephalophus (b) the dwarf Philantomba and (c) the monotypic savanna specialist Sylvicapra. Jansen van Vuuren and Robinson [22] have further sub-divided Cephalophus into three major mitochondrial lineages comprising the giant duikers (C. silvicultor, C. spadix, C. dorsalis, and C. jentinki), east African red duikers (C. leucogaster, C. rufilatus, C. nigrifrons, C. natalensis, C. rubidus, and C. harveyi) and west African red duikers (C. callipygus, C. weynsi, C. ogilbyi, and C. niger). To date, support for these lineages has been based solely on single mitochondrial gene genealogies that may not accurately reflect the evolutionary history of this group. Furthermore, the position of the two remaining taxa, C. adersi and C. zebra, remains unresolved and appears to be highly labile between studies [22–24].
The goal of the present study is therefore to estimate a well-supported species tree for duikers using a combination of mitochondrial genes and nuclear introns previously shown to be highly informative in resolving relationships between other closely-related African bovids [25, 26]. We then use this tree to re-evaluate the evolutionary relationships of major lineages within this group and test the hypothesis that speciation of many duikers occurred during the Pleistocene epoch using a fossil calibrated relaxed molecular clock [27].
Results
The final aligned data matrix contained four unlinked nuclear DNA regions and two mitochondrial DNA regions for a total of 4152 characters, of which 1172 were from mitochondrial and 2980 were from nuclear loci (Table 1). Results from the pair-wise ILD test between the two mitochondrial partitions fail to reject the null hypothesis that both loci are congruent. As expected, the mitochondrial partition contained a greater proportion of variable sites (38%) relative to the nuclear matrix (15%). The mitochondrial partition contained 368 parsimony informative characters (31%) while the nuclear partition contained 208 parsimony informative characters (8%). The consistency index (CI) and retention index (RI) values in the mitochondrial partition (CI: 0.417, RI: 0.621) are lower than those of the nuclear matrix (CI: 0.823, RI: 0.846), indicating higher levels of homoplasy in the mitochondrial dataset.
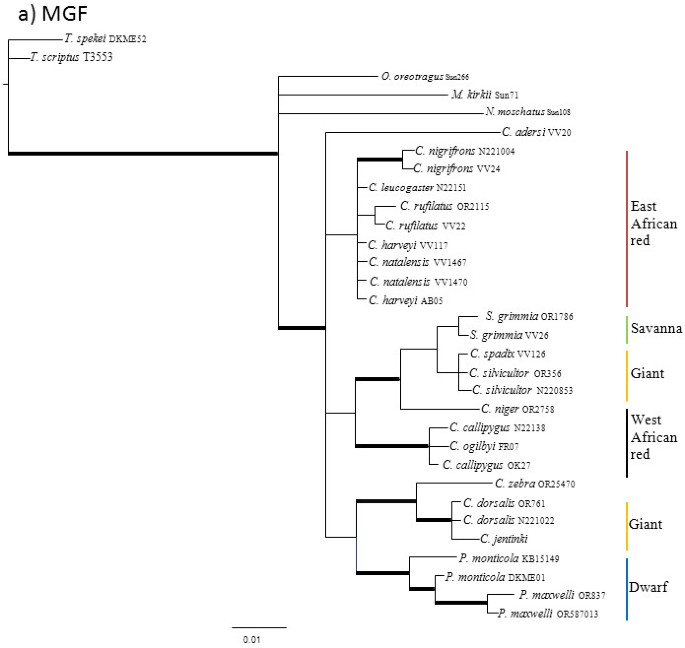
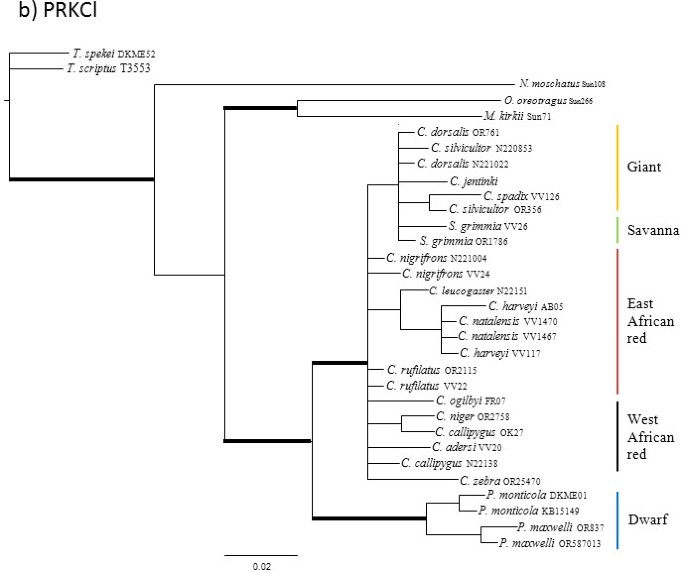
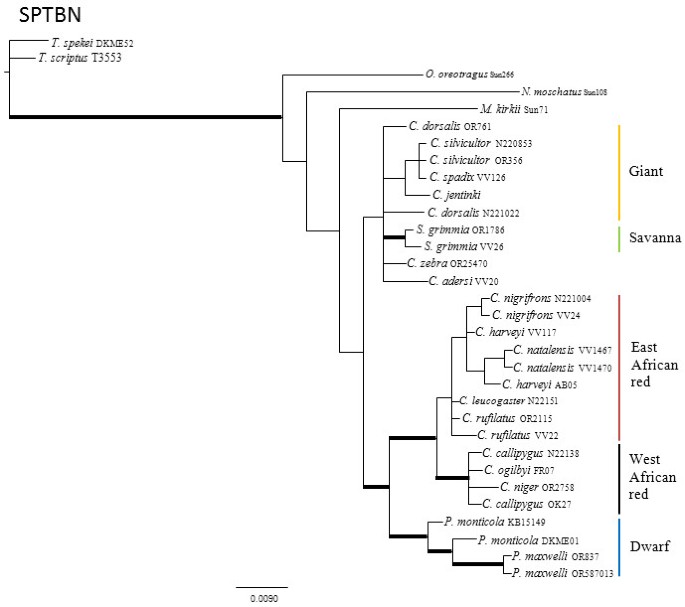
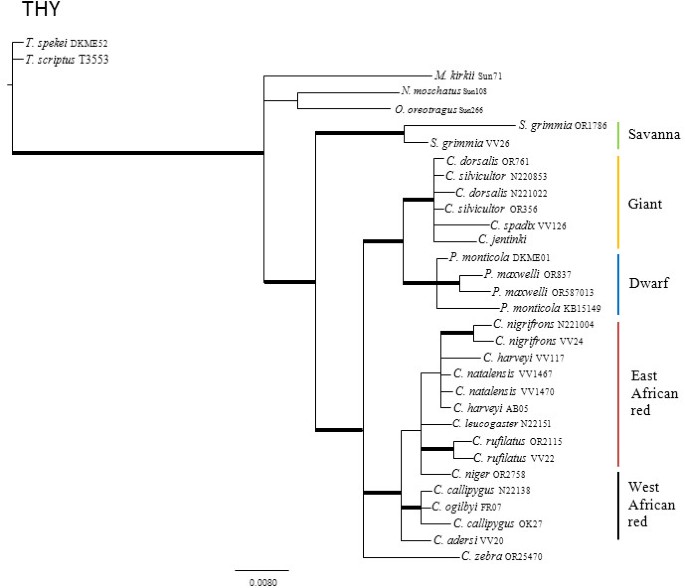
The results of the pair-wise ILD tests between nuclear loci reject the null hypotheses that the four nuclear genes are congruent with one another (p < 0.10). Individual nuclear gene genealogies estimated using Maximum Parsimony (MP), Maximum Likelihood (ML) and Bayesian Analysis (BA) methods recovered different topologies (Figures 1, 2, 3 and 4; Additional file 1 for node support values) and these differences were evident regardless of method. Given that there was generally little support for most of the nodes within the individual nuclear gene trees, many of these differences between gene genealogies likely represent soft polytomies. However, there is also significant support for some of these differences. For example, the MGF genealogy supports two clades of giant duikers (MP bootstrap = 63% and 94%, ML bootstrap = 75% and 92%, BA posterior probability = 0.99 and 1.00) while the THY genealogy supports only one clade (MP = 84, ML = 85, BA = 0.99). The THY genealogy also supports the placement of S. grimmia as sister to the remaining Cephalophinae (MP = 90, ML = 91, BA = 1.00) with Philantomba sister to the giant duikers (MP = 89, ML = 93, BA = 1.00), unlike the PRKCl genealogy, which supports Philantomba as sister to the remaining Cephalophinae (MP = 83, ML = 81, BA = 1.00) or the SPTBN genealogy, which supports Philantomba as sister to only the red duiker clades (MP = 73, ML = 76, BA = 1.00).
MGF gene genealogy. Majority-rule consensus tree showing the Bayesian estimate of nuclear gene trees for MGF. Thickened branches indicate nodal support by both BA posterior probability (PP) values ≥ 0.95 and ML bootstrap support (BS) ≥ 75. Additional file 1: Table S1 lists support values by node for this phylogeny.
PRKCl gene genealogy. Majority-rule consensus tree showing the Bayesian estimate of nuclear gene trees for PRKCl. Thickened branches indicate nodal support by both BA posterior probability (PP) values ≥ 0.95 and ML bootstrap support (BS) ≥ 75. Additional file 1: Table S1 lists support values by node for this phylogeny.
SPTBN gene genealogy. Majority-rule consensus tree showing the Bayesian estimate of nuclear gene trees for SPTBN. Thickened branches indicate nodal support by both BA posterior probability (PP) values ≥ 0.95 and ML bootstrap support (BS) ≥ 75. Additional file 1: Table S1 lists support values by node for this phylogeny.
THY gene genealogy. Majority-rule consensus tree showing the Bayesian estimate of nuclear gene trees for THY. Thickened branches indicate nodal support by both BA posterior probability (PP) values ≥ 0.95 and ML bootstrap support (BS) ≥ 75. Additional file 1: Table S1 lists support values by node for this phylogeny.
All four genealogies support the monophyly of Philantomba (MGF: MP = 95%, ML = 95%, BA =1.0; PRKCl: MP = 96%, ML = 100%, BA = 1.0; STBN1: MP = 97%, ML = 97%, BA = 1.0; THY: MP = 83%, ML = 87%, BA = 1.0). Sylvicapra was sister to some or all of the giant duikers in three of the four nuclear trees (MGF: MP = 66%, BA = 0.52%; PRKCl: ML = 54%, BA = 0.61; STNB1: MP = 60%, ML = 56%, BA = 0.97) but this relationship lacked significant support. Within Cephalophus, support was generally weak or lacking for the giant, east and west African red duiker lineages described by van Vuuren and Robinson [22] although the STBN1 genealogy supported the monophyly of the west African red duiker lineage (MP = 85%, ML = 88%, BA = 1.0) and the THY genealogy recovered the giant duiker lineage (MP = 84%, ML = 85%, BA = 0.99). The position of C. adersi and C. zebra varied across genealogies and remained unresolved or weakly supported, with the exception of the MGF genealogy which supported C. zebra as sister to the C. jentinki/C. dorsalis clade (MP = 94%, ML = 92%, BA = 1.0) and the THY genealogy which supported C. adersi as sister to the east and west African red duikers (MP = 82%, ML = 80%, BA = 1.0).
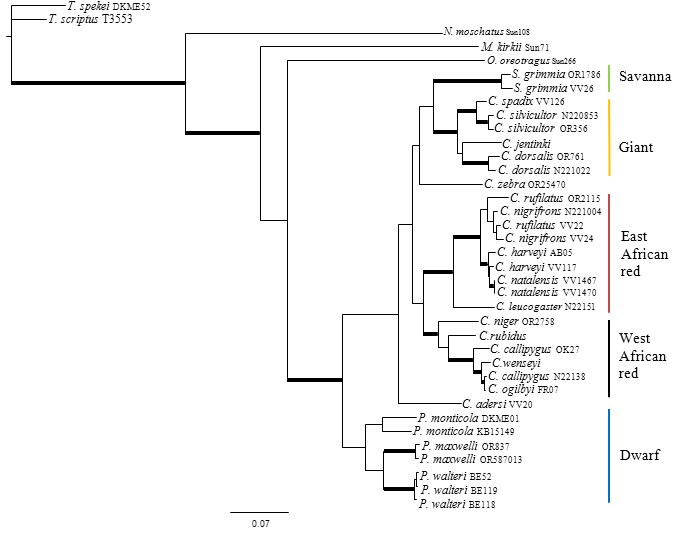
As results from ILD and SH tests suggested that the mitochondrial and nuclear topologies are incongruent (p ≤ 0.006), both datasets were first analysed separately and then combined. The mitochondrial tree of all species within Cephalophinae (Figure 5) shows weak support for the monophyly of Philantomba (MP = 88%, ML = 53%, BA = 0.76), but has strong support for the sister placement of these taxa relative to all other Cephalophinae (MP = 68%, ML = 91%, BA = 1.0). Sylvicapra is sister to the giant duikers, although this node has weak support (MP = 32%, ML = 58%, BA = 0.84). Within Cephalophus, there is strong support for the monophyly of the giant duikers (MP = 98%, ML = 97%, BA = 1.0%), the east African red duikers (MP = 93%, ML = 98%, BA = 1.0), and the west African red duikers (MP = 87%, ML = 83%, BA = 0.99), but weak support for their placement relative to one another. The position of C. zebra and C. adersi is unresolved. There is also weak support for the paraphyly of C. rufilatus relative to C. nigrifrons (MP = 59%, ML = 44%, BA = 0.87) and strong support for the paraphyly of C. callipygus relative to C. ogilbyi and C. weynsi (MP = 98%, ML = 97, BA = 1.0).
Mitochondrial gene genealogy. Majority-rule consensus tree showing the Bayesian estimate of the complete mitochondrial dataset. Thickened branches indicate nodal support by both BA posterior probability (PP) values ≥ 0.95 and ML bootstrap support (BS) ≥ 75. Additional file 1: Table S1 lists support values by node for this phylogeny.
In nuclear concatenated matrices, the harmonic mean of the log likelihood of the partitioned combined mitochondrial and nuclear Bayesian analysis (hm2) was equal to −15370.43 compared to the log likelihood for the unpartitioned analysis (hm1) of −15851.64, giving a value of 2 ln BF = −962.42 and providing strong evidence against a partitioned model. Alternatively, when the mitochondrial data are excluded from analyses, Bayes Factor analysis found strong evidence for the partitioned model (hm2 = −8088.25, hm1 = −7976.32, 2 ln BF = 223.86).
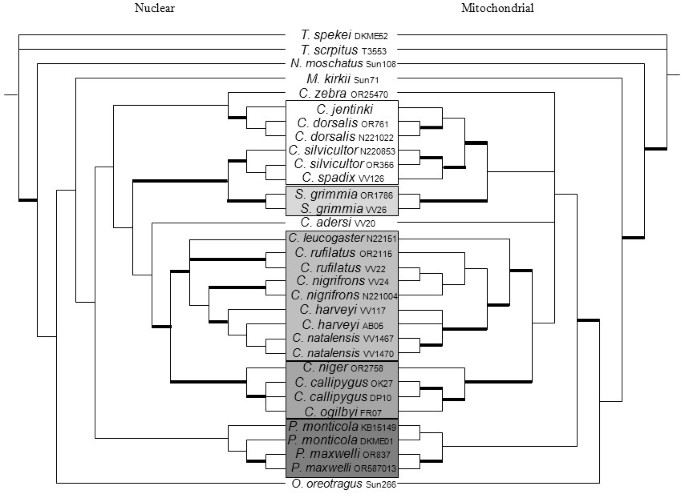
The concatenated nuclear tree (Figure 6) shows strong support for the monophyly of Philantomba (MP bootstrap = 100%, ML un-partitioned/partitioned bootstrap = 100/100, BA un-partitioned/partitioned posterior probability = 1.0/1.0). However, the sister position of this genus relative to the other duikers is not supported. Nuclear analyses also support a sister relationship between Sylvicapra and the C. silvicultor/C. spadix group (MP = 75%, ML = 66/75%, BA = 1.0/0.98), making both the genus Cephalophus and the giant duiker lineage paraphyletic. There is also support for the monophyly of the east African red duiker lineage (MP = 91%, ML = 91/98%, BA = 0.99/1.0), the west African red duiker lineage (MP = 67%, ML = 75/86%, BA = 1.0/1.0), and a sister relationship between these two red African duiker lineages (MP = 95%, ML = 100%/100%, BA = 1.0/0.82). Cephalophus adersi is sister to both the east and west African red duikers (MP = 60%, ML = 93/91%, BA = 0.93/0.74) and C. zebra is sister to the C. jentinki/C. dorsalis group (MP = 77%, ML = 59/70%, BA = 1.0/0.98). Unlike the mitochondrial tree, C. rufilatus and C. nigrifrons form reciprocally monophyletic clades (MP = 86%, ML = 82/95%, BA = 1.0/1.0 and MP = 99%, ML = 99/100%, BA = 1.00, respectively) in the nuclear tree. However, C. harveyi is paraphyletic with respect to C. natalensis, as is P. monticola to P. maxwelli. Finally, C. callipygus and C. ogilbyi form an unresolved polytomy.
Combined nuclear tree. Majority-rule consensus cladogram showing the Bayesian estimate of the species tree from nuclear concatenated (left) and mitochondrial datasets. Thickened branches nodal indicate support by both BA posterior probability (PP) values ≥ 0.95 and ML bootstrap support (BS) ≥ 75. Additional file 1: Table S1 lists support values by node for this phylogeny. Boxes show major lineages on a grey scale, starting with the giant duikers in white, then the savannah duiker, the east African red duikers, the west African red duikers, and the dwarf duikers in darkest grey.
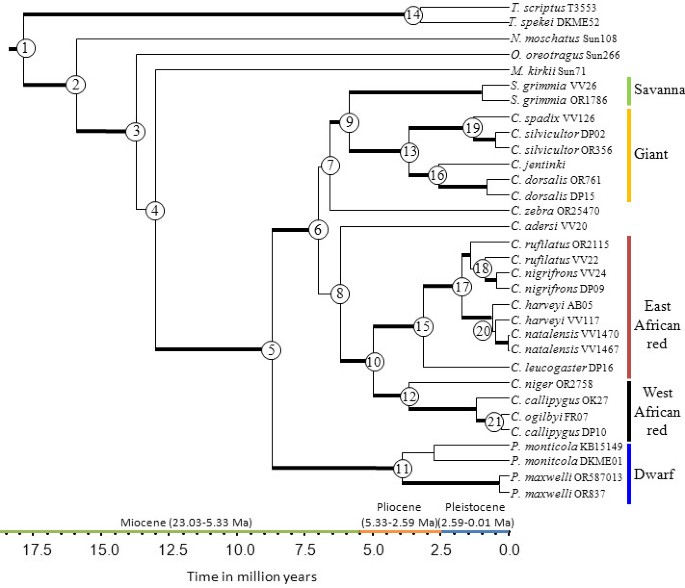
The concatenated mitochondrial and nuclear combined analysis yielded an almost completely resolved tree topology (Figure 7). Philantomba is both monophyletic and sister to the remainder of the Cephalophinae. Cephalophus was paraphyletic, with Sylvicapra as sister to the monophyletic giant duiker clade. The east and west African red duiker lineages are monophyletic and are sister to one another. While their placement is not strongly supported by all methods of estimation, Bayesian support places C. adersi as sister to the east and west African red duiker lineages (MP = 61%, ML = 73/65%, BA = 1.0/0.98). Placement of C. zebra as sister to the giant and savanna duiker lineages is not supported.
Species tree. Chronogram illustrating species relationships and divergence times based on Bayesian analysis of the total evidence (i.e. concatenated mitochondrial and nuclear DNA). Node numbers refer to divergence time estimations given in Table 2. Thickened branches indicate nodal support by both BA posterior probability (PP) values ≥ 0.95 and ML bootstrap support (BS) ≥ 75. Additional file 1: Table S1 lists support values by node for this phylogeny.
Analyses in BEAST recovered the same topologies as those obtained by BA methods. However, the tree estimated using both nuclear and mitochondrial data was better resolved with higher support and narrower confidence intervals than the tree estimated from nuclear analysis alone. For this reason, we discuss only the results of estimation from both nuclear and mitochondrial data, although ages for nodes recovered in both analyses are presented in Table 2. The split of Philantomba from all other members of the Cephalophinae was estimated to have occurred during the late Miocene at 8.73 Ma (6.27-11.43 highest posterior density, HPD). This is followed by the divergence of the giant duiker and Sylvicapra lineage from the red duikers at 7.03 Ma (5.02-9.19 HPD), with C. zebra and C. adersi occupying a sister position relative to these two major groups. This major split is then followed by a subsequent split between the east and west African red duiker lineages at 4.98 Ma (3.58-6.69 HPD) during the Pliocene. With the exception of the dwarf duikers P. monticola and P. maxwelli all sister duikers species are estimated to have originated during the Pleistocene (< 2.558 Ma). These sister species pairs comprise C. jentinki and C. dorsalis, C. nigrifrons and C. rufilatus, C. natalensis and C. harveyi, C. spadix and C. silvicultor, and C. callipygus and C. ogilbyi.
Discussion
Past attempts to reconstruct the evolutionary history of the Cephalophinae have met with considerable challenge [22–24], likely owing to the recent and rapid radiation of this group [21, 22]. Using a combination of mitochondrial and nuclear markers, the present study provides the most well supported phylogeny to date. This study also provides convincing support for the position of Philantomba as sister to the remaining Cephalophinae and the recognition of the genus, as recommended by Jansen van Vuuren and Robinson [22]. In contrast, there is no support for Sylvicapra whose sister relationship to the giant duikers leaves Cephalophus paraphyletic. Instead, our findings suggests that S. grimmia represents the sole savanna-dwelling member of the giant duiker lineage within Cephalophus and likely evolved from a forest-dwelling common ancestor, further reinforcing Grubb's [28] belief that habitat transitions occur primarily from forest to savannah. While Jansen van Vuuren and Robinson [22] were correct in hypothesizing that the savannah duiker diverged early in the group’s evolutionary history, this study shows that its return to the savannah does not predate the appearance of other forest-dwelling taxa. The present phylogeny also provides much stronger support for the three main lineages of Cephalophus identified by Jansen van Vuuren and Robinson [22] and for the first time provides significant support for their placement relative to one another. The failure of this and earlier studies to place C. adersi and C. zebra in relation to these major lineages is more likely to be a reflection of the rapidity with which these older taxa may have radiated rather than a failure to resolve species nodes.
A comparison of the mitochondrial and nuclear DNA phylogenies also shed light on the evolutionary processes operating within this group. Because mitochondrial DNA has a quarter of the effective population size of nuclear DNA, mitochondrial haplotypes generally sort much more rapidly [29]. Thus, in recently diverged lineages it is expected that the paraphyly observed in mitochondrial DNA should would also be reflected in the nuclear data [30], as is observed for C. natalensis/C. harveyi and C. ogilbyi/C. callipygus. Incomplete lineage sorting would also explain the paraphyly observed in the nuclear DNA of species that exhibit reciprocally monophyletic relationships in mitochondrial analyses, as appears to be the case for C. sylvicapra/C. spadix and P. monticola/P. maxwelli. However, C. nigrifrons and C. rufilatus do not follow either of these patterns, exhibiting a paraphyletic relationship in mitochondrial analyses and a reciprocally monophyletic relationship in nuclear analyses. One explanation for these findings is that mitochondrial introgression between C. nigrifrons and C. rufilatus, followed by extensive back-crossing to the original parental taxa, may have obscured mitochondrial relationships but maintained their monophyly at the nuclear level. These two taxa occupy parallel distributions across central African, providing ample opportunities for hybridization. Interestingly, Bayesian analysis of the nuclear data provides support for a sister relationship between C. nigrifrons and the C. natalensis/C. harveyi clade, indicating that C. nigrifrons and C. rufilatus may not be sister taxa, as previously mitochondrial analyses suggest [22–24].
We also report the surprising finding that while the origin of most major lineages within the subfamily date to the late Miocene/early Pliocene, many duiker species arose during the Pleistocene. From the mid-Miocene climatic optimum onwards, the earth has experienced a gradual cooling trend that continued through the Plio-Pleistocene [31]. The onset of much drier, colder periods at the boundary between these two epochs and subsequent intensification of glacial cycles throughout the Pleistocene is thought to have provided important opportunities for the diversification and increased turnover of African vertebrate species, including many arid-adapted bovids [21, 32]. Grassland expansion during glacial maxima would have confined forest adapted species to fragments of suitable habitat and broken up the formerly contiguous Equatorial African rainforest belt into several major refugia to the west, center and east of Africa [33–35]. Such geographic isolation is thus postulated to have provided ideal opportunities for the allopatric fragmentation and speciation of tropical forest species [36]; reviewed in [9].
Despite the intrinsic appeal of this hypothesis, examples of Pleistocene-era tropical forest speciation are few. Opponents of tropical Pleistocene refuge theory have argued that many species divergence times pre-date the Pleistocene [37] or that forest refugia simply acted as reservoirs of genetic variation but did not drive speciation per se[20, 38]. Divergence times reported for many central African taxa support this claim [18–20, 26, 39]; but see [17], although there is ample evidence for intra-specific diversification within many groups including tropical forest mammals [3].
Although our results are surprising, the divergences times we observed here are also consistent with earlier estimates for this group [22]. Moreover, many sister species occupy neighbouring yet allopatrically distributed species ranges. This is witnessed by the east versus west and western central African (i.e. Congo Basin) distribution of C. spadix and its sister taxon C. silvicultor, a pattern mirrored by the intra-specific structure of the roan antelope (Hippotragus equinus) [40]. Similarly, we have also observed splits between taxa that occupy a west versus western central African distribution, notably: 1) C. jentinki (west African) from C. dorsalis (west and western central African) 2) C. ogilbyi (west and western central African) from C. callipygus (western central African) and 3) P. maxwelli (west Africa) and P. monticola (western central, eastern and South African). This pattern is similar to the diversification of the murid rodent (Praomys misonnei), a forest associated taxon whose intra-specific distribution is also believed to have been driven by allopatric speciation during refugial isolation [41]. Similarly, there is ample genetic evidence to suggest that the split between eastern and western gorillas (Gorilla gorilla) arose during the Pleistocene as a result of climate-induced changes in forest cover this period [13, 42]. Lastly, we also observed a pattern of north versus south speciation in the forest-dwelling C. nigrifrons and its savanna-dwelling sister species C. rufilatus, as well as an east versus south African species split between C. harveyi and C. natalensis. Remarkably, of these sister species pairs, it is only in the case of C. ogilbyi and C. callipygus that their ranges overlap. Taken together, these data strongly suggest a pattern of Pleistocene-era fragmentation that led to the distribution of the sister species pairs that we see today.
The divergence times of the duikers however contrasts with findings from another forest bovid subfamily (the Tragelaphini) whose estimated speciation times range across the Miocene and Pliocene between 13 to 3 Ma [26]. More recent studies of Tragelaphus scriptus also point to a large sub-specific diversification within this taxon whose timing might also have been driven by Pleistocene climate change [15]. This then raises the question of the nature of species boundaries within the Cephalophinae and other African bovids and whether the timing of the radiation observed here more accurately reflects sub-specific diversification and/or incipient speciation, as is evidenced by several instances of paraphyly and/or hybridization between sister taxa.
Unlike earlier studies of the subfamily, the present study is the first to use both nuclear and mitochondrial data to estimate a species tree, and a fossil calibration point to date divergence times of duikers to the Pleistocene. The pattern of vertebrate radiation observed here fits that advocated by Avise et al.[43] where it has been postulated that Pleistocene glaciations either initiated intra-specific differentiation or furthered the speciation of lineages whose origin predated the Pleistocene. Further work should therefore investigate the extent of gene flow between recently derived species and use a coalescent approach to assess divergence times within this group [44].
Conservation implications
An accurate estimation of a species tree is often a useful precursor for guiding conservation and management decisions [45]. Phylogenetic analysis in this study finds significant support for the recognition of a distinct west African red duiker taxon C. rubidus which is geographically-restricted and was previously treated as a subspecies of C. nigrifrons within the east African red duiker clade. This apparent conflict lends strength to Jansen van Vuuren & Robinson's [22] recommendation that this taxon should be managed as a distinct species, elevating its conservation status from threatened to endangered [46]. The relationship between C. callipygus and the CITES protected species C. ogilbyi also appears problematic. Inclusion of nuclear data further substantiates the lack of any clear genetic distinction between these two taxa and is consistent with a history of either recent or on-going hybridization and/or incomplete lineage sorting. Given the results of the present study, it seems unlikely that any mitochondrial or nuclear marker will be able to differentiate these two taxa, posing a challenge to the regulation of the bushmeat trade [24, 47] or wildlife monitoring studies of field collected feces [23]. Further work should explore patterns of range-wide population genetic variation between these two taxa in order to better understand their species status and potential for hybridization.
Conclusions
Fluctuations in climate and increasing aridity over the past few million years are thought to have played an important role in shaping diversification of many African taxa [21, 32, 48]. Although many previous studies have shown that the majority of speciation events date to the Pliocene (e.g. [18, 20, 49, 50]), Pleistocene-era climatic oscillations are also thought to have played an important role in shaping patterns of diversification, particularly at the population level (e.g. [11, 13]). Here we report on a remarkably recent radiation of a group of duiker whose sister species pairs appear to date predominantly to the Pleistocene. As is the case for other forest artiodactyls, taxa within this group are tied to forest environments, thus highlighting the potential importance that Pleistocene refugia may have played in the speciation of forest-dwelling species. Data from this study also highlight several areas of inconsistency between our current understanding of duiker taxonomy and the evolutionary relationships depicted here. Consistent with their recent origin, several sister species groups exhibit paraphyletic relationships and/or evidence of recent hybridization. Further work should therefore aim to sample more widely across these sister taxa in order to better understand the geographic range of paraphyletic lineages and identify potential areas of introgression. These findings may also prove particularly relevant to future conservation efforts, given that many species are presently regulated under the Convention for Trade in Endangered Species and are therefore targets for the bushmeat trade.
Methods
Tissue was sampled from 24 individuals within the Cephalophinae, representing all eighteen species recognized by the International Union for Conservation of Nature (IUCN) [51]. Sequences were also obtained from Genbank of the newly discovered species, P. walteri[52], and one taxon that is considered a subspecies by IUCN (C. rubidus) (Additional file 2). With respect to a suitable outgroup, recent mitochondrial studies have suggested that the klipspringer (Oreotragus oreotragus) may be sister to the Cephalophinae [53, 54]. However, nuclear markers [25] and supertree analysis [55] do not provide support for this relationship, or for any consistent sister group to the Cephalophinae. Given the uncertainty of these relationships, we have included not only O. oreotragus as a candidate outgroup but also two other closely related taxa within the subfamily Antelopinae (the suni Neotragus moschatus and Kirk's dik-dik Madoqua kirkii) alongside two more divergent species within the subfamily Bovinae, the bushbuck (Tragelaphus scriptus) and the sitatunga (T. spekei).
Samples were obtained from bushmeat market surveys conducted in collaboration with the Wildlife Conservation Society (WCS) in Gabon, or donated by zoos and other researchers. With the exception of the easily distinguishable P. monticola and T. spekei, a photographic record was used to verify the species identity of all WCS collected bushmeat samples. Tissue samples of several species obtained from the San Diego Zoo and a fecal sample taken from C. jentinki at Gladys Porter Zoo were accompanied by species records. Details for all remaining samples are found in [22–25, 56].
DNA from all bushmeat and some San Diego Zoo tissues was extracted using a standard phenol-chloroform extraction method [57]. DNA provided by Jansen van Vuuren was extracted according to the methods described in [22]. Other samples provided by the San Diego Zoo were obtained as genomic DNA extracts. The C. jentinki fecal sample was extracted using the QIAamp DNA Stool Minikit (Qiagen) in a designated room and a blank was included to control for DNA contamination. The C. harveyi sample AB05 was extracted from blood using a salt-based extraction method [58].
Portions of two coding mDNA genes were included in phylogenetic analyses: 514 bp of the cytochrome b (cytb) gene and 658 bp of the cytochrome c oxidase subunit 1 (COX1). See Additional file 2 for GenBank accession numbers for sequences obtained from previous studies or from the current study. Most (n = 36) of the cytb sequences were previously published [22, 23, 52, 59]. All Genbank sequences were trimmed to match the cytb region employed by Ntie et al.[23]. The cytb gene fragment from C. jentinki was amplified according to published primers and protocols [23]. Similarly, most (n = 31) of the COX1 sequences were previously published [24, 52] and an additional five samples were amplified according to published protocols [24]. To test for the potential presence of non-functional nuclear translocated copies of mitochondrial DNA (Numts), each of the mitochondrial gene sequences were translated to amino acids in the program MEGA v3. [60]. No evidence of frameshifts or stop codons were found.
Four nuclear DNA markers were also amplified and sequenced using published primers and PCR conditions [61]. These markers span introns within four genes: stem cell factor (MGF), protein-kinase-CI (PRKCl), B-spectrin non-erythrocytic (SPTBN1) and thyrotropin (THY). Internal primers were designed and used to amplify smaller fragments for samples that were highly degraded or difficult to amplify (Additional file 3). PRKCl, SPTBN1 and THY sequences for outgroup taxa M. kirkii, N. moschatus, and O. oreotragus were obtained from Genbank [25]. Following amplification, all PCR products were purified using ExoAp [62] and then sequenced on both strands using the BigDye Terminator Cycle Sequencing Kit v1.1 (ABI). Resulting products were run on a 3100 ABI automated DNA sequencer. Forward and reverse sequences were edited using the program SEQUENCHER v4.1.1 (Gene Codes Corporation, Ann Arbor, MI, USA). For nuclear loci, heterozygous individuals were verified by the presence of two similarly sized, overlapping peaks observed in both sequencing directions, and were coded using standard IUPAC ambiguity codes.
The incongruence length difference test (ILD; [63]) implemented in PAUP* vers. 4.0b10 [64] was used to evaluate incongruence between mitochondrial genes, nuclear introns and between combined mitochondrial and nuclear datasets. These ILD tests used 1,000 randomized partitions of the data and a heuristic search on each randomization to obtain the sum of tree lengths for each partition. The models of nucleotide substitution that best fit the data were selected by jModelTest [65, 66] under the Bayesian information criterion (BIC; [67]).
We also tested for topological concordance between phylogenetic trees derived from mitochondrial and nuclear DNA data partitions using the likelihood-based SH test [68] implemented in PAUP*. The ML tree for mitochondrial dataset was first estimated using jModeltest parameters for that partition. A second ML search on the same dataset was then carried out using the nuclear topology as a constraint. The significance of the difference in the sum of the site-wise log likelihoods of the two trees (unconstrained versus constrained) was then assessed using the SH test. A reciprocal test of topology was also conducted by first estimating the ML tree from the concatenated nuclear dataset and then estimating a constrained ML tree forced to fit the mitochondrial topology.
Gene trees were estimated for each of the four nuclear introns and the combined mitochondrial genes using maximum parsimony (MP), maximum likelihood (ML), and Bayesian (BA) methods (see below). Additionally, nuclear introns were concatenated with and without mitochondrial sequences into a single data matrix for species tree estimation using MP, ML, and BA methods. Nuclear sequences were not available for C. weynsi, C. rubidus and P. walteri either because the sample failed to amplify or because no tissue was available for the present study.
All MP analysis were performed in PAUP*. For each analysis, preliminary maximum parsimony searches were conducted using heuristic search methods with tree bisection reconnection (TBR) branch swapping, collapse of zero-length branches, all characters weighted equally, and 100 replicates of the random addition starting tree option. A nonparametric bootstrap test [69] was carried out using 300 replicates. The “Max Trees” was set to 50,000 for both initial searches and for the bootstrap tests.
Maximum likelihood analyses using a single model of nucleotide substitution for individual introns and concatenated mitochondrial and nuclear matrices were performed in PAUP* vers. 4.0b10 for UNIX. Heuristic searches were carried out using the TBR branch swapping algorithm, collapsing zero-length branches and using 100 replicates of the random addition option for the starting tree. Nonparametric bootstrap values were calculated from a consensus of the 300 replicate searches.
Two additional ML searches were conducted in RAxML vers. 7.0.4 [70] in which each nuclear intron was assigned its own model of nucleotide substitution with or without the inclusion of the mitochondrial data as an additional partition. Within each heuristic search, 500 discrete starting trees were used and a bootstrap consensus tree was estimated from the resulting trees. Each search used a GTR model of nucleotide substitution with the gamma model of rate heterogeneity initiated from a complete random starting tree. Model parameters were optimized to a likelihood difference of 0.00001. Each bootstrap analysis was repeated twenty times to explore tree space and ensure that each analysis converged on a similar likelihood score.
Bayesian analyses were carried out using the Metropolis-coupled Markov chain Monte Carlo (MCMC) methods implemented in MrBayes vers. 3.1.2 [71]. Each analysis included two independent, simultaneous runs. Each run consisted of four chains, one of which was the ‘cold’ chain and three of which were the chains heated according to the default heating method parameters of MrBayes. Each chain was run for up to 50 million generations, initiated from a random starting tree. The chain was sampled every 1,000 generations for a total of up to 50,001 tree samples per run. As simultaneous runs converged onto the stationary distribution, the average standard deviation of split frequencies should approach zero. Therefore, convergence was determined when the standard deviation of split frequencies between simultaneous runs was less than 0.01, as calculated by MrBayes. Additionally, trace files were evaluated with the program Tracer vers. 1.5 [72] and 10% of points collected prior to chain stationarity were discarded as burn-in. The parameter and tree samples from the two simultaneous runs were combined and summarized using the sump and sumt commands, respectively. For the first set of runs, BA searches assumed a single model of nucleotide substitution across the dataset. A second analysis was carried out in which nuclear genes were partitioned to allow each gene to have its own model of nucleotide substitution. This analysis was repeated with the mitochondrial DNA included as an additional partition. Bayes Factor (BF) analysis was used to investigate the effects of partitioning on the Bayesian analysis. Following [73], two times the natural logarithm of the Bayes Factor was calculated as 2 ln BF(21) = 2[ln(hm2)-ln(hm1)]; where hm2 and hm1 are the harmonic means of the post-burn-in likelihood values for the partitioned and un-partitioned analyses, respectively as estimated using the sump command in Mr. Bayes. The threshold of 2 ln BF > 10 was taken as strong evidence for the partitioned model [74]. Although the harmonic mean is not the best estimator of the marginal likelihoods used to compute the Bayes Factor, alternative methods [75–77] are either computationally intensive or not readily implementable at this time.
Divergence times and tree topology were simultaneously estimated using the program BEAST vers. 1.6.1 [78]. BEAST analyses were run with and without the mitochondrial data because ILD tests indicate conflicting signal between nuclear and mitochondrial genomes. The likelihood ratio test implemented in PAUP* was used to determine if a molecular clock hypothesis could be rejected for each locus. Radiometrically dated fossil remains suggest that the earliest appearance of the Cephalophinae was between 6.31 – 5.65 Ma [21], which coincides well with the estimated oldest speciation event within Cephalophinae at 5.3 Ma (± 53,434 years) [22], using a cytb molecular clock calibration for the family Bovidae [59]. From this information, the prior on the age of the node uniting all taxa within the Cephalophinae was set as a lognormal distribution with an upper bound set as an offset value of 5.3 Ma, a log mean of 0.32 Ma from this offset value and log standard deviation of 1 Ma such that 95% of the prior probability encompassed the timeframe suggested by fossil evidence. The prior on the stem of the tree was set as a normal distribution with a mean of 20.1 Ma and a SD of 2.25 Ma. This prior distribution encompasses the dates (16.4 – 23.8 Ma) within which the split between the Bovinae and Antilopinae is believed to have occurred [53]. We unlinked the substitution models across nuclear genes, but left the mitochondrial genes linked. Because a molecular clock hypothesis could be rejected for all loci (MGF: χ2 = 150.96398, PRKCl: χ2 = 60.019, STBN1: χ2 = 115.41636, THY: χ2 = 128.10964, mitochondrial: χ2 = 223.16424, d.f. = 30, p <0.05), we used a relaxed, uncorrelated lognormal clock model and a Yule tree prior as implemented by the program. All other priors were left at their default settings. Two independent MCMC chains were run for 10 million generations and sampled every 1000 states, after which convergence was determined when the combined independent chains yielded posterior probability effective sample sizes (ESS) greater than 200. After examining trace files, the first 25% of the samples were discarded as burn-in and the remaining 7,501 samples from each run were combined in Logcombiner for a total of 15,002 sample genealogies per analysis. Tree Annotator was used to summarize the trees into a single maximum clade credibility tree.
Abbreviations
- CI:
-
Consistency index
- RI:
-
Retention index
- MP:
-
Maximum parsimony
- ML:
-
Maximum likelihood
- BA:
-
Bayesian analysis
- BS:
-
Bootstrap support
- PP:
-
Posterior probability
- WCS:
-
Wildlife conservation Society
- cytb:
-
Cytochrome b
- COX1:
-
Cytochrome c oxidase subunit 1
- MGF:
-
Stem cell factor
- PRKCl:
-
Protein-kinase-CI
- SPTBN1:
-
B-spectrin non-erythrocytic
- THY:
-
Thyrotropin
- ILD:
-
Incongruence length difference test
- BIC:
-
Bayesian information criterion
- SH:
-
Shimodaira-hasegawa
- TBR:
-
Tree bisection reconnection
- MCMC:
-
Markov chain monte carlo
- BF:
-
Bayes factor.
References
Haffer J: Alternative models of vertebrate speciation in Amazonia: an overview. Biodivers Conserv. 1997, 6: 451-476.
Da Silva M, Patton J: Molecular phylogeography and the evolution and conservation of Amazonian mammals. Mol Ecol. 1998, 7: 475-486.
Hewitt G: The structure of biodiversity - insights from molecular phylogeography. Front Zool. 2004, 1: 4-
Haffer J: Speciation in Amazonian forest birds. Sci New York. 1969, 165: 131-137.
Colinvaux P, De Oliveira P, Bush M: Amazonian and neotropical plant communities on glacial time-scales: the failure of the aridity and refuge hypotheses. Quat Sci Rev. 2000, 19: 141-169.
Willis K: Paleocology: the refugial debate. Sci. 2000, 287: 1406-1407.
Lessa E, Cook J, Patton J: Genetic footprints of demographic expansion in North America, but not Amazonia, during the Late Quaternary. Proc Natl Acad Sci USA. 2003, 100: 10331-10334.
Querouil S, Verheyen E, Dillen M, Colyn M: Patterns of diversification in two African forest shrews: Sylvisorex johnstoni and Sylvisorex ollula (Soricidae, Insectivora) in relation to paleo-environmental changes. Mol Phylogenet Evol. 2003, 28: 24-37.
Plana V: Mechanisms and tempo of evolution in the African Guineo-Congolian rainforest. Philos. Trans R Soc Lond Ser B Biol Sci. 2004, 359: 1585-1594.
Bowie R, Fjeldså J, Hackett S, Bates J, Crowe T: Coalescent models reveal the relative roles of ancestral polymorphism, vicariance, and dispersal in shaping phylogeographical structure of an African montane forest robin. Mol Phylogenet Evolution. 2006, 38: 171-188.
Born C, et al: Insights into the biogeographical history of the Lower Guinea Forest Domain: evidence for the role of refugia in the intraspecific differentiation of Aucoumea klaineana. Mol Ecol. 2011, 20: 131-142.
Nicolas V, et al: The roles of rivers and Pleistocene refugia in shaping genetic diversity in Praomys misonnei in tropical Africa. J Biogeogr. 2011, 38: 191-207.
Anthony NM, et al: The role of Pleistocene refugia and rivers in shaping gorilla genetic diversity in central Africa. Proc Natl Acad Sci USA. 2007, 104: 20432-20436.
Trauth M, Larrasoana J, Mudelsee M: Trends, rhythms and events in Plio-Pleistocene African climate. Quat Sci Rev. 2009, 28: 399-411.
Moodley Y, Bruford M: Molecular biogeography: towards an integrated framework for conserving pan-African biodiversity. PLoS One. 2007, 2: 454-
Brown D, et al: Extensive population genetic structure in the giraffe. BMC Biol. 2007, 5: 57-
Janssens S, Fischer E, Stevart T: New insights into the origin of two new epiphytic Impatiens species (Balsaminaceae) from West Central Africa based on molecular phylogenetic analyses. Taxon. 2010, 59: 1508-1518.
Couvreur T, Chatrou L, Sosef M, Richardson J: Molecular phylogenetics reveal multiple tertiary vicariance origins of the African rain forest trees. BMC Biol. 2008, 6: 54-
Holstein N, Renner S: A dated phylogeny and collection records reveal repeated biome shifts in the African genus Coccinia (Cucurbitaceae). BMC Evol Biol. 2011, 11: 28-
Tolley K, et al: Ancient forest fragmentation or recent radiation? Testing refugial speciation models in chameleons within an African biodiversity hotspot. J Biogeogr. 2011, 38: 1748-1760.
Vrba E: The fossil record of African antelopes (Mammalia, Bovidae) in relation to human evolution and paleoclimate. Paleoclimate and evolution, with emphasis on human origins. Edited by: Vrba E, Denton G, Partridge T, Burckle L. 1995, Yale University Press, New Haven, 385-424.
Jansen van Vuuren Vuuren B, Robinson T: Retrieval of four adaptive lineages in duiker antelope: evidence from mitochondrial DNA sequences and fluorescence in situ hybridization. Mol Phylogenet Evol. 2001, 20: 409-425.
Ntie S, et al: A molecular diagnostic for identifying central African forest artiodactyls from faecal pellets. Anim Conserv. 2010, 13: 80-93.
Johnston A, Morikawa M, Ntie S, Anthony N: Evaluating DNA barcoding criteria using African duiker antelope (Cephalophinae) as a test case. Conserv Genet. 2011, 12: 1173-1182.
Matthee C, Davis S: Molecular insights into the evolution of the family Bovidae: a nuclear DNA perspective. Mol Biol Evol. 2001, 18: 1220-1230.
Willows-Munro S, Robinson T, Matthee C: Utility of nuclear DNA intron markers at lower taxonomic levels: phylogenetic resolution among nine Tragelaphus spp. Mol Phylogenet Evol. 2005, 35: 624-636.
Drummond A, Ho S, Phillips M, Rambaut A: Relaxed phylogenetics and dating with confidence. Plos Biol. 2006, 4: 699-710.
Grubb P: Patterns of speciation in African Mammals. Bull Carnegie Mus Nat Hist. 1978, 6: 152-165.
Funk D, Omland K: Species-level paraphyly and polyphyly: frequency, causes, and consequences, with insights from animal mitochondrial DNA. Annu Rev Ecol Evol Syst. 2003, 34: 397-423.
Zink R, Barrowclough G: Mitochondrial DNA under siege in avian phylogeography. Mol Ecol. 2008, 17: 2107-2121.
Zachos J, Pagani M, Sloan L, Thomas E, Billups K: Trends, rhythms and aberrations in global climate 65 Ma to present. Sci. 2001, 292: 686-693.
deMenocal P: Plio-Pleistocene African Climate. Sci. 1995, 270: 53-59.
van Zinderen Bakker E, Mercer H: Major late cainozoic climate events and paleoenvironmental changes in Africa viewed in a worldwide context. Paleogeogr Paleoclimatol Paleoecol. 1986, 56: 217-235.
Hamilton A, Taylor D: History of climate and forests in tropical Africa during the last 8 million years. Clim Chang. 1991, 19: 65-78.
Maley J: The African rainforest – main characteristics of changes in vegetation and climate from the upper cretaceous to the quaternary. Proc R Soc Edinb. 1996, 104N: 31-73.
Prance G: A review of the phytogeographic evidence for Pleistocene climate change in the neotropics. Ann Mo Bot Gar. 1982, 69: 594-624.
Moritz C, Patton J, Schneider C, Smith T: Diversification of rainforest faunas: an integrated molecular approach. Annu Rev Ecol Syst. 2000, 31: 533-563.
Fjelds J: Geographical patterns for relict and young species of birds in Africa and South America and implications for conservation priorities. Biodivers Conserv. 1994, 3: 207-226.
Aduse-Poku K, Vingerhoedt E, Wahlberg N: Out-of-Africa again: a phylogenetic hypothesis of the genus Charaxes (Lepidoptera: Nymphalidae) based on five gene regions. Mol Phylogenet Evol. 2009, 53: 463-478.
Alpers D, Jansen van Vuuren B, Arctander P, et al: Population genetics of the roan antelope (Hippotragus equinus) with suggestions for conservation. Mol Ecol. 2004, 13: 1771-1784.
Nicolas V, Missoup A, Denys C, et al: The roles of rivers and Pleistocene refugia in shaping genetic diversity in Praomys misonnei in tropical Africa. J Biogeogr. 2011, 38: 191-207.
Thalmann O, Fischer A, Lankester F, Pääbo S, Vigilant L: The complex evolutionary history of gorillas: insights from genomic DNA. Mol Biol Evol. 2007, 24: 146-158.
Avise J, Walker D, Johns G: Speciation durations and Pleistocene effects on vertebrate phylogeography. Proc R Soc Lond Ser B-Biol Sci. 1998, 265: 1707-1712.
Hey J: Isolation with migration models for more than two populations. Mol Biol Evol. 2010, 27: 905-920.
Crandall K, Bininda-Emonds O, Mace G, Wayne R: Considering evolutionary processes in conservation biology. Trends Ecol Evol. 2000, 15: 290-295.
Kingdon J: The Kingdon Field Guide to African Mammals. 1997, New York and London, Academic Press
Eaton M, et al: Barcoding bushmeat: molecular identification of Central African and South American harvested vertebrates. Conserv Genet. 2009, 11: 1389-1404.
Hamilton A, Taylor D: History of climate and forests in tropical Africa during the last 8 million years. Clim Change. 1991, 19: 65-78.
Damm S, Dijkstra K, Hadrys H: Red drifters and dark residents: the phylogeny and ecology of a Plio-Pleistocene dragonfly radiation reflects Africa’s changing environment (Odonata, Libellulidae, Trithemis). Mol Phylogenet Evol. 2010, 54: 870-82.
Voelker G, Outlaw R, Bowie R: Pliocene forest dynamics as a primary driver of African bird speciation. Global Ecol and Biogeogr. 2010, 19: 111-121.
IUCN 2011. IUCN Red List of Threatened Species. Version 2011.2. , , , http://www.iucnredlist.org. Downloaded on 5 August 2011
Colyn M, et al: Discovery of a new duiker species (Bovidae: Cephalophinae) from the Dahomey Gap. West Africa Zootaxa. 2010, 2637: 1-30.
Hassanin A, Douzery E: The tribal radiation of the family Bovidae (Artiodactyla) and the evolution of the mitochondrial cytochrome b gene. Mol Phylogenet Evol. 1999, 13: 227-243.
Agnarsson I, May-Collado L: The phylogeny of Cetartiodactyla: the importance of dense taxon sampling, missing data, and the remarkable promise of cytochrome b to provide reliable species-level phylogenies. Mol Phylogenet Evol. 2008, 48: 964-985.
Hernandez Fernandez M, Vrba E: A complete estimate of the phylogenetic relationships in Ruminantia: a dated species-level supertree of the extant ruminants. Biol Rev (Cambridge). 2005, 80: 269-302.
Bowkett A, Rovero F, Marshall A: The use of camera-trap data to model habitat use by antelope species in the Udzungwa mountain forests, Tanzania. Afr J Ecol. 2008, 46: 479-487.
Sambrook J, Russell D: Molecular cloning: A Laboratory Manual. 2001, Cold Springs Harbor Laboratory Press, Cold Springs Harbor
Aljanabi S, Martinez I: Universal and rapid salt-extraction of high quality genomic DNA for PCR-based techniques. Nucleic Acid Res. 1997, 25: 4692-4693.
Matthee C, Robinson T: Cytochrome b phylogeny of the family bovidae: Resolution within the Alcelaphini, Antilopini, Neotragini, and Tragelaphini. Mol Phylogenet Evol. 1999, 12: 31-46.
Kumar S, Tamura K, Nei M: MEGA: integrated software for molecular evolutionary genetics analysis and sequence alignment. Briefings Bioinform. 2004, 5: 150-163.
Matthee C, Burzlaff J, Taylor J, Davis S: Mining the mammalian genome for artiodactyl systematics. Syst Biol. 2001, 50: 367-390.
Glenn T, Schable N: Isolating microsatellite DNA loci. Molecular Evolution: Producing the Biochemical Data, Part B. 2005, Elsevier Academic Press Inc, San Diego
Farris J, et al: Constrcting a significance test for incongruence. Syst Biol. 1995, 44: 570-572.
Swofford D: PAUP*: phylogenetics analysis using parsimony (*and other mothods). version 4.0.b10. 2002, Sinauer Associates, Sunderland, MA
Guindon S, Gascuel O: A simple, fast, and accurate algorithm to estimate large phylogenies by maximum likelihood. Syst Biol. 2003, 52: 696-704.
Posada D: jModelTest: phylogenetic model averaging. Mol Biol Evol. 2008, 25: 1253-1256.
Schwarz G: Estimating dimensions of a model. Ann Stat. 1978, 6: 461-464.
Shimodaira H, Hasegawa M: Multiple comparisons of log likelihoods with applications to phylogenetic inference. Mol Biol Evol. 1999, 16: 1114-1116.
Felsenstein J: Confidence-limits on phylogenies - an approach using the bootstrap. Evol. 1985, 39: 783-791.
Stamatakis A: RAxML-VI-HPC: maximum likelihood-based phylogenetic analyses with thousands of taxa and mixed models. Bioinforma. 2006, 22: 2688-2690.
Ronquist F, Huelsenbeck J: MrBayes 3: Bayesian phylogenetic inference under mixed models. Bioinforma. 2003, 19: 1572-1574.
Rambaut A, Drummond A: Tracer. 2007, version 1.4, , Available from http://beast.bio.ed.ac.uk/Tracer
Brandley M, Schmitz A, Reeder T: Partitioned Bayesian analyses, partition choice, and the phylogenetic relationships of scincid lizards. Syst Biol. 2005, 54: 373-390.
Kass R, Raftery A: Bayes factors. J Am Stat Assoc. 1995, 90: 773-
Lartillot N, Philippe H: Computing Bayes factors using thermodynamic integration. Syst Biol. 2006, 55: 195-207.
Fan Y, Wu R, Chen M, Kuo L, Lewis P: Chossing among partition models in Bayesian phylogenetics. Mol Biol Evol. 2010, 28: 523-532.
Xie W, Lewis P, Fan Y, Kuo L, Chen M: Improving marginal likelihood estimation for Bayesian phylogenetic model selection. Syst Biol. 2011, 60: 150-160.
Drummond A, Rambaut A: BEAST: Bayesian evolutionary analysis by sampling trees. Bmc Evol Biol. 2007, 7: 214-
Acknowledgements
The authors would like to thank Andrew Bowkett, Mitch Eaton, Bettine Jansen van Vuuren, Deborah Pires, Stevens Touladjan, The Gladys Porter Zoo and The San Diego Zoo for collecting and/or providing samples and/or sequences. Additional thanks to Stephan Ntie and Richard Rouyer for help with sequencing and Charles Bell and James Grady for reviewing the manuscript. This study was funded by NSF DEB 0516425.
Author information
Authors and Affiliations
Corresponding author
Additional information
Authors' contributions
ARJ conceived of the study and its design, carried out extractions, primer modifications, DNA sequencing, alignment, and analyses and drafted the manuscript. NMA helped in all of these aspects of the study. Both authors read and approved the final manuscript.
Electronic supplementary material
12862_2011_2157_MOESM1_ESM.xlsx
Additional file 1: Support values. Excel sheet containing posterior probabilities (PP) or bootstrap support (BS) for the nodes in Figures 1, 2, 3 and 4. Values in column A are BEAST PP. Values in columns B are un-partitioned BA PP/partitioned BA PP. Values in columns C are un-partitioned ML BS/partitioned ML BS (MP BS). Values in columns D are BA PP/ML BS/MP BS. Values in bold are PP ≥ 0.95 or BS ≥ 75. (XLSX 15 KB)
12862_2011_2157_MOESM2_ESM.xlsx
Additional file 2: Sample information. Species, sample ID, country of origin where known, material donor, and GenBank accession numbers of all samples and sequences used in the present study. Highlighting of accession number corresponds to initial publication as follows: pink [23]; blue [24]; orange [52]; white [22]; red [59]; yellow [61]; green in present study. (XLSX 15 KB)
12862_2011_2157_MOESM3_ESM.xlsx
Additional file 3: Primers. Internal primers designed to work in combination with the primers and protocols designed by Matthee et al. [61] (indicated by an asterisk) to amplify overlapping fragments for degraded samples, using a modified [Mg2+ and annealing temperature. (XLSX 12 kb) (XLSX 12 KB)
Authors’ original submitted files for images
Below are the links to the authors’ original submitted files for images.
Rights and permissions
This article is published under license to BioMed Central Ltd. This is an Open Access article distributed under the terms of the Creative Commons Attribution License (http://creativecommons.org/licenses/by/2.0), which permits unrestricted use, distribution, and reproduction in any medium, provided the original work is properly cited.
About this article
Cite this article
Johnston, A.R., Anthony, N.M. A multi-locus species phylogeny of African forest duikers in the subfamily Cephalophinae: evidence for a recent radiation in the Pleistocene. BMC Evol Biol 12, 120 (2012). https://doi.org/10.1186/1471-2148-12-120
Received:
Accepted:
Published:
DOI: https://doi.org/10.1186/1471-2148-12-120


