
Abstract
Background
MicroRNAs (miRNAs) are short non-coding RNA molecules, which play an important role in post-transcriptional regulation of gene expression. There have been many efforts to discover miRNA precursors (pre-miRNAs) over the years. Recently, ab initio approaches have attracted more attention because they do not depend on homology information and provide broader applications than comparative approaches. Kernel based classifiers such as support vector machine (SVM) are extensively adopted in these ab initio approaches due to the prediction performance they achieved. On the other hand, logic based classifiers such as decision tree, of which the constructed model is interpretable, have attracted less attention.
Results
This article reports the design of a predictor of pre-miRNAs with a novel kernel based classifier named the generalized Gaussian density estimator (G2DE) based classifier. The G2DE is a kernel based algorithm designed to provide interpretability by utilizing a few but representative kernels for constructing the classification model. The performance of the proposed predictor has been evaluated with 692 human pre-miRNAs and has been compared with two kernel based and two logic based classifiers. The experimental results show that the proposed predictor is capable of achieving prediction performance comparable to those delivered by the prevailing kernel based classification algorithms, while providing the user with an overall picture of the distribution of the data set.
Conclusion
Software predictors that identify pre-miRNAs in genomic sequences have been exploited by biologists to facilitate molecular biology research in recent years. The G2DE employed in this study can deliver prediction accuracy comparable with the state-of-the-art kernel based machine learning algorithms. Furthermore, biologists can obtain valuable insights about the different characteristics of the sequences of pre-miRNAs with the models generated by the G2DE based predictor.
Background
MicroRNAs (miRNAs) are short RNAs (~20-22 nt) that direct post-transcriptional regulation of target genes by arresting the translation of mRNAs or by inducing their cleavage [1]. Since the initial discovery of miRNAs in Caenorhabditis elegans, RNA molecules are regarded as not only a carrier of gene information, but also a mediator of gene expression [2, 3]. Currently, 9539 experimentally verified miRNAs have been collected in the miRBase database [4].
Experimental miRNA identification is accomplished by directional cloning of endogenous small RNAs [5]. Considering both the time and cost of experimental methods, many computational approaches have been proposed [6]. The mature miRNAs is cleaved from a 70-120 nt precursor (pre-miRNA) with a stable hairpin structure. Identifying this specific structure has became an important step in analyzing miRNAs [1]. The earliest computational approaches for discovering pre-miRNAs are mainly based on comparative techniques and can only discover pre-miRNAs that are closely homologous to known miRNAs [7–10]. Alternatively, scientists have resorted to ab initio approaches to discover pre-miRNAs based on the characteristics of their secondary structures [11–15]. The ab initio approaches based predictors are more generally applicable than those that are based on homology searches, since the ab initio approaches do not rely on the existence of homologues. As a result, design of the ab initio approaches based predictors has attracted more attention in recent years.
The basis of the ab initio approaches is to design a coding scheme that maps the sequence and structure characteristics of pre-miRNAs into distinguishable patterns of feature vectors. Then, a supervised learning algorithm, also commonly referred to as data classification, is invoked to discover pre-miRNAs in the query RNA sequence based on the associated feature vectors. In recent years, the design of the coding scheme for characterizing pre-miRNAs has been extensively studied and several different schemes, including base pairing propensity [16], folding energy [17], base pair distance [18], and degree of compactness [19], have been proposed. On the other hand, most people working on this subject have employed the existing kernel based data classification algorithms such as the hidden Markov model (HMM) [20, 21], the support vector machine (SVM) [22, 23], and the kernel density estimator [15] to build the predictors due to the superior prediction performance delivered by these algorithms [24]. Nevertheless, conventional logic based data classification algorithms such as decision trees [25, 26] and decision rules [27, 28] continue to play a major role in some applications due to the interpretability of the logic rules identified by these algorithms. Such a summarized view of the characteristics and distribution of the data set further provides valuable insights about the relations among different features and is highly desirable for in-depth analysis of pre-miRNAs.
Aiming to provide the desirable functionalities of both the kernel based and the logic based data classification algorithms, the study presented in this article has exploited the generalized Gaussian density estimator (G2DE) that we have recently proposed [29]. The G2DE identifies a small number of generalized Gaussian components to model the distribution of the data set in the vector space. As a result, the user can examine the parameter values associated with these of Gaussian components to obtain an overview picture of the distribution of the data set. Furthermore, through in-depth analysis of the parameter values, the user can obtain valuable insights about the relations among different features.
Results and discussion
This section first describes the overall scheme of using G2DE to analyze pre-miRNAs. Each step of the analysis procedure is further elaborated in the Methods section. Next, the prediction performance of the employed classification algorithm is evaluated and compared with four classification algorithms. A demonstrative analysis is also presented to investigate the interpretability of the employed classification algorithm.
Using G2DE to analyze pre-miRNAs
This work uses only sequence information to identify pre-miRNAs from pseudo hairpins, which are RNA sequences with similar stem-loop features to pre-miRNAs but containing no mature miRNAs. In this method, each RNA sequence is represented as a feature vector. The characteristics used to generate the feature vector, including sequence composition, folding energy and stem-loop shape, have been shown to be useful for predicting pre-miRNAs in previous studies [17, 18, 30]. The main task carried out during the learning process of this method is to construct two mixture models of generalized Gaussian components for summarizing pre-miRNAs and pseudo hairpins in the vector space. We model this learning process as a large-parameter-optimization problem (LPOP) and employ an efficient optimization algorithm, Ranking-based Adaptive Mutation Evolutionary (RAME) [31], to decide the parameters associated with each generalized Gaussian component. Finally, the models learnt through the LPOP process are used to predict whether a query RNA sequence is a pre-miRNA. Furthermore, the constructed model of G2DE comprises a small number of generalized Gaussian components and is capable of detecting the sub-clusters or sub-classes of the data set. This study utilizes this feature of G2DE to develop a two-stage analysis where the first stage uses G2DE to partition the data set while the second stage uses G2DE to investigate each of the partitioned subsets.
Prediction performance
The present approach is evaluated using two datasets, HU920 and HU424, combined with four feature sets. See the Methods section for details of the datasets and the feature sets. The prediction performance is compared to two kernel based classifiers, SVM and RVKDE, and two logic based classifiers, C4.5 and RIPPER. The parameters for each classifier are determined by maximizing the prediction accuracy of ten-fold cross-validation on the HU920. A prediction is performed by using the HU920 dataset to predict the HU464 dataset with the selected parameters.
The employed G2DE classifier is compared with two kernel based classifiers, SVM and the relaxed variable kernel density estimator (RVKDE) [32]. The SVM is a commonly used classifier because of its prevailing success in diverse bioinformatics problems [14, 33, 34], while the RVKDE has been shown to have advantages for predicting species-specific pre-miRNAs [15]. Two well-known logic based classifiers, C4.5 [35] and RIPPER [36], are also included as representatives of logic based classification algorithms.
As shown in Table 1, the prediction accuracies of one-stage G2DE are 80.39%, 92.03%, 91.60% and 78.66% with different feature sets. The two-stage G2DE further improve the prediction accuracies and achieves the best average accuracy of 86.58%. Though the number of kernels increases from one-stage to two-stage G2DE, it is still much less than the other kernel based classifiers. Table 1 also reveals that the kernel based classifiers generally outperform the logic based classifiers. As a result, the G2DE is capable of delivering satisfactory performance using a smaller number of kernel functions than the other systems.
In addition to compare the alternative classification algorithms, the prediction performance of the proposed method is also compared to two existing pre-miRNA identification packages, miPred [14] and miR-KDE [15]. A number (nf) of features from the four feature sets are selected with Wilcoxon rank sum test [37] are utilized as the feature set of G2DE. In current implementation, nf is set to seven because that the feature set yielding the best performance in Table 1 contains seven features. In this experiment, a prediction is performed by using the HU920 dataset to predict the HU464 dataset with the parameters maximizing the prediction accuracy of ten-fold cross-validation on the HU920 dataset. The five indices for binary classification (Table 2) used in miPred and miR-KDE are adopted. Table 3 shows the experimental results. G2DE achieves comparable performance with those delivered by miPred and miR-KDE. A notable difference between G2DE and miPred and miR-KDE is that G2DE utilizes much less kernels. G2DE-2 yields the best %ACC, %SE, %Fm and %MCC, which are 93.32%, 90.09%, 93.10% and 87.16%, respectively. Although the number of kernels in G2DE-2 is five times larger than that in G2DE, it is more acceptable to perform further analyses than that in miPred and miR-KDE.
Interpretability of G2DE
Though the two-stage G2DE achieves the best performance in Table 1, the small differences to other classifiers suggests that pre-miRNA prediction algorithms have reached the maximum with current feature sets. Hence, how to interpret the learnt model of machine learning techniques for users is crucial in pre-miRNA prediction. In this subsection, the second feature set is used as an example to explain how to interpret the models generated by the G2DE based predictor. Figure 1 shows the parameters associated with the three Gaussian components used to summarize the pre-miRNAs in the HU920 dataset. To analyze these parameters, we compare them to the Pearson product-moment correlation coefficients (PMCC) [38] of the pre-miRNAs in the HU920 dataset (Figure 2). Parameters in the models generated by G2DE that differ more from the corresponding elements obtained by PMCC are more of our interest. For instance, in Figure 2, the correlation between the first feature (mfe2) and the fifth feature (dQ) of this feature set is 0.36. See the 'Feature set' subsection for detailed explanations of these features. On the other hand, the correlations between the two features in the three Gaussian components (shown in Figure 1) are 0.12, 0.08 and 0.02, all of which are relatively lower than 0.36. As PMCC summarizes the distribution of all pre-miRNAs, this analysis suggests that the HU920 dataset is composed of multiple clusters of samples, where the relation between mfe2 and dQ varies in different clusters and causes the inconsistency of correlations.

Parameters of the three generalized Gaussian components generated by G2DE. This figure shows the three generalized Gaussian components of G2DE with the pre-miRNAs in the HU920 dataset and the second feature set. The correlation of interest is indicated with an arrow.

Parameters obtained by basic statistics. These parameters are obtained by calculating the mean, standard deviation and Pearson product-moment correlation coefficients with the pre-miRNAs of the HU920 dataset and the second feature set. The correlation of interest is indicated with an arrow.
To verify the above analysis, this study depicts the HU920 dataset with their mfe2 and dQ values (Figure 3). In Figure 3, the red squares and green circles represent the pre-miRNAs and the pseudo hairpins, respectively. The red ellipses, named GGC1, GGC2 and GGC3, are the generalized Gaussian components shown in Figure 1, and the black ellipse is the Gaussian distribution shown in Figure 2. Figure 3 reveals that there are potentially two clusters of pre-miRNAs in this dataset and form a shape of a mirrored 'L' in the feature space of mfe2 and dQ. mfe2 measures the energy of folding while dQ measures the arrangement of base paring. Table 4 shows the detailed descriptions of these features. Figure 3 suggests that if a RNA sequence has low folding energy, it is probably a pre-miRNA regardless of the arrangement of its base paring. On the other hand, there is another cluster of pre-miRNAs that have similar folding energies to those of pseudo hairpins. No obvious correlation exists in both clusters of pre-miRNAs. These findings coincide with the analysis based on the models generated by G2DE. In this example, the Gaussian components learnt by G2DE help users to identify features of interest without plotting all pairs of features along with the relations between them.

Distribution of the HU920 dataset. The x-axis is the first feature of the second feature set, ratio of MFE to the number of stems; the y-axis is the fifth feature of the second feature set, adjusted Shannon entropy. Red ellipses represent the generalized Gaussian components shown in Figure 1; the black ellipse represents the Gaussian component shown in Figure 2. The red squares and green circles represent the pre-miRNAs and the pseudo hairpins, respectively. Values within the parentheses indicate the correlations between these two features in the corresponding Gaussian components.
Another useful analysis provided by the learnt model of the G2DE based predictor is sub-class detection. By defining that a sample belongs to the Gaussian component reporting the maximum function value at the location of that sample, the learnt Gaussian components of G2DE suggests that "a sample that belongs to GGC2 is a pre-miRNA." This statement is similar to the normal decision rule "a sample that has mfe2 < 0.4 is a pre-miRNA," except that the conditions (belong vs. mfe2 < 0.4) within the rule inferred by G2DE is non-linear. This non-linearity of a single rule is an important feature of G2DE to describe more complicated model than traditional logic based classifiers when the number of kernels of G2DE is limited to the number of rules of logic based algorithms. One immediate application of the sub-class detection is to group samples into clusters and then construct a classifier for each of the clusters. The performance improved by applying such two-stage framework has been shown in the previous subsection.
Conclusion
Software predictors that identify pre-miRNAs in genomic sequences have been exploited by biologists to facilitate molecular biology research in recent years. However, design of advanced predictors of pre-miRNAs has focused mostly on coding the distinguishable sequence as well as structure characteristics of miRNAs. The study presented in this article addresses this issue from the aspect of exploiting advanced machine learning algorithms. The G2DE employed in this study has been designed to deliver prediction accuracy comparable with the state-of-the-art kernel based machine learning algorithms, while providing the user with good interpretability. As demonstrated by the experiments reported in this study, the models generated by the G2DE based classifier provide the user with crucial clues about the different characteristics of the sequences of pre-miRNAs.
Methods
Feature set
This work adopts 33 characteristic features which have been shown to be useful for miRNA detection in previous studies [16–19, 30, 39–41]. To investigate how alternative classifiers perform when using different features, these features are grouped as four different sets according to their biochemical properties. The first feature set includes 17 sequence composition variables, which comprise frequencies of 16 dinucleotide pairs and proportion of G and C in the RNA molecule. The second feature set includes seven folding measures: Minimum Free Energy (MFE) and two of its variants [17, 18, 39], base pairing propensity [16], Shannon entropy [18], base pair distance [18, 40] and degree of compactness [19, 41]. The third feature set uses the Z-score [42] to normalize the features in the second feature set except the two MFE variants. The fourth feature set includes four stem-loop features: hairpin length [15], loop length [15], consecutive base-pairs [15] and the ratio of loop length to hairpin length [15]. Table 4 shows a summary of these features.
Dataset
The process of data preparation is the same as that in the compared pre-miRNA identification packages [14, 15] for a fair comparison. 692 human miRNA precursors are collected from the miRBase registry database [43] (release 12.0) as the positive set. For the negative set, 8494 pseudo hairpins collected from the protein-coding regions (CDSs) according to RefSeq [44] and UCSC refGene [45] annotations are analyzed. These RNA sequences are extracted from genomic regions where no experimentally validated splicing event has been reported [12]. The secondary structures of the 8494 RNA sequences are obtained by executing RNAfold [46]. RNA sequences with <18 base pairs on the stem, MFE > -25 kcal/mol and multiple loops are excluded. As a result, 3988 pseudo hairpins, which are similar to genuine pre-miRNAs in terms of length, stem-loop structure, and number of bulges but not have been reported as pre-miRNAs, are used as the negative set.
Based on the positive and negative sets, one training set and one testing set are built to evaluate the pre-miRNA predictors. The training set, HU920, comprises 460 human pre-miRNAs and 460 pseudo hairpins randomly selected from the positive and negative sets, respectively. The HU920 dataset is used for parameter selection and model construction of the pre-miRNA predictors. The testing set, HU464, comprises the remaining 232 human pre-miRNAs and 232 randomly selected pseudo hairpins. Care has been taken to ensure that no pseudo hairpin is included in both datasets. Before performing any experiments on these datasets, the features are rescaled linearly by the svm-scale program [47] to the interval of [-1.0, 1.0].
Generalized Gaussian density estimator
This work transforms samples into feature vectors and then uses them to construct a generalized Gaussian density estimator (G2DE) [29]. A density estimator is in fact an approximate probability density function. With the G2DE algorithm, one approximate probability density function of the following form is generated for each class of samples:

where d is the dimension of the vector space and w
i
, μ
i
, and Σ
i
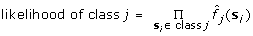
are the weight, mean vector, and the covariance matrix of the i-th Gaussian component. Let  denote the approximate probability density function for the j-th class of samples. Then, a query sample located at v is predicted to belong to the class of which the corresponding likelihood function defined in the following gives the maximum value:

where S j is the set of class-j training samples and |S j | is the number of class-j training samples.
In current G2DE implementation, the user can specify the maximum number of generalized Gaussian components that can be incorporated to generate the approximate probability density function for one class of samples. If the user sets this number to k and the total number of features of the data set is d, then the learning algorithm of G2DE needs to figure out the optimal combination of the values of the following k(d+2)(d+1)/2 parameters in order to generate one approximate probability density function: k d-dimensional vectors as the means of the generalized Gaussian components; k sets of d(d+1)/2 coefficients with each corresponding to the covariance matrix of one generalized Gaussian components; k weights. The optimal combination of parameter values are figured out using the Ranking-based Adaptive Mutation Evolutionary (RAME) algorithm [31].
In the evolutionary optimization algorithm, the objective function to be maximized is as follows:

where
-
(1)
Z is the vector formed by concatenating all the k(d+2)(d+1)/2 parameters associated with the approximate probability density function of one class of samples;
-
(2)
#Correct is the number of correctly classified training samples;
-
(3)
θ is a user-defined parameter;
-
(4)
 , where s
i
is the i-th training sample of class j.
, where s
i
is the i-th training sample of class j.
 , where s
i
is the i-th training sample of class j.
, where s
i
is the i-th training sample of class j.The objective function adopted in the learning process of G2DE consists of two terms. Both terms have specific mathematical meanings. Maximizing term #Correct implies that the number of training samples of which the class can be correctly predicted with the decision model is maximized. Meanwhile, maximizing the second term implies that the mixture models give the maximum likelihood with the training samples.
Two-stage G2DE
The learnt model of G2DE is composed of a small number of Gaussian components. In this study, a sample is defined as belonging to the Gaussian component reporting the maximum function value at the location of that sample. The two-stage classification framework is performed by first grouping samples belonging to the same Gaussian component into clusters and then constructing a classifier for each of the clusters. In the first stage, all training samples would be submitted to G2DE for constructing a mixture model of generalized Gaussian components. Suppose that the learnt model contains n1 generalized Gaussian components, essentially dividing the training dataset into n1 clusters. Each training sample would then be assigned to the Gaussian component to which it belongs. In the second stage, G2DE is invoked n1 times to construct n1 mixture models for each cluster. If each of the learnt models in the second stage contains n2 generalized Gaussian components, the final classifier will contain n1 × n2 generalized Gaussian components.
References
Bartel DP: MicroRNAs: Genomics, biogenesis, mechanism, and function. Cell 2004, 116(2):281–297. 10.1016/S0092-8674(04)00045-5
Lee RC, Feinbaum RL, Ambros V: The C-Elegans Heterochronic Gene Lin-4 Encodes Small RNAs with Antisense Complementarity to Lin-14. Cell 1993, 75(5):843–854. 10.1016/0092-8674(93)90529-Y
Reinhart BJ, Slack FJ, Basson M, Pasquinelli AE, Bettinger JC, Rougvie AE, Horvitz HR, Ruvkun G: The 21-nucleotide let-7 RNA regulates developmental timing in Caenorhabditis elegans. Nature 2000, 403(6772):901–906. 10.1038/35002607
Griffiths-Jones S, Saini HK, van Dongen S, Enright AJ: miRBase: tools for microRNA genomics. Nucleic Acids Res 2008, 36: D154-D158. 10.1093/nar/gkm952
Chen PY, Manninga H, Slanchev K, Chien MC, Russo JJ, Ju JY, Sheridan R, John B, Marks DS, Gaidatzis D, et al.: The developmental miRNA profiles of zebrafish as determined by small RNA cloning. Genes & Development 2005, 19(11):1288–1293. 10.1101/gad.1310605
Berezikov E, Cuppen E, Plasterk RHA: Approaches to microRNA discovery. Nature Genetics 2006, 38: S2-S7. 10.1038/ng1794
Boffelli D, McAuliffe J, Ovcharenko D, Lewis KD, Ovcharenko I, Pachter L, Rubin EM: Phylogenetic shadowing of primate sequences to find functional regions of the human genome. Science 2003, 299(5611):1391–1394. 10.1126/science.1081331
Grad Y, Aach J, Hayes GD, Reinhart BJ, Church GM, Ruvkun G, Kim J: Computational and experimental identification of C-elegans microRNAs. Molecular Cell 2003, 11(5):1253–1263. 10.1016/S1097-2765(03)00153-9
Bentwich I, Avniel A, Karov Y, Aharonov R, Gilad S, Barad O, Barzilai A, Einat P, Einav U, Meiri E, et al.: Identification of hundreds of conserved and nonconserved human microRNAs. Nature Genetics 2005, 37(7):766–770. 10.1038/ng1590
Berezikov E, Guryev V, Belt J, Wienholds E, Plasterk RHA, Cuppen E: Phylogenetic shadowing and computational identification of human microRNA genes. Cell 2005, 120(1):21–24. 10.1016/j.cell.2004.12.031
Sewer A, Paul N, Landgraf P, Aravin A, Pfeffer S, Brownstein MJ, Tuschl T, van Nimwegen E, Zavolan M: Identification of clustered microRNAs using an ab initio prediction method. BMC Bioinformatics 2005., 6: 10.1186/1471-2105-6-267
Xue CH, Li F, He T, Liu GP, Li YD, Zhang XG: Classification of real and pseudo microRNA precursors using local structure-sequence features and support vector machine. BMC Bioinformatics 2005., 6: 10.1186/1471-2105-6-310
Brameier M, Wiuf C: Ab initio identification of human microRNAs based on structure motifs. BMC Bioinformatics 2007., 8: 10.1186/1471-2105-8-478
Kwang Loong S, Mishra SK: De novo SVM classification of precursor microRNAs from genomic pseudo hairpins using global and intrinsic folding measures. Bioinformatics 2007, 23(11):1321–1330. 10.1093/bioinformatics/btm026
Chang DTH, Wang CC, Chen JW: Using a kernel density estimation based classifier to predict species-specific microRNA precursors. BMC Bioinformatics 2008., 9: 10.1186/1471-2105-9-432
Schultes EA, Hraber PT, LaBean TH: Estimating the contributions of selection and self-organization in RNA secondary structure. J Mol Evol 1999, 49(1):76–83. 10.1007/PL00006536
Zhang BH, Pan XP, Cox SB, Cobb GP, Anderson TA: Evidence that miRNAs are different from other RNAs. Cell Mol Life Sci 2006, 63(2):246–254. 10.1007/s00018-005-5467-7
Freyhult E, Gardner PP, Moulton V: A comparison of RNA folding measures. BMC Bioinformatics 2005., 6:
Gan HH, Fera D, Zorn J, Shiffeldrim N, Tang M, Laserson U, Kim N, Schlick T: RAG: RNA-As-Graphs database - concepts, analysis, and features. Bioinformatics 2004, 20(8):1285–1291. 10.1093/bioinformatics/bth084
Nam JW, Shin KR, Han JJ, Lee Y, Kim VN, Zhang BT: Human microRNA prediction through a probabilistic co-learning model of sequence and structure. Nucleic Acids Res 2005, 33(11):3570–3581. 10.1093/nar/gki668
Terai G, Komori T, Asai K, Kin T: miRRim: A novel system to find conserved miRNAs with high sensitivity and specificity. RNA-a Publication of the RNA Society 2007, 13(12):2081–2090.
Yang YC, Wang YP, Li KB: MiRTif: a support vector machine-based microRNA target interaction filter. BMC Bioinformatics 2008., 9:
Batuwita R, Palade V: microPred: effective classification of pre-miRNAs for human miRNA gene prediction. Bioinformatics 2009, 25(8):989–995. 10.1093/bioinformatics/btp107
Jain AK, Duin RPW, Mao JC: Statistical pattern recognition: A review. IEEE Transactions on Pattern Analysis and Machine Intelligence 2000, 22(1):4–37. 10.1109/34.824819
Huang LT, Gromiha MM, Ho SY: iPTREE-STAB: interpretable decision tree based method for predicting protein stability changes upon mutations. Bioinformatics 2007, 23(10):1292–1293. 10.1093/bioinformatics/btm100
Zhou XF, Ruan JH, Wang GD, Zhang WX: Characterization and identification of microRNA core promoters in four model species. PLoS Comput Biol 2007, 3(3):412–423. 10.1371/journal.pcbi.0030037
Ho SY, Hsieh CH, Chen HM, Huang HL: Interpretable gene expression classifier with an accurate and compact fuzzy rule base for microarray data analysis. Biosystems 2006, 85(3):165–176. 10.1016/j.biosystems.2006.01.002
Zhou GD: Recognizing names in biomedical texts using mutual information independence model and SVM plus sigmoid. Int J Med Inf 2006, 75(6):456–467. 10.1016/j.ijmedinf.2005.06.012
Hsieh C-H, Chang DT-H, Oyang Y-J: Data Classification with a Generalized Gaussian Components based Density Estimation Algorithm. International Joint Conference on Neural Networks. Atlanta, Georgia 2009.
Ritchie W, Legendre M, Gautheret D: RNA stem-loops: To be or not to be cleaved by RNAse III. RNA 2007, 13(4):457–462. 10.1261/rna.366507
Chang DTH, Oyang YJ, Lin JH: MEDock: a web server for efficient prediction of ligand binding sites based on a novel optimization algorithm. Nucleic Acids Res 2005, 33: W233-W238. 10.1093/nar/gki586
Oyang YJ, Hwang SC, Ou YY, Chen CY, Chen ZW: Data classification with radial basis function networks based on a novel kernel density estimation algorithm. IEEE Transactions on Neural Networks 2005, 16(1):225–236. 10.1109/TNN.2004.836229
Han LY, Cai CZ, Lo SL, Chung MCM, Chen YZ: Prediction of RNA-binding proteins from primary sequence by a support vector machine approach. RNA 2004, 10(3):355–368. 10.1261/rna.5890304
Dror G, Sorek R, Shamir R: Accurate identification of alternatively spliced exons using support vector machine. Bioinformatics 2005, 21(7):897–901. 10.1093/bioinformatics/bti132
Quinlan JR: C4.5: Programs for Machine Learning. San Francisco: Morgan Kaufmann; 1993.
Cohen WW: Fast effective rule induction. International Conference on Machine Learning 1995 1995, 115–123.
Wilcoxon F: Individual Comparisons by Ranking Methods. Biometrics Bulletin 1945, 1(6):80–83. 10.2307/3001968
Hogg RV, Tanis EA: Probability and statistical inference. 7th edition. Upper Saddle River, NJ: Pearson Prentice Hall; 2006.
Seffens W, Digby D: mRNAs have greater negative folding free energies than shuffled or codon choice randomized sequences. Nucleic Acids Res 1999, 27(7):1578–1584. 10.1093/nar/27.7.1578
Moulton V, Zuker M, Steel M, Pointon R, Penny D: Metrics on RNA secondary structures. J Comput Biol 2000, 7(1–2):277–292. 10.1089/10665270050081522
Fera D, Kim N, Shiffeldrim N, Zorn J, Laserson U, Gan HH, Schlick T: RAG: RNA-As-Graphs web resource. BMC Bioinformatics 2004., 5: 10.1186/1471-2105-5-88
Larsen RJ, Marx ML: An Introduction to Mathematical Statistics and Its Applications. 3rd edition. Prentice Hall; 2005.
Griffiths-Jones S, Grocock RJ, van Dongen S, Bateman A, Enright AJ: miRBase: microRNA sequences, targets and gene nomenclature. Nucleic Acids Res 2006, 34: D140-D144. 10.1093/nar/gkj112
Pruitt KD, Maglott DR: RefSeq and LocusLink: NCBI gene-centered resources. Nucleic Acids Res 2001, 29(1):137–140. 10.1093/nar/29.1.137
Karolchik D, Baertsch R, Diekhans M, Furey TS, Hinrichs A, Lu YT, Roskin KM, Schwartz M, Sugnet CW, Thomas DJ, et al.: The UCSC Genome Browser Database. Nucleic Acids Res 2003, 31(1):51–54. 10.1093/nar/gkg129
Hofacker IL: Vienna RNA secondary structure server. Nucleic Acids Res 2003, 31(13):3429–3431. 10.1093/nar/gkg599
Chang CC, Lin CJ: LIBSVM: a library for support vector machines.2001. [http://www.csie.ntu.edu.tw/~cjlin/libsvm]
Acknowledgements
The authors would like to thank the National Science Council of the Republic of China, Taiwan, for financially supporting this research under Contract Nos NSC 97-2627-P-001-002, NSC 96-2320-B-006-027-MY2 and NSC 96-2221-E-006-232-MY2.
This article has been published as part of BMC Bioinformatics Volume 11 Supplement 1, 2010: Selected articles from the Eighth Asia-Pacific Bioinformatics Conference (APBC 2010). The full contents of the supplement are available online at http://www.biomedcentral.com/1471-2105/11?issue=S1.
Author information
Authors and Affiliations
Corresponding author
Additional information
Competing interests
The authors declare that they have no competing interests.
Authors' contributions
Author C.-H. Hsieh performed all calculations and analysis and drafted the manuscript. Author D. T.-H. Chang aided in design of the methodology, interpretation of the data and manuscript preparation. Author C.-H. Hsueh and C.-Y. Wu participated in the data preparation. Author Y.-J. Oyang conceived the design of G2DE classifier. All authors have read and approved this manuscript.
Rights and permissions
Open Access This article is published under license to BioMed Central Ltd. This is an Open Access article is distributed under the terms of the Creative Commons Attribution License ( https://creativecommons.org/licenses/by/2.0 ), which permits unrestricted use, distribution, and reproduction in any medium, provided the original work is properly cited.
About this article
Cite this article
Hsieh, CH., Chang, D.TH., Hsueh, CH. et al. Predicting microRNA precursors with a generalized Gaussian components based density estimation algorithm. BMC Bioinformatics 11 (Suppl 1), S52 (2010). https://doi.org/10.1186/1471-2105-11-S1-S52
Published:
DOI: https://doi.org/10.1186/1471-2105-11-S1-S52