
Abstract
Background
An important aspect of protein design is the ability to predict changes in protein thermostability arising from single- or multi-site mutations. Protein thermostability is reflected in the change in free energy (ΔΔG) of thermal denaturation.
Results
We have developed predictive software, Prethermut, based on machine learning methods, to predict the effect of single- or multi-site mutations on protein thermostability. The input vector of Prethermut is based on known structural changes and empirical measurements of changes in potential energy due to protein mutations. Using a 10-fold cross validation test on the M-dataset, consisting of 3366 mutants proteins from ProTherm, the classification accuracy of random forests and the regression accuracy of random forest regression were slightly better than support vector machines and support vector regression, whereas the overall accuracy of classification and the Pearson correlation coefficient of regression were 79.2% and 0.72, respectively. Prethermut performs better on proteins containing multi-site mutations than those with single mutations.
Conclusions
The performance of Prethermut indicates that it is a useful tool for predicting changes in protein thermostability brought about by single- or multi-site mutations and will be valuable in the rational design of proteins.
Background
Improving protein thermostability is an important goal of protein engineering [1]; by making enzymes easier to handle, increased thermostability can increase storage options and expand the temperature range of applications, and facilitate the commercial development of enzymatic products [2–5]. Mutations at certain residues can significantly alter a protein's structure and thermostability [6, 7]. The free energy (ΔG) of denaturation can be altered by single- or multi-site mutations; the change in ΔG (ΔΔG), an indication of the change in protein thermostability, has been determined for many mutated proteins by the thermal denaturation method [1]. These data have been collected and deposited in publicly available databases [6, 8, 9]. From these data it is possible to develop computational methods to identify mutations in silico that could improve protein thermostability.
Various methods [2, 10] have been proposed to predict thermostability changes brought about by protein mutations; these methods have been based on changes in structural energy [4, 11, 12], statistical analyses of mutant protein thermostability [13, 14], and machine learning [15–21]. Methods based on changes in structural energy typically attempt to analyze changes in physical energy potentials [15], either by calculation, statistical analysis, or empirical measurement, with the objective of understanding the effects of mutations by comparing the energy difference between the wild-type and mutant structures [22, 23].
Recently, various machine learning approaches based on support vector machines (SVM) [18, 19, 24], neural networks [21], and decision trees [16] have been proposed for predicting the effects of mutations on thermostability [8, 9]. These approaches typically use large datasets of known primary, secondary, and tertiary structures of proteins to train the complex nonlinear functions.
Most approaches to predicting stability changes caused by mutations focus on a small number of mutations in a protein, often at a single site [2, 23]. However, many factors, such as hydrophobicity, van der Waals interactions, hydrogen bonds, ion pairs, and non-covalent interactions, contribute to protein thermostability [25]. Thus, multi-site mutations would typically be expected to have a greater and more complex effect on protein thermostability than can be determined from single-site mutations alone [26, 27].
It is thus necessary to have a reliable method for discriminating between stabilizing and destabilizing mutations, as well as for predicting the effects of single- and multi-site mutations on the thermostability of proteins. In this study, we introduce the program "Prethermut" (Pre dicting changes in protein ther mostability brought about by single- or multi-site mu tations), which predicts protein thermostability changes caused by single- or multi-site mutations. The program uses machine learning to construct classification models (for predicting only the sign of ΔΔG) and regression models (for predicting the actual value of ΔΔG). The input feature of Prethermut was developed from structural energy calculations derived from empirical measurements of energy potentials and certain structural attributes reflecting non-covalent interactions between residues within the 3-D structure. Two large non-redundant datasets, the M-dataset and S-dataset, were used to train Prethermut and test its robustness, respectively.
Results and Discussion
Training and validation
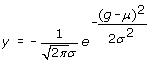
To train the models of Prethermut, a dataset (M-dataset) was constructed, containing data from 3366 mutants. In the M-dataset, 836 mutants had increased stability, with a mean ΔΔG of 1.50 ± 1.36 kcal/mol, and 2530 mutants had decreased stability, with a mean ΔΔG of -1.77 ± 1.03 kcal/mol. The number of mutation sites in the M-dataset ranged from 1 to 9 (Table 1). The input features of Prethermut were calculated from the structural features listed in Table 2, which include structural energies calculated from empirical measurements of energy potentials [11, 28] and certain structural attributes reflecting non-covalent interactions between residues in the 3-D structure [29].
The classifiers of random forests (RF) and support vector machines (SVM) were trained on the M-dataset to predict whether the mutations were stabilizing or destabilizing (i.e., the sign of ΔΔG). The regression methods of random forest regression (RFR) and support vector regression (SVR) were used to predict the change in free energy (ΔΔG) of thermal denaturation of the mutant proteins. Because the number of mutants in the training set having increased thermostability was disproportionately small versus those with decreased thermostability (by a factor of approximately three), the down sampling approach [30] was used for RF implementation, and for SVM implementation the weight given to the mutants with increased thermostability was 3-fold greater than that given to the mutants with decreased thermostability. The performance of the methods was assessed by a 10-fold cross validation on the M-dataset (Table 1).
The classifiers of RF and SVM yielded a similar overall accuracy (Q2) of 79.7% on the M-dataset. However, the Matthews correlation coefficient (MCC) of the RF classifier was 0.50, while that of the SVM classifier was 0.43. This indicates that the RF classifier was better at distinguishing between stabilizing and destabilizing mutations. The better performance of the RF classifier was probably due to the imbalance of the two classes in the M-dataset and may indicate that the RF algorithm was better at accommodating this imbalance than SVM. To further investigate the robustness of the SVM and RF classifiers, receiver operating characteristic curves were plotted based on 10-fold cross validation tests on the M-dataset (Figure 1). The values for the area under the curve for the SVM and RF classifiers were 0.86 and 0.81, respectively. These results indicate that the RF and SVM classifiers could be used to predict which mutations were stabilizing or destabilizing and that the RF classifier was a better performer than the SVM classifier.

Receiver operating characteristic curves for random prediction and the prediction of Prethermut using the random forests (RF) and support vector machines (SVM) methods. The curves were obtained from the 10-fold cross validation test on the M-dataset.
The importance of each variable to the input vector of Prethermut was also assessed by evaluating the decrease in the classification accuracy of RF [30, 31]. As shown in Additional file 1: Table S1, all structural features contributed to the predictor, with the most important feature being the total energy, as calculated by FoldX [11, 28].
As described in the Methods section, the input vector of Prethermut was calculated on the basis of k different structural features of a mutant protein. Here, we evaluated the effect of using different numbers of structural features to build the input vector. As shown in Figure 2, Q2 and the Pearson correlation coefficient (Pearson's r) for regression became balanced when the value of k was greater than 6. We also tested the effect of different numbers of classification trees in the RF. As shown in Additional file 1: Table S2, the performance of Prethermut was not affected when the number of trees was greater than 500.

Pearson correlation coefficient ( r ) and the overall accuracy (Q2) of Prethermut with different numbers of mutant structural features used in the input vector. The results were calculated on the M-dataset with 10-fold cross validation by the random forests method.
Two regression predictors were trained to directly estimate the ΔΔG values by the SVR and RFR algorithms. Regression performance was evaluated based on the results of 10-fold cross validation of the M-dataset (Figure 3). The SVR predictor was trained based on the Radial Basis Function (RBF) kernel with parameters gamma (g) = 2 and cost (c) = 8. Pearson's r of the SVR-predicted and experimental data was 0.67. The results of RFR (Table 1, Figure 2) showed better performance than SVR. Pearson's r of the RFR-predicted and experimental data was 0.72.

Pearson correlation coefficient ( r ) and equation of the regression line ( y ) of Prethermut using the algorithms of support vector regression and random forest regression. The results were calculated on the M-dataset with 10-fold cross validations by the random forests regression method (left panel) and support vector regression method (right panel).
Prediction accuracy using different numbers of mutation sites
We examined the performance of Prethermut in predicting the changes in thermal stability of mutant proteins containing different numbers of mutations. As shown in Table 1, the classification or regression accuracy was better with a larger number of mutations. For example, Q2 and Pearson's r for the prediction of thermostability of proteins containing three mutations, as predicted by RF or RFR, were 96.8% and 0.87, respectively, which was better than the results obtained with proteins having one or two mutations. We also calculated the average absolute value of ΔΔG of the mutant proteins having different numbers of mutations. The average absolute value of ΔΔG for proteins carrying one, two, three, or more than three mutations was 1.50 kcal/mol, 1.94 kcal/mol, 2.04 kcal/mol, and 2.28 kcal/mol, respectively. These results indicate that the change in protein thermostability was greater with increasing number of mutations. The prediction accuracy was also evaluated as a function of the magnitude of absolute ΔΔG. As shown in Table 3, the larger the value of absolute ΔΔG, the greater the accuracy of the prediction.
Reliability index of classification by Prethermut
When machine learning is used to classify samples, it is important to know the reliability of the prediction results [24, 32, 33]. In this study, a reliability index (RI) was assigned to a prediction, depending on the output of SVM or RF. The output O of SVM or RF ranged from zero to one, and the RI value was computed as RI = INTEGER(20 × abs(O-0.5)). Thus, the RI value reflects, on a scale of zero to ten, the degree of certainty of the classification; as the output O approaches the extreme of zero or one, the RI value approaches its maximum value. Figure 4 shows the expected prediction accuracies and the fraction of mutants yielding a given RI value. For example, approximately 28% of the mutants had an RI ≥ 7 for the RF method and of these, 96% were correctly predicted. All of the results were obtained by SVM or RF with 10-fold cross validation of the M-dataset.

Average prediction accuracy calculated cumulatively with a reliability index (RI) above a given value. The results were based on the M-dataset with 10-fold cross validation by the random forests (RF, squares) method and support vector machine (SVM, circles) method.
Comparison with other methods
Professor Gideon Schreiber [2] constructed an independent dataset and systematically assessed the performance of the frequently used computational methods of CC/PBSA [4], EGAD [12], FoldX [11], Hunter [32], I-Mutant2.0 [20], Rosetta [34] and the Combining method [2]. We chose the Schreiber dataset (S-dataset) to test the performance of Prethermut to compare it with the published results from these other methods. As shown in Table 4, Prethermut predicted the thermostability of all the mutant proteins in the S-dataset having known wild-type structure with a better classification and regression accuracy than any of the other methods. This excellent performance of Prethermut was due to its efficient machine learning methods and the more determinant structural features used as inputs.
Conclusions
Several predictors [2, 16–18] have been constructed to predict the effect of a single mutation on protein thermostability, based on structural or sequence features. However, multi-site mutations usually have a greater effect on protein thermostability than single-site mutations [3]. In this study, we present a predictive computer program, called Prethermut, based on machine learning methods, that can directly predict the effect of single- and multi-site mutations on protein thermostability from the wild-type protein's structural features.
The high predictive power of Prethermut, assessed by a rigorous 10-fold cross validation procedure, is illustrated by a Q2 value of 79.7% for the classification of stabilizing and destabilizing mutations from the M-dataset, and a Pearson's r of 0.79 for the correlation between predicted and experimentally determined ΔΔG values. The performance of Prethermut was also assessed in the independent S-dataset of more than 2000 mutants. Prethermut outperformed several published structure- and sequence-based predictors using the S-dataset. Although direct comparison of Prethermut with the other published predictors is not appropriate, because of differences in datasets used for training and testing, as well as the information used to develop the models, the results indicate that Prethermut is a powerful tool for predicting the effect of mutations on protein thermostability.
Methods
Datasets
In this study, two datasets (the M- and S-datasets) were used to train and test the validity of Prethermut. The first dataset, the M-dataset, consisting of the changes in free energy (ΔΔG) of thermal denaturation of mutant proteins, was extracted from the ProTherm database [8, 9] using three criteria:
-
(1)
Both single- and multi-site mutations were considered.
-
(2)
The protein structure was known at atomic resolution and had been deposited in the Protein Data Bank.
-
(3)
Redundant data were removed, and an average free energy change (ΔΔG) of the mutant was calculated when multiple data for the mutant, using the same experimental procedure, were available.
The final non-redundant M-dataset consisted of 3366 mutants with single- or multi-site mutations acquired from 129 different proteins. The ΔΔG ranged from -12.23 kcal/mol to 13.7 kcal/mol. This dataset is available at http://www.mobioinfor.cn/prethermut/download.htm.
The second dataset, the S-dataset, was compiled by Dr. Vladimir Potapov [2] and obtained from http://ligin.weizmann.ac.il/~lpotapov/PEDS_mutants/mutants.html. This large, non-redundant dataset contained 2156 single-site mutants from 84 different proteins.
Input vectors and encoding schemes
The essential step in applying machine learning methods to predict the sign or the actual value of ΔΔG is to translate structural information into vectors with the fixed length, namely the encoding process. The input vectors for Prethermut were calculated as follows:
-
(1)
For each mutant represented in the dataset, a wild-type structure was downloaded from the Protein Data Bank. All water molecules in the structures were manually removed.
-
(2)
Structures of the mutants were modelled by the program Modeller 9.7, which uses the standard steps for building mutants [29]. It was supposed that k different structures of a mutant were modelled by Modeller 9.7 [29], as the Modeller program generates different mutant structures based on different random seeds [29].
-
(3)
For training the model, the input vector of Prethermut contained 58 elements that were calculated from 29 structural features (Table 2), including the potential energies and physical characteristics of the features. In this study, the programs FoldX 3.0 [11] and Modeller 9.7 were used to calculate the values for these features, because these two programs have been widely used to predict and assess protein structures and are freely available.
-
(4)
For each mutant, k different structures were modeled. The input vector M i of the i th structure of the mutant was then calculated by FoldX 3.0 and Modeller 9.7, M i = [
 ], where the value of i is from 1 to k. Then, all of the vectors M were averaged to yield a new vector N, N= [g 1, g 2...g 29].
 -
(5)
All of the residues in the wild-type protein were mutated via single site saturation mutagenesis by Modeller 9.7 [29]. It was supposed that the length of the wild-type protein is l, and then l × 19 mutants for the wild-type protein would be modeled by Modeller 9.7. The structural feature vector W j = [
 ] for the j th structure in all of the mutants of the wild-type protein was calculated, where the value of j is from 1 to l*19. The mean vector U= [μ 1, μ 2...μ 29] and standard deviation vector S= [σ 1, σ 2...σ 29] for all of the structural feature vectors W
j
(j = 1, 2...l*20) were calculated.
] for the j th structure in all of the mutants of the wild-type protein was calculated, where the value of j is from 1 to l*19. The mean vector U= [μ 1, μ 2...μ 29] and standard deviation vector S= [σ 1, σ 2...σ 29] for all of the structural feature vectors W
j
(j = 1, 2...l*20) were calculated. -
(6)
The final input vector Z= [z 1, z 2...z 58] of Prethermut consisted of 58 elements and represented a combination of the two vectors (V= [v 1, v 2...v 29] and Y= [y 1, y 2...y 29]). The element values (v and y) of vector V and Y were calculated as follows:
 (1)
(1) (2)
(2)
 ], where the value of i is from 1 to k. Then, all of the vectors M were averaged to yield a new vector N, N= [g 1, g 2...g 29].
 ] for the j th structure in all of the mutants of the wild-type protein was calculated, where the value of j is from 1 to l*19. The mean vector U= [μ 1, μ 2...μ 29] and standard deviation vector S= [σ 1, σ 2...σ 29] for all of the structural feature vectors W
j
(j = 1, 2...l*20) were calculated.
] for the j th structure in all of the mutants of the wild-type protein was calculated, where the value of j is from 1 to l*19. The mean vector U= [μ 1, μ 2...μ 29] and standard deviation vector S= [σ 1, σ 2...σ 29] for all of the structural feature vectors W
j
(j = 1, 2...l*20) were calculated.

Machine learning methods
In this study, the classification methods RF and SVM (for predicting the sign of ΔΔG) and the regression methods RFR and SVR (for predicting the actual value of ΔΔG) were employed to train and test the robustness of the method, because these methods have been successfully used in many aspects of computational biology [20, 35].
-
(1)
RF. The RF is an ensemble machine learning methodology originated by Leo Breiman [30]. The basic idea of ensemble learning is to boost the performance of a number of weak learners via a voting scheme, where a weak learner can be an individual decision tree, a single perceptron/sigmoid function, or other simple and fast classifier [36]. Regarding RF, its hallmarks include bootstrap re-sampling, random feature selection, in-depth decision tree construction and out-of-bag error estimates [36].
-
(2)
RFR. The RFR is built in a fashion similar to the classifier in RF [37], but the goal of RFR is to predict the continuous value of interest [38].
-
(3)
SVM. SVM is used to identify the optimal hyperplane that separates two classes of samples [39, 40]. SVM uses kernel functions to map the original data to a feature space of higher dimension and then locates an optimal separating hyperplane.
-
(4)
SVR. In comparison with SVM, the objective of SVR is to estimate an unknown continuous valued function y = f(X), which is based on a finite number of samples [41, 42]. The method has been successfully used in many bioinformatics tasks, such as predicting protein B-factors [42], residue contact numbers [43], and residue-wise contact orders [44].
The RF and RFR algorithms were run in the R programming environment (built by the R project, http://www.r-project.org/). To implement SVM and SVR, we used LIBSVM http://www.csie.ntu.edu.tw/~cjlin/ with an RBF kernel. The parameters of SVM or SVR were selected with the LIBSVM parameter selection tool http://www.csie.ntu.edu.tw/~cjlin/libsvmtools/.
Prediction system assessment
Mutant proteins with a value of ΔΔG > 0 for the thermal denaturation reaction were defined as positive samples, and the others were considered as negative samples. True positives (TP) and true negatives (TN) were identified as the positive and negative samples, respectively. False positives (FP) were negative samples identified as positive, and false negatives (FN) were positive samples identified as negative. The quality of the classification was determined based on sensitivity (TP/(TP+FN)), specificity (TN/(TN+FP)), overall accuracy (Q2), and the Matthews correlation coefficient (MCC). The Q2 and MCC were calculated as follows:


The regression quality for predicting the absolute value of ΔΔG was evaluated by Pearson's r, calculated as follows:

where r is Pearson's r, and N, X, and Y are the number of data, experimental ΔΔG value, and predicted ΔΔG value, respectively.
Availability and requirements
Project name: Prethermut
Project home page: http://www.mobioinfor.cn/prethermut
Operating systems: Linux
Programming language: Perl
Required prerequisite programs: Perl version 5.6 or higher; Foldx 3.0; Modeller v9.7 or higher.
License: GNU General Public License. This license allows the source code to be redistributed and/or modified under the terms of the GNU General Public License, as published by the Free Software Foundation. The source code for the application is available at no charge.
Any restrictions to use by non-academics: None
References
Razvi A, Scholtz JM: Lessons in stability from thermophilic proteins. Protein Sci 2006, 15: 1569–1578. 10.1110/ps.062130306
Potapov V, Cohen M, Schreiber G: Assessing computational methods for predicting protein stability upon mutation: good on average but not in the details. Protein Eng Des Sel 2009, 22: 553–560. 10.1093/protein/gzp030
Gribenko AV, Patel MM, Liu J, McCallum SA, Wang C, Makhatadze GI: Rational stabilization of enzymes by computational redesign of surface charge-charge interactions. Proc Natl Acad Sci USA 2009, 106: 2601–2606. 10.1073/pnas.0808220106
Benedix A, Becker CM, de Groot BL, Caflisch A, Bockmann RA: Predicting free energy changes using structural ensembles. Nat Methods 2009, 6: 3–4. 10.1038/nmeth0109-3
Bae E, Bannen RM, Phillips GN Jr: Bioinformatic method for protein thermal stabilization by structural entropy optimization. Proc Natl Acad Sci USA 2008, 105: 9594–9597. 10.1073/pnas.0800938105
Lonquety M, Lacroix Z, Papandreou N, Chomilier J: SPROUTS: a database for the evaluation of protein stability upon point mutation. Nucleic Acids Res 2009, 37: D374–379. 10.1093/nar/gkn704
Sanchez-Ruiz JM, Makhatadze GI: To charge or not to charge? Trends Biotechnol 2001, 19: 132–135. 10.1016/S0167-7799(00)01548-1
Bava KA, Gromiha MM, Uedaira H, Kitajima K, Sarai A: ProTherm, version 4.0: thermodynamic database for proteins and mutants. Nucleic Acids Res 2004, 32: D120–121. 10.1093/nar/gkh082
Kumar MD, Bava KA, Gromiha MM, Prabakaran P, Kitajima K, Uedaira H, Sarai A: ProTherm and ProNIT: thermodynamic databases for proteins and protein-nucleic acid interactions. Nucleic Acids Res 2006, 34: D204–206. 10.1093/nar/gkj103
Khan S, Vihinen M: Performance of protein stability predictors. Hum Mutat 2010.
Schymkowitz J, Borg J, Stricher F, Nys R, Rousseau F, Serrano L: The FoldX web server: an online force field. Nucleic Acids Res 2005, 33: W382–388. 10.1093/nar/gki387
Pokala N, Handel TM: Energy functions for protein design: adjustment with protein-protein complex affinities, models for the unfolded state, and negative design of solubility and specificity. J Mol Biol 2005, 347: 203–227. 10.1016/j.jmb.2004.12.019
Saraboji K, Gromiha MM, Ponnuswamy MN: Average assignment method for predicting the stability of protein mutants. Biopolymers 2006, 82: 80–92. 10.1002/bip.20462
Topham CM, Srinivasan N, Blundell TL: Prediction of the stability of protein mutants based on structural environment-dependent amino acid substitution and propensity tables. Protein Eng 1997, 10: 7–21. 10.1093/protein/10.1.7
Kang S, Chen G, Xiao G: Robust prediction of mutation-induced protein stability change by property encoding of amino acids. Protein Eng Des Sel 2009, 22: 75–83. 10.1093/protein/gzn063
Huang LT, Gromiha MM: Reliable prediction of protein thermostability change upon double mutation from amino acid sequence. Bioinformatics 2009, 25: 2181–2187. 10.1093/bioinformatics/btp370
Masso M, Vaisman II: Accurate prediction of stability changes in protein mutants by combining machine learning with structure based computational mutagenesis. Bioinformatics 2008, 24: 2002–2009. 10.1093/bioinformatics/btn353
Capriotti E, Fariselli P, Rossi I, Casadio R: A three-state prediction of single point mutations on protein stability changes. BMC Bioinformatics 2008, 9(Suppl 2):S6. 10.1186/1471-2105-9-S2-S6
Cheng J, Randall A, Baldi P: Prediction of protein stability changes for single-site mutations using support vector machines. Proteins 2006, 62: 1125–1132. 10.1002/prot.20810
Capriotti E, Fariselli P, Casadio R: I-Mutant2.0: predicting stability changes upon mutation from the protein sequence or structure. Nucleic Acids Res 2005, 33: W306–310. 10.1093/nar/gki375
Capriotti E, Fariselli P, Casadio R: A neural-network-based method for predicting protein stability changes upon single point mutations. Bioinformatics 2004, 20(Suppl 1):i63–68. 10.1093/bioinformatics/bth928
Ferrada E, Melo F: Effective knowledge-based potentials. Protein Sci 2009, 18: 1469–1485. 10.1002/pro.166
Dehouck Y, Grosfils A, Folch B, Gilis D, Bogaerts P, Rooman M: Fast and accurate predictions of protein stability changes upon mutations using statistical potentials and neural networks: PoPMuSiC-2.0. Bioinformatics 2009, 25: 2537–2543. 10.1093/bioinformatics/btp445
Capriotti E, Fariselli P, Calabrese R, Casadio R: Predicting protein stability changes from sequences using support vector machines. Bioinformatics 2005, 21(Suppl 2):ii54–58. 10.1093/bioinformatics/bti1109
Vieille C, Zeikus GJ: Hyperthermophilic enzymes: sources, uses, and molecular mechanisms for thermostability. Microbiol Mol Biol Rev 2001, 65: 1–43. 10.1128/MMBR.65.1.1-43.2001
Palackal N, Brennan Y, Callen WN, Dupree P, Frey G, Goubet F, Hazlewood GP, Healey S, Kang YE, Kretz KA, et al.: An evolutionary route to xylanase process fitness. Protein Sci 2004, 13: 494–503. 10.1110/ps.03333504
Reetz MT, Carballeira JD, Vogel A: Iterative saturation mutagenesis on the basis of B factors as a strategy for increasing protein thermostability. Angew Chem Int Ed Engl 2006, 45: 7745–7751. 10.1002/anie.200602795
Guerois R, Nielsen JE, Serrano L: Predicting changes in the stability of proteins and protein complexes: a study of more than 1000 mutations. J Mol Biol 2002, 320: 369–387. 10.1016/S0022-2836(02)00442-4
Sali A, Blundell TL: Comparative protein modelling by satisfaction of spatial restraints. J Mol Biol 1993, 234: 779–815. 10.1006/jmbi.1993.1626
Breiman L: Random Forests. Machine Learning 2001, 45: 5–32. 10.1023/A:1010933404324
Liaw A, Wiener M: Classification and Regression by randomForest. R News 2002, 2: 18–22.
Tian J, Wu N, Guo J, Fan Y: Prediction of amyloid fibril-forming segments based on a support vector machine. BMC Bioinformatics 2009, 10(Suppl 1):S45. 10.1186/1471-2105-10-S1-S45
Tian J, Wu N, Guo X, Guo J, Zhang J, Fan Y: Predicting the phenotypic effects of non-synonymous single nucleotide polymorphisms based on support vector machines. BMC Bioinformatics 2007, 8: 450. 10.1186/1471-2105-8-450
Sammond DW, Eletr ZM, Purbeck C, Kimple RJ, Siderovski DP, Kuhlman B: Structure-based protocol for identifying mutations that enhance protein-protein binding affinities. J Mol Biol 2007, 371: 1392–1404. 10.1016/j.jmb.2007.05.096
Montanucci L, Fariselli P, Martelli PL, Casadio R: Predicting protein thermostability changes from sequence upon multiple mutations. Bioinformatics 2008, 24: i190–195. 10.1093/bioinformatics/btn166
Jiang R, Tang W, Wu X, Fu W: A random forest approach to the detection of epistatic interactions in case-control studies. BMC Bioinformatics 2009, 10(Suppl 1):S65. 10.1186/1471-2105-10-S1-S65
Pang H, Lin A, Holford M, Enerson BE, Lu B, Lawton MP, Floyd E, Zhao H: Pathway analysis using random forests classification and regression. Bioinformatics 2006, 22: 2028–2036. 10.1093/bioinformatics/btl344
Svetnik V, Liaw A, Tong C, Culberson JC, Sheridan RP, Feuston BP: Random forest: a classification and regression tool for compound classification and QSAR modeling. J Chem Inf Comput Sci 2003, 43: 1947–1958.
Vapnik VN: The Nature of Statistical Learning Theory. 1st edition. New York: Springer; 1995.
Vapnik VN: Statistical Learning Theory. New York: Wiley; 1998.
Song J, Tan H, Takemoto K, Akutsu T: HSEpred: predict half-sphere exposure from protein sequences. Bioinformatics 2008, 24: 1489–1497. 10.1093/bioinformatics/btn222
Yuan Z, Bailey TL, Teasdale RD: Prediction of protein B-factor profiles. Proteins 2005, 58: 905–912. 10.1002/prot.20375
Ishida T, Nakamura S, Shimizu K: Potential for assessing quality of protein structure based on contact number prediction. Proteins 2006, 64: 940–947. 10.1002/prot.21047
Song J, Burrage K: Predicting residue-wise contact orders in proteins by support vector regression. BMC Bioinformatics 2006, 7: 425. 10.1186/1471-2105-7-425
Acknowledgements
The authors thank Dr. Vladimir Potapov for providing the S-dataset. We also thank Mr. Xing Qi for revising the paper.
Funding: This work was supported by the National Natural Science Foundation of China (Grant no. 30900839).
Author information
Authors and Affiliations
Corresponding author
Additional information
Authors' contributions
JT wrote the code of Prethermut. NW and YF supervised the work. JT, NW, and XC were involved in the preparation of the manuscript. All authors read and approved the manuscript.
Electronic supplementary material
12859_2010_3827_MOESM1_ESM.DOC
Additional file 1: Table S1. Selected structural features and the contribution of these features. Table S2. Prediction performance of Random Forests with different tree number. (DOC 79 KB)
Authors’ original submitted files for images
Below are the links to the authors’ original submitted files for images.
Rights and permissions
Open Access This article is published under license to BioMed Central Ltd. This is an Open Access article is distributed under the terms of the Creative Commons Attribution License ( https://creativecommons.org/licenses/by/2.0 ), which permits unrestricted use, distribution, and reproduction in any medium, provided the original work is properly cited.
About this article
Cite this article
Tian, J., Wu, N., Chu, X. et al. Predicting changes in protein thermostability brought about by single- or multi-site mutations. BMC Bioinformatics 11, 370 (2010). https://doi.org/10.1186/1471-2105-11-370
Received:
Accepted:
Published:
DOI: https://doi.org/10.1186/1471-2105-11-370