
Abstract
Background
Multiple gene expression signatures derived from microarray experiments have been published in the field of leukemia research. A comparison of these signatures with results from new experiments is useful for verification as well as for interpretation of the results obtained. Currently, the percentage of overlapping genes is frequently used to compare published gene signatures against a signature derived from a new experiment. However, it has been shown that the percentage of overlapping genes is of limited use for comparing two experiments due to the variability of gene signatures caused by different array platforms or assay-specific influencing parameters. Here, we present a robust approach for a systematic and quantitative comparison of published gene expression signatures with an exemplary query dataset.
Results
A database storing 138 leukemia-related published gene signatures was designed. Each gene signature was manually annotated with terms according to a leukemia-specific taxonomy. Two analysis steps are implemented to compare a new microarray dataset with the results from previous experiments stored and curated in the database. First, the global test method is applied to assess gene signatures and to constitute a ranking among them. In a subsequent analysis step, the focus is shifted from single gene signatures to chromosomal aberrations or molecular mutations as modeled in the taxonomy. Potentially interesting disease characteristics are detected based on the ranking of gene signatures associated with these aberrations stored in the database. Two example analyses are presented. An implementation of the approach is freely available as web-based application.
Conclusions
The presented approach helps researchers to systematically integrate the knowledge derived from numerous microarray experiments into the analysis of a new dataset. By means of example leukemia datasets we demonstrate that this approach detects related experiments as well as related molecular mutations and may help to interpret new microarray data.
Background
Leukemia is a heterogeneous disease with respect to genetic alterations, which include chromosomal aberrations as well as molecular mutations. Thus far, microarray technology and in particular gene expression arrays have been widely used to explore the molecular variation underlying the biologic and clinical heterogeneity of leukemia [1]. As a result, biologically and clinically relevant subtypes of leukemia have been characterized based on their respective gene expression patterns [2–7]. Often, novel findings were published in the form of lists of differentially expressed genes that were referred to as gene expression signatures. When a new microarray dataset, herein denoted as query dataset, is analyzed, a thorough comparison with previously published results of similar experiments is helpful not only for verification, but also for identifying associations with different leukemia subtypes.
Solely relying on gene signatures, two microarray experiments can be compared by simply counting the number of overlapping genes from each study [8, 9]. However, some studies reported limited overlap between lists of differentially expressed genes derived from different microarray studies for the same disease category [10–12]. Even when using technical replicates for inter- and intra-platform comparisons, the number of overlapping genes can be small [13]. The reason for these disappointing results is not necessarily originated in the quality of microarray technology itself, but rather in the percentage of overlapping genes as being considered as an unsuitable measurement for the reproducibility of microarray experiments [14]. Based on a statistical model, it has been shown that even in technical replicate tests using identical samples, it is highly possible that the lists of the most differentially expressed genes are very inconsistent [15, 16]. Moreover, published gene signatures are derived from different laboratories, with study groups applying differing array platforms and using different statistical methods to generate gene lists of interest [17]. Hence, approaches [18, 19] that compute the similarity of a given gene list with a collection of published gene signatures based on the number of overlapping genes are likely to miss relevant signatures.
If the microarray intensity values of the query dataset are available, the search for similar results in a gene signature database can be based directly on the continuous intensity data avoiding the need for counting overlapping genes. Many gene set analysis (GSA) methods for detecting differential expression in externally defined sets of genes have been proposed [20–22] and successfully applied to gain novel biological insights from microarray data [23, 24]. The externally defined gene sets are usually derived from pathway databases or from the Gene Ontology [25] database, but rarely from published articles [23]. Although it has been shown that GSA methods can be useful for comparison of microarray experiments [26–28], only few databases contain published gene signatures [18, 19, 26, 29]. These databases focus on published gene expression signatures of genetic and chemical perturbations and do not offer an exhaustive collection of results from of a certain research field like leukemia. Thus, to our knowledge, these methods were not yet used to systematically compare a new microarray dataset with previously published gene signatures.
Any query dataset and the published experiments can be compared directly based on their intensity values, assuming all required microarray raw datasets are available. For example, the connectivity map [30] is a database that consists of more than 500 gene expression profiles from human cell lines treated with perturbagens together with a pattern-matching algorithm that can be used to mine the database when a query dataset is given. A similar approach has recently been proposed to search the Gene Expression Omnibus array data repository [31] for related microarray experiments [32]. However, only a small number of experiments with a simple design on the same microarray platform were manually selected, reanalyzed and included into the search strategy. The difficulty of reanalyzing complex experiments [33, 34] with limited annotation [35] and limited availability of raw data for historical microarray datasets, and considering intra- and interlaboratory as well as platform-dependent influences on data, impede the practical usage of such methods for an exhaustive search for similar experimental results.
In this paper, we present an approach for a quantitative comparison of a query dataset with published gene signatures. As a proof-of-concept design we focus on a database curated manually from numerous leukemia-related experiments using different microarray platforms. The approach is based on GSA methods together with an accurately annotated database including a simple taxonomy for leukemia subtypes. By means of investigating two exemplary datasets, we show that the approach is not only useful to verify published results, but also to detect putative linkages between different leukemia entities.
Results and Discussion
Outline
Figure 1 provides an overview of the proposed quantitative literature review process. First, the query dataset including the normalized microarray data as well as the studied phenotype variable has to be provided. For each gene signature in our database, the expression values of the signature's genes are read in the query dataset and scored, using the global test method [36], by their ability to explain the phenotypic variable of the query dataset. The resulting ranking of signatures, together with the association between taxonomy terms and signatures, is finally used to assess terms from our manually defined leukemia taxonomy. We implemented our approach as a web application [37] with special attention to visualization and exploratory representation of the results.

Overview of the analysis process. The proposed method relies on a manually curated database of leukemia-related published gene signatures annotated with terms from a predefined taxonomy. A new microarray dataset is analyzed in two steps. First, each signature is assessed by the global test method to constitute a ranking among the signatures. Secondly, the results from the first step are used to assess terms from the leukemia taxonomy that represent leukemia-related genetic aberrations and molecular mutations.
We initially had considered data from The Minimum Information about a Microarray Experiment (MIAME) standard [38], together with the MGED Ontology [39] to focus on an adequate description on how microarray data was obtained including many details about laboratory protocols, array design and samples used. However, these standards do not necessarily define a common format for a user-friendly description of gene signatures [40] and were therefore of limited usefulness for the construction of our database.
Database for published leukemia gene signatures
A manually curated and annotated database storing published gene signatures in a computer processable format is essential for the presented approach. Currently, our database contains 138 leukemia-related gene signatures that were manually selected from 37 published research articles [Additional file 1: Supplemental Table S1]. These 138 signatures contain overall approximately 18000 entries of accession numbers and microarray probe set identifiers, representing nearly 6000 different genes (Table 1).
All gene signatures are stored as a collection of platform-independent accession numbers from the GenBank database [41], thus representing the detected mRNA-sequences in a given experiment. This process outperforms gene-centric approaches based on gene identifiers like HGNC's gene symbols, since transcripts that have not been assigned to any approved gene symbol yet can be stored. In addition, the assignment of transcripts to genes may undergo changes over time that can be better tracked when accession numbers are used. Few gene signatures [42, 43] neither specifying accession numbers nor manufacturer specific microarray design identifiers that can be mapped to accession numbers are omitted. Accession numbers are regularly mapped to gene symbols using Entrez Gene and UniGene databases [44].
For interpretation of a gene signature it is necessary to store information about the underlying microarray experiment. Depending on the objective of the respective microarray study assessed for inclusion into the database, we distinguished between three types of signatures in our leukemia concept database. Diagnostic signatures report genes that are differentially expressed between two or more leukemia subtypes and thus can be used to discriminate certain disease categories. For instance, a gene signature used to discriminate between acute lymphoblastic leukemia (ALL) samples with different karyotypes [3] falls into this category. Prognostic signatures contain genes that are correlated with reported survival times [45]. The last type is a remainder group called Other, e.g., including a signature from a study reporting gene expression changes associated with certain treatment regimens [46, 47]. In addition to this basic classification, we described the characteristics of the patient samples that were studied in the microarray experiment by means of a specific taxonomy for leukemia subtypes. The taxonomy was constructed by successively adding leukemia entities and mutations that were studied by experiments in our database. It consists of three hierarchies. The first one describes different major groups of leukemia based on the affected cell lineages (lymphoid, myeloid). The second one describes chromosomal aberrations (e.g. translocations, inversions), while the third one describes single gene mutations (e.g. NPM1, CEBPA).
Assessment of gene signatures
A gene signature is considered potentially interesting, if the expression values of its genes in the query dataset are associated with the phenotype variable. Many different methods have been proposed to detect such sets of genes [20–22]. For our application, the global test method [48] was selected to test the self-contained null hypothesis [49] for each signature in our database. The resulting p-values are adjusted by Holm's method [50] to control the Family Wise Error Rate (FWER) and are used to rank the signatures. Informally, the self-contained null hypothesis states that there is no correlation in the query dataset between the phenotype variable and the gene expression values of any gene in the given signature. Hence, the self-contained null hypothesis is very restrictive. In terms of reproducibility of a gene signature, its rejection can be considered as a minimal requirement. However, the resulting p-values are a sensible criterion for ranking gene signatures.
The global test has been specified for categorical as well as continuous phenotype variables including right censored survival times [36, 51] so that gene signatures can be assessed in a similar way independent of the scale of measurement of the phenotype variable. In contrast to many other GSA methods, a parametric approximation of the null distribution of the global test's test statistic is available. Hence, the computational effort of testing all signatures is small and we thus implemented our approach as a web application.
The p-values derived from the global test are related to signatures as a whole. For subsequent interpretation it is often useful to inspect which genes within a signature contributed mostly to the test result. Goeman et al. [36] used a decomposition of the global test statistic into gene-wise statistics as shown in equation (1) to generate informative plots. We adapted these plots and further ordered the genes by hierarchical clustering with Euclidean distance and average linkage so that groups of genes that strongly influenced the test statistic can be easily identified (shown in Figures 2 and 3). The gene-wise statistics are divided by their standard deviation and plotted as horizontal bars. The black vertical line indicates their expectation under the null hypothesis.

NPM1 gene signature from Verhaak et al. Verhaak et al. [57] published a NPM1 signature of 68 accession numbers that correspond to 40 genes. These genes were measured by 89 probe sets in the query dataset. A bar is plotted for each probe representing the value contributed by that probe set to the global test statistic. The expectation of these values under the null hypothesis of no correlation between NPM1 status and gene expression in the query dataset is indicated by the vertical black line. Overall, most genes reported by Verhaak et al. were also highly correlated with the NPM1 mutation status in our dataset. The colors indicate the direction of regulation. E.g., CD200 and BAALC were downregulated in NPM1-mutated samples, while most of the HOXA@ and HOXB@ genes showed increased expression in NPM1-mutated AML samples with a normal karyotype.

t(11q23)/MLL gene signature from Ross et al. Gene-wise test statistics are shown for a subset of 85 probe sets allocated to genes as reported by Ross et al. [59] to be associated with translocation t(11q23)/MLL. The full plot with all 185 probe sets that could be mapped to the signature from Ross et al. (100 accession numbers) is provided online [Additional file 1: Supplemental Figure S1]. The high correlation of the expression pattern of the Ross et al. signature with the NPM1 status in the query dataset was mainly caused by the TALE genes (MEIS1 and PBX3) and by some HOXA@ family genes. This was characteristic for the t(11q23)/MLL signatures in our database and is consistent with results reported in [61].
Assessment of taxonomy terms
After assessment of all gene signatures in the database, the focus is shifted from single experiments to leukemia subtypes and their underlying genetic mutations that are modeled in the leukemia taxonomy. A taxonomy term can be considered of relevance with respect to the query dataset, if the ranks of the gene signatures associated with that term are low. For each term, the one-sided Mann-Whitney U-test is used to compare the ranks of associated signatures to the ranks of all other signatures. Due to the explorative nature of these tests, the resulting p-values are not adjusted for multiple testing. Depending on whether the differentiation of leukemia subtypes or survival times were studied in the query dataset, only Diagnostic signatures or Prognostic signatures were used for the described assessment of taxonomy terms.
The taxonomy terms together with the p-values are useful for exploring relations between the studied phenotype in the query dataset and leukemia subtypes with their specific mutations based on the knowledge gathered from many microarray studies. A low p-value of a term indicates that genes known to be associated with the leukemia entity represented by the term are correlated with the phenotype variable in the given query dataset.
Example analyses
Differential expression between acute leukemia types
Golub et al. [2] published a signature of 50 genes that were differentially expressed between acute myeloid leukemia (AML) and acute lymphoblastic leukemia (ALL). Following that approach, van Delft et al. [52] studied differences in gene expression between pediatric AML and ALL patient samples and also presented a list of differentially expressed genes. About their gene signature, van Deft et al. stated: "This gene list is almost entirely different from a previously published set of genes that discriminate ALL from AML (Golub et al.), with only LYN and ARHG in common between these two lists." However, they demonstrated that their AML and ALL samples could be distinguished based on the Golub et al. signature, thus any missing agreement of their results was probably due to the number of overlapping genes being an unsuitable measurement.
To run our literature comparison, the dataset from van Delft et al. (59 ALL and 18 AML samples) was normalized using the Variance-Stabilizing Normalization method [53] and used as query dataset in the following example. Besides the gene signature described above, in their accompanying supplemental material van Delft et al. published an additional gene signature discriminating AML from ALL generated by using a different statistical gene selection method. These two signatures as well as the Golub et al. signature are the sole AML/ALL gene signatures stored in our database. Applying the global test to all gene signatures based on the dataset from van Delft et al. with the AML/ALL status as phenotype variable leads to many small p-values, because differences in gene expression between AML and ALL are distinctive. Nevertheless, the ranking remains reasonable. The signatures from van Delft et al. occupied the ranks one and three while the signature obtained by Golub and colleagues had the second position [Additional file 1: Supplemental Table S2]. The taxonomy terms "ALL" and "AML" had the first and second rank [Additional file 1: Supplemental Table S3].
Although van Delft et al. used a different microarray platform than Golub et al. and the overlap of the gene signatures was small, our GSA based approach successfully detected the signature from Golub et al. as potentially interesting and placed it at the second position. Intriguingly, one signature published in the article by van Delft et al. [52] and thus generated from the query dataset itself ranked below the Golub et al. signature. That may be caused by the impact of different data analysis procedures on gene lists [17, 54]. Differences between adult and pediatric patients seem not to have a strong influence in this analysis.
NPM1 mutation in AML with normal karyotype
In a recent multi-center study, 251 gene expression profiles of AML specimens with normal karyotype were generated to delineate differential gene expression signatures corresponding to distinct gene mutations [55]. 138 of the 251 cases had a confirmed nucleophosmin gene (NPM1) mutation. The raw data can be accessed through the Gene Expression Omnibus database [31] (GSE15434). We applied the Robust Multichip Average algorithm [56] to normalize the data. Then, we used our approach to compare the differences in gene expression between NPM1-mutated and NPM1 wild type cases observed in this new dataset with previously reported results from our database.
First, all 138 gene signatures in the database were assessed by the global test and ranked according to their p-values. 8 signatures were annotated with the term "NPM1 mutated" from our taxonomy. These 8 signatures ranked among the first 21 signatures as shown in Table 2 and had highly significant p-values (FWER < 0.01) due to the large number of samples and the strength of changes in gene expression induced by NPM1 mutations. The first ranked signature was a NPM1 signature published by Verhaak et al. [57]. Figure 2 shows the contribution of single genes reported by Verhaak et al. on the global test result. In particular, many reported HOXA and HOXB family cluster genes as well as MEIS1 were also highly correlated with the NPM1 status in our query dataset.
The result of the subsequent assessment of taxonomy terms is given in Table 3. Besides the NPM1 mutation, the translocation t(11q23)/MLL on the second-ranked position also had a noticeable low p-value [58]. This indicates that t(11q23)/MLL partially affects the differential expression of the same genes as the NPM1 mutation in our query dataset. Figure 3 provides an insight into the expression patterns of the genes reported by Ross et al. [59] (rank 9). Apparently, the differential expression of some HOX family cluster genes were affected by both the MLL gene rearrangement and the NPM1 mutations. Thus, we verified the published NPM1 signatures by means of the new dataset and detected potentially new associations to other chromosomal aberrations as well.
Conclusions
The presented approach allows a comprehensive and quantitative comparison of experimental microarray data with previously published results across different array platforms and microarray designs. The database is designed as an open structure to be independent from microarray manufacturer or differing chip designs. By means of an exemplary research topic, i.e. differential gene expression in leukemia subtypes, we have demonstrated that the approach is not only useful to verify published results but may also detect novel associations between genetic aberrations and gene mutations that affect the same biological processes and cellular pathways. It is expected that the same approach can also be extended to other areas of interest, such as querying signatures for other cancer types, microRNAs, DNA or histone methylation of promoter regions, or distinct signaling pathways. An implementation of our approach as well as the database itself and further example analyses are freely available on our website [37].
Methods
Global test
Goeman et al. give a general derivation of their global test as a score test in [48]. Here, the phenotype variable was binary in both presented examples, so that the global test could be specified within a logistic regression model as in [36] with test statistic
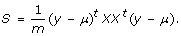
X = (x
ij
) denotes a n × m matrix of gene expression values of n arrays and m genes (all genes from the query dataset that are elements of the tested gene signature). y is the vector of the n observed phenotypes. μ is the expectation and σ the standard deviation of the phenotype variable, which are supposed to be known in this section. S has expectation ES =  tr(XXt) and variance VarS ≈
  tr(XXt)2 under the null hypothesis. S can be written as a sum of gene-wise terms:
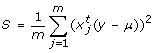
For better comparability these m gene-wise terms were divided by their standard deviation before they were used to create the bar plots shown in Figures 2 and 3.
The null distribution of S is approximated by a series expansion in chi-square distribution functions as implemented in the R package globaltest [36]. Very small p-values (< 10-12) may not be numerically reliable. For that reason, only p-values up to 10-12 are used to rank signatures whereas the standardized test statistic  = (S - ES)/VarS is used to rank remaining gene signatures with p < 10-12.
Mann-Whitney U-test
The assessment of the taxony terms is based on the ranking derived from the global test of all n = 112 Diagnostic signatures. Let r
i
denote the rank of the i-th signature and T
j
is the set of all signatures associated with taxonomy term t
j
. For each term in our taxonomy with at least one associated gene signature, the one-sided Mann-Whitney U-test is used to test the null hypothesis, that the distribution of the global test's p-values of the signatures in T
j
differ by a location shift of c ≥ 0 from the distribution of p-values of the signatures that are not in T
j
. The test statistic W
j
=  is standardized and a normal approximation with continuity correction is used to calculate p-values. This results in 34 dependet p-values, which are not corrected for multiple testing due to the explorative nature of the taxonomy analysis.
Implementation
We used Axis2 to implement a Web Service interface to our PostgreSQL database that stores the gene signatures. The taxonomy was modeled in the Web Ontology Language (OWL). All tests were computed within R/Bioconductor [60] and the globaltest package [36]. Java Server Pages were used to realize the web-based graphical user interface.
References
Wouters BJ, Löwenberg B, Delwel R: A decade of genome-wide gene expression profiling in acute myeloid leukemia: flashback and prospects. Blood 2009, 113(2):291–8. 10.1182/blood-2008-04-153239
Golub TR, Slonim DK, Tamayo P, Huard C, Gaasenbeek M, Mesirov JP, Coller H, Loh ML, Downing JR, Caligiuri MA, Bloomfield CD, Lander ES: Molecular classification of cancer: class discovery and class prediction by gene expression monitoring. Science 1999, 286(5439):531–7. 10.1126/science.286.5439.531
Yeoh EJ, Ross ME, Shurtleff SA, Williams WK, Patel D, Mahfouz R, Behm FG, Raimondi SC, Relling MV, Patel A, Cheng C, Campana D, Wilkins D, Zhou X, Li J, Liu H, Pui CH, Evans WE, Naeve C, Wong L, Downing JR: Classification, subtype discovery, and prediction of outcome in pediatric acute lymphoblastic leukemia by gene expression profiling. Cancer Cell 2002, 1(2):133–43. 10.1016/S1535-6108(02)00032-6
Schoch C, Kohlmann A, Schnittger S, Brors B, Dugas M, Mergenthaler S, Kern W, Hiddemann W, Eils R, Haferlach T: Acute myeloid leukemias with reciprocal rearrangements can be distinguished by specific gene expression profiles. Proc Natl Acad Sci USA 2002, 99(15):10008–13. 10.1073/pnas.142103599
Kohlmann A, Schoch C, Schnittger S, Dugas M, Hiddemann W, Kern W, Haferlach T: Pediatric acute lymphoblastic leukemia (ALL) gene expression signatures classify an independent cohort of adult ALL patients. Leukemia 2004, 18: 63–71. 10.1038/sj.leu.2403167
Bullinger L, Döhner K, Bair E, Fröhling S, Schlenk RF, Tibshirani R, Döhner H, Pollack JR: Use of gene-expression profiling to identify prognostic subclasses in adult acute myeloid leukemia. N Engl J Med 2004, 350(16):1605–16. 10.1056/NEJMoa031046
Valk PJ, Verhaak RG, Beijen MA, Erpelinck CA, Barjesteh van Waalwijk van Doorn-Khosrovani S, Boer JM, Beverloo HB, Moorhouse MJ, Spek PJ, Löwenberg B, Delwel R: Prognostically useful gene-expression profiles in acute myeloid leukemia. N Engl J Med 2004, 350(16):1617–28. 10.1056/NEJMoa040465
Deng X, Xu J, Wang C: Improving the power for detecting overlapping genes from multiple DNA microarray-derived gene lists. BMC Bioinformatics 2008, 9(Suppl 6):S14. 10.1186/1471-2105-9-S6-S14
Shi L, Jones WD, Jensen RV, Harris SC, Perkins RG, Goodsaid FM, Guo L, Croner LJ, Boysen C, Fang H, Qian F, Amur S, Bao W, Barbacioru CC, Bertholet V, Cao XM, Chu TM, Collins PJ, Fan XH, Frueh FW, Fuscoe JC, Guo X, Han J, Herman D, Hong H, Kawasaki ES, Li QZ, Luo Y, Ma Y, Mei N, Peterson RL, Puri RK, Shippy R, Su Z, Sun YA, Sun H, Thorn B, Turpaz Y, Wang C, Wang SJ, Warrington JA, Willey JC, Wu J, Xie Q, Zhang L, Zhang L, Zhong S, Wolfinger RD, Tong W: The balance of reproducibility, sensitivity, and specificity of lists of differentially expressed genes in microarray studies. BMC Bioinformatics 2008, 9(Suppl 9):S10. 10.1186/1471-2105-9-S9-S10
Ein-Dor L, Kela I, Getz G, Givol D, Domany E: Outcome signature genes in breast cancer: is there a unique set? Bioinformatics 2005, 21(2):171–8. 10.1093/bioinformatics/bth469
Ein-Dor L, Zuk O, Domany E: Thousands of samples are needed to generate a robust gene list for predicting outcome in cancer. Proc Natl Acad Sci USA 2006, 103(15):5923–8. 10.1073/pnas.0601231103
Miklos GL, Maleszka R: Microarray reality checks in the context of a complex disease. Nat Biotechnol 2004, 22(5):615–21. 10.1038/nbt965
Tan PK, Downey TJ, Spitznagel EL, Xu P, Fu D, Dimitrov DS, Lempicki RA, Raaka BM, Cam MC: Evaluation of gene expression measurements from commercial microarray platforms. Nucleic Acids Res 2003, 31(19):5676–84. 10.1093/nar/gkg763
Chen JJ, Hsueh HM, Delongchamp RR, Lin CJ, Tsai CA: Reproducibility of microarray data: a further analysis of microarray quality control (MAQC) data. BMC Bioinformatics 2007, 8: 412. 10.1186/1471-2105-8-412
Zhang M, Yao C, Guo Z, Zou J, Zhang L, Xiao H, Wang D, Yang D, Gong X, Zhu J, Li Y, Li X: Apparently low reproducibility of true differential expression discoveries in microarray studies. Bioinformatics 2008, 24(18):2057–63. 10.1093/bioinformatics/btn365
Nilsson R, Bjorkegren J, Tegner J: On reliable discovery of molecular signatures. BMC Bioinformatics 2009, 10: 38. 10.1186/1471-2105-10-38
Boulesteix A, Slawski M: Stability and aggregation of ranked gene lists. Brief Bioinform 2009, 10(5):556–68. 10.1093/bib/bbp034
Newman JC, Weiner AM: L2L: a simple tool for discovering the hidden significance in microarray expression data. Genome Biol 2005, 6(9):R81. 10.1186/gb-2005-6-9-r81
Cahan P, Ahmad AM, Burke H, Fu S, Lai Y, Florea L, Dharker N, Kobrinski T, Kale P, McCaffrey TA: List of lists-annotated (LOLA): a database for annotation and comparison of published microarray gene lists. Gene 2005, 360: 78–82. 10.1016/j.gene.2005.07.008
Song S, Black MA: Microarray-based gene set analysis: a comparison of current methods. BMC Bioinformatics 2008, 9: 502. 10.1186/1471-2105-9-502
Liu Q, Dinu I, Adewale AJ, Potter JD, Yasui Y: Comparative evaluation of gene-set analysis methods. BMC Bioinformatics 2007, 8: 431. 10.1186/1471-2105-8-431
Ackermann M, Strimmer K: A general modular framework for gene set enrichment analysis. BMC Bioinformatics 2009, 10: 47. 10.1186/1471-2105-10-47
Nam D, Kim SY: Gene-set approach for expression pattern analysis. Brief Bioinform 2008, 9(3):189–97. 10.1093/bib/bbn001
Huang DW, Sherman BT, Lempicki RA: Bioinformatics enrichment tools: paths toward the comprehensive functional analysis of large gene lists. Nucleic Acids Res 2009, 37: 1–13. 10.1093/nar/gkn923
Ashburner M, Ball CA, Blake JA, Botstein D, Butler H, Cherry JM, Davis AP, Dolinski K, Dwight SS, Eppig JT, Harris MA, Hill DP, Issel-Tarver L, Kasarskis A, Lewis S, Matese JC, Richardson JE, Ringwald M, Rubin GM, Sherlock G: Gene ontology: tool for the unification of biology. Nat Genet 2000, 25: 25–9. 10.1038/75556
Subramanian A, Tamayo P, Mootha VK, Mukherjee S, Ebert BL, Gillette MA, Paulovich A, Pomeroy SL, Golub TR, Lander ES, Mesirov JP: Gene set enrichment analysis: A knowledge-based approach for interpreting genome-wide expression profiles. Proc Natl Acad Sci USA 2005, 102(43):15545–50. 10.1073/pnas.0506580102
Kim SY, Volsky DJ: PAGE: parametric analysis of gene set enrichment. BMC Bioinformatics 2005, 6: 144. 10.1186/1471-2105-6-144
Manoli T, Gretz N, Gröne HJ, Kenzelmann M, Eils R, Brors B: Group testing for pathway analysis improves comparability of different microarray datasets. Bioinformatics 2006, 22(20):2500–6. 10.1093/bioinformatics/btl424
Rhodes DR, Kalyana-Sundaram S, Mahavisno V, Varambally R, Yu J, Briggs BB, Barrette TR, Anstet MJ, Kincead-Beal C, Kulkarni P, Varambally S, Ghosh D, Chinnaiyan AM: Oncomine 3.0: genes, pathways, and networks in a collection of 18,000 cancer gene expression profiles. Neoplasia 2007, 9(2):166–80. 10.1593/neo.07112
Lamb J, Crawford ED, Peck D, Modell JW, Blat IC, Wrobel MJ, Lerner J, Brunet JP, Subramanian A, Ross KN, Reich M, Hieronymus H, Wei G, Armstrong SA, Haggarty SJ, Clemons PA, Wei R, Carr SA, Lander ES, Golub TR: The connectivity map: using gene-expression signatures to connect small molecules, genes, and disease. Science 2006, 313(5795):1929–35. 10.1126/science.1132939
Barrett T, Troup DB, Wilhite SE, Ledoux P, Rudnev D, Evangelista C, Kim IF, Soboleva A, Tomashevsky M, Marshall KA, Phillippy KH, Sherman PM, Muertter RN, Edgar R: NCBI GEO: archive for high-throughput functional genomic data. Nucleic Acids Res 2009, (37 Database):D885–90. 10.1093/nar/gkn764
Tanner SW, Agarwal P: Gene Vector Analysis (Geneva): a unified method to detect differentially-regulated gene sets and similar microarray experiments. BMC Bioinformatics 2008, 9: 348. 10.1186/1471-2105-9-348
Ioannidis JP, Allison DB, Ball CA, Coulibaly I, Cui X, Culhane AC, Falchi M, Furlanello C, Game L, Jurman G, Mangion J, Mehta T, Nitzberg M, Page GP, Petretto E, van Noort V: Repeatability of published microarray gene expression analyses. Nat Genet 2009, 41(2):149–55. 10.1038/ng.295
Tibshirani R, Efron B: Pre-validation and inference in microarrays. Stat Appl Genet Mol Biol 2002, 1: 1.
Tomlinson C, Thimma M, Alexandrakis S, Castillo T, Dennis JL, Brooks A, Bradley T, Turnbull C, Blaveri E, Barton G, Chiba N, Maratou K, Soutter P, Aitman T, Game L: MiMiR - an integrated platform for microarray data sharing, mining and analysis. BMC Bioinformatics 2008, 9: 379. 10.1186/1471-2105-9-379
Goeman JJ, Geer SA, de Kort F, van Houwelingen HC: A global test for groups of genes: testing association with a clinical outcome. Bioinformatics 2004, 20: 93–99. 10.1093/bioinformatics/btg382
Leukemia Gene Signature Database[http://medbioinfo.uni-muenster.de/lgdb]
Brazma A, Hingamp P, Quackenbush J, Sherlock G, Spellman P, Stoeckert C, Aach J, Ansorge W, Ball CA, Causton HC, Gaasterland T, Glenisson P, Holstege FC, Kim IF, Markowitz V, Matese JC, Parkinson H, Robinson A, Sarkans U, Schulze-Kremer S, Stewart J, Taylor R, Vilo J, Vingron M: Minimum information about a microarray experiment (MIAME)-toward standards for microarray data. Nat Genet 2001, 29(4):365–71. 10.1038/ng1201-365
Whetzel PL, Parkinson H, Causton HC, Fan L, Fostel J, Fragoso G, Game L, Heiskanen M, Morrison N, Rocca-Serra P, Sansone SA, Taylor C, White J, Stoeckert CJ Jr: The MGED Ontology: a resource for semantics-based description of microarray experiments. Bioinformatics 2006, 22(7):866–73. 10.1093/bioinformatics/btl005
Cahan P, Rovegno F, Mooney D, Newman JC, St Laurent m, McCaffrey TA: Meta-analysis of microarray results: challenges, opportunities, and recommendations for standardization. Gene 2007, 401(1–2):12–8. 10.1016/j.gene.2007.06.016
Benson DA, Karsch-Mizrachi I, Lipman DJ, Ostell J, Sayers EW: GenBank. Nucleic Acids Res 2009, (37 Database):D26–31. 10.1093/nar/gkn723
Alcalay M, Meani N, Gelmetti V, Fantozzi A, Fagioli M, Orleth A, Riganelli D, Sebastiani C, Cappelli E, Casciari C, Sciurpi MT, Mariano AR, Minardi SP, Luzi L, Muller H, Di Fiore PP, Frosina G, Pelicci PG: Acute myeloid leukemia fusion proteins deregulate genes involved in stem cell maintenance and DNA repair. J Clin Invest 2003, 112(11):1751–61.
Baldus CD, Liyanarachchi S, Mrózek K, Auer H, Tanner SM, Guimond M, Ruppert AS, Mohamed N, Davuluri RV, Caligiuri MA, Bloomfield CD, de la Chapelle A: Acute myeloid leukemia with complex karyotypes and abnormal chromosome 21: Amplification discloses overexpression of APP, ETS2, and ERG genes. Proc Natl Acad Sci USA 2004, 101(11):3915–20. 10.1073/pnas.0400272101
Sayers EW, Barrett T, Benson DA, Bryant SH, Canese K, Chetvernin V, Church DM, DiCuccio M, Edgar R, Federhen S, Feolo M, Geer LY, Helmberg W, Kapustin Y, Landsman D, Lipman DJ, Madden TL, Maglott D, Miller V, Mizrachi I, Ostell J, Pruitt KD, Schuler GD, Sequeira E, Sherry ST, Shumway M, Sirotkin K, Souvorov A, Starchenko G, Tatusova TA, Wagner L, Yaschenko E, Ye J: Database resources of the National Center for Biotechnology Information. Nucleic Acids Res 2009, (37 Database):D5–15. 10.1093/nar/gkn741
Metzeler KH, Hummel M, Bloomfield CD, Spiekermann K, Braess J, Sauerland MC, Heinecke A, Radmacher M, Marcucci G, Whitman SP, Maharry K, Paschka P, Larson RA, Berdel WE, Büchner T, Wörmann B, Mansmann U, Hiddemann W, Bohlander SK, Buske C: An 86-probe-set gene-expression signature predicts survival in cytogenetically normal acute myeloid leukemia. Blood 2008, 112(10):4193–201. 10.1182/blood-2008-02-134411
Cheok MH, Yang W, Pui CH, Downing JR, Cheng C, Naeve CW, Relling MV, Evans WE: Treatment-specific changes in gene expression discriminate in vivo drug response in human leukemia cells. Nat Genet 2003, 34: 85–90. 10.1038/ng1151
Stegmaier K, Ross KN, Colavito SA, O'Malley S, Stockwell BR, Golub TR: Gene expression-based high-throughput screening(GE-HTS) and application to leukemia differentiation. Nat Genet 2004, 36(3):257–63. 10.1038/ng1305
Goeman JJ, Geer SA, van Houwelingen HC: Testing against a high dimensional alternative. J Royal Stat Soc B 2006, 68(3):477–493. 10.1111/j.1467-9868.2006.00551.x
Goeman JJ, Buhlmann P: Analyzing gene expression data in terms of gene sets: methodological issues. Bioinformatics 2007, 23(8):980–987. 10.1093/bioinformatics/btm051
Holm S: A simple sequentially rejective multiple test procedure. Scand J Stat 1979, 6(2):65–70.
Goeman JJ, Oosting J, Cleton-Jansen AM, Anninga JK, van Houwelingen HC: Testing association of a pathway with survival using gene expression data. Bioinformatics 2005, 21(9):1950–1957. 10.1093/bioinformatics/bti267
van Delft FW, Bellotti T, Luo Z, Jones LK, Patel N, Yiannikouris O, Hill AS, Hubank M, Kempski H, Fletcher D, Chaplin T, Foot N, Young BD, Hann IM, Gammerman A, Saha V: Prospective gene expression analysis accurately subtypes acute leukaemia in children and establishes a commonality between hyperdiploidy and t(12;21) in acute lymphoblastic leukaemia. Br J Haematol 2005, 130: 26–35. 10.1111/j.1365-2141.2005.05545.x
Huber W, von Heydebreck A, Sueltmann H, Poustka A, Vingron M: Variance stabilization applied to microarray data calibration and to the quantification of differential expression. Bioinformatics 2002, 18(Suppl 1):S96-S104.
Shi L, Tong W, Fang H, Scherf U, Han J, Puri RK, Frueh FW, Goodsaid FM, Guo L, Su Z, Han T, Fuscoe JC, Xu ZA, Patterson TA, Hong H, Xie Q, Perkins RG, Chen JJ, Casciano D: Cross-platform comparability of microarray technology: intra-platform consistency and appropriate data analysis procedures are essential. BMC Bioinformatics 2005, 6(Suppl 2):S12. 10.1186/1471-2105-6-S2-S12
Kohlmann A, Bullinger L, Thiede C, Schaich M, Schnittger S, Dohner K, Dugas M, Dohner H, Ehninger G, Haferlach T: Gene expression profiling in AML with normal karyotype: A multicenter study investigating molecular markers in 252 cases. Blood (ASH Annual Meeting Abstracts) 2008, 112(11):751.
Irizarry RA, Hobbs B, Collin F, Beazer-Barclay YD, Antonellis KJ, Scherf U, Speed TP: Exploration, normalization, and summaries of high density oligonucleotide array probe level data. Biostatistics 2003, 4(2):249–64. 10.1093/biostatistics/4.2.249
Verhaak RG, Wouters BJ, Erpelinck CA, Abbas S, Beverloo HB, Lugthart S, Löwenberg B, Delwel R, Valk PJ: Prediction of molecular subtypes in acute myeloid leukemia based on gene expression profiling. Haematologica 2009, 94: 131–4. 10.3324/haematol.13299
Meyer C, Kowarz E, Hofmann J, Renneville A, Zuna J, Trka J, Ben Abdelali R, Macintyre E, De Braekeleer E, De Braekeleer M, Delabesse E, de Oliveira MP, Cavé H, Clappier E, van Dongen JJ, Balgobind BV, Heuvel-Eibrink MM, Beverloo HB, Panzer-Grümayer R, Teigler-Schlegel A, Harbott J, Kjeldsen E, Schnittger S, Koehl U, Gruhn B, Heidenreich O, Chan LC, Yip SF, Krzywinski M, Eckert C, Möricke A, Schrappe M, Alonso CN, Schäfer BW, Krauter J, Lee DA, Zur Stadt U, Te Kronnie G, Sutton R, Izraeli S, Trakhtenbrot L, Lo Nigro L, Tsaur G, Fechina L, Szczepanski T, Strehl S, Ilencikova D, Molkentin M, Burmeister T, Dingermann T, Klingebiel T, Marschalek R: New insights to the MLL recombinome of acute leukemias. Leukemia 2009, 23(8):1490–9. 10.1038/leu.2009.33
Ross ME, Mahfouz R, Onciu M, Liu HC, Zhou X, Song G, Shurtleff SA, Pounds S, Cheng C, Ma J, Ribeiro RC, Rubnitz JE, Girtman K, Williams WK, Raimondi SC, Liang DC, Shih LY, Pui CH, Downing JR: Gene expression profiling of pediatric acute myelogenous leukemia. Blood 2004, 104(12):3679–87. 10.1182/blood-2004-03-1154
Gentleman RC, Carey VJ, Bates DM, Bolstad B, Dettling M, Dudoit S, Ellis B, Gautier L, Ge Y, Gentry J, Hornik K, Hothorn T, Huber W, Iacus S, Irizarry R, Leisch F, Li C, Maechler M, Rossini AJ, Sawitzki G, Smith C, Smyth G, Tierney L, Yang JY, Zhang J: Bioconductor: open software development for computational biology and bioinformatics. Genome Biol 2004, 5(10):R80. 10.1186/gb-2004-5-10-r80
Mullighan CG, Kennedy A, Zhou X, Radtke I, Phillips LA, Shurtleff SA, Downing JR: Pediatric acute myeloid leukemia with NPM1 mutations is characterized by a gene expression profile with dysregulated HOX gene expression distinct from MLL-rearranged leukemias. Leukemia 2007, 21(9):2000–9. 10.1038/sj.leu.2404808
Acknowledgements
This study was supported by COST Action BM0801 Translating genomic and epigenetic studies of MDS and AML (EuGESMA) and by the European Leukemia Network of Excellence (ELN).
Author information
Authors and Affiliations
Corresponding author
Additional information
Authors' contributions
HUK designed and implemented the method, wrote the manuscript and analyzed results. CR participated in the design of the method and implemented the method. AK analyzed results, improved the method, and contributed to writing the manuscript. LB, CT and TH performed research and interpreted results. MD improved the design and analyzed results. All authors read and approved the final manuscript.
Electronic supplementary material
12859_2009_3152_MOESM1_ESM.PDF
Additional file 1: Supplementary information. Detailed information about the content of the leukemia gene signature database, complete rankings of gene signatures and taxonomy terms for both example analyses presented in the article and additional information about the stability of the taxonomy term ranking. (PDF 257 KB)
Authors’ original submitted files for images
Below are the links to the authors’ original submitted files for images.
Rights and permissions
This article is published under license to BioMed Central Ltd. This is an Open Access article distributed under the terms of the Creative Commons Attribution License (http://creativecommons.org/licenses/by/2.0), which permits unrestricted use, distribution, and reproduction in any medium, provided the original work is properly cited.
About this article
Cite this article
Klein, HU., Ruckert, C., Kohlmann, A. et al. Quantitative comparison of microarray experiments with published leukemia related gene expression signatures. BMC Bioinformatics 10, 422 (2009). https://doi.org/10.1186/1471-2105-10-422
Received:
Accepted:
Published:
DOI: https://doi.org/10.1186/1471-2105-10-422