
Abstract
This study explored potential sources of differential item functioning (DIF) among accommodated and nonaccommodated groups by examining skills and cognitive processes hypothesized to underlie student performance on the National Assessment for Educational Progress (NAEP). Out of 53 released NAEP items in 2007 for grade 8, a total of 25 items were flagged as DIF among the four studied groups (nonaccommodated, accommodated with extra time, accommodated with read aloud, and accommodated with small groups) by a generalized logistic regression method. The Reparameterized Unified Model was fit to the same data using a Q-matrix containing 25 skills that included content-, process-, and item-type attributes. The nonaccommodated group yielded the highest averages of attribute mastery probabilities as well as the largest proportion of mastered examinees among all the groups. The three accommodated groups tended to have similar attribute mastery means, with the group accommodated with small groups yielding a larger proportion of mastery examinees when compared to the other two accommodated groups.

Notes
The Journal of Educational Measurement (2007, no. 4) had a special issue on the IRT-based CDMs and related methods.
The difGenLogistic function allows for studying uniform, nonuniform, or both types of DIF. It investigates one item at a time and treats the rest of the items as DIF-free, unless item purification is used. The generalized logistic regression DIF model, as presented by Magis et al. (2011), has the following form: \( {\text{logit}}\left( {\pi_{ig} } \right) = \alpha + \beta S_{i} + \alpha_{g} + \beta_{g} S_{i} , \) where \( \pi_{ig} \) is the probability of examinee i from group g correctly responding to an item, logit is the natural log of the odds of correctly answering an item, \( \alpha \) and \( \beta \) are common intercept and slope parameters (i.e., for all groups), \( \alpha_{g} \) and \( \beta_{g} \) are group-specific intercept and slope parameters, and \( S_{i} \) is the total test score for examinee i (a matching variable and a proxy for the ability level of the examinee). An item is said to contain DIF if the probability \( \pi_{ig} \) varies across the groups of examinees, meaning that there is an interaction between group membership and the item response. When all group-specific parameters equal zero, we would conclude the absence of DIF. Specifically, the following three hypotheses can be tested with regard to DIF using the difGenLogistic function: (a) \( H_{0} : \alpha_{1} = \cdots = \alpha_{F} |\beta_{1} = \cdots = \beta_{F} = 0 \), when testing for uniform DIF; (b) \( H_{0} : \beta_{1} = \cdots = \beta_{F} = 0 \), when testing for nonuniform DIF, and (c) \( H_{0} : \alpha_{1} = \cdots = \alpha_{F} = \beta_{1} = \cdots = \beta_{F} = 0 \), when testing for both types of DIF. Using maximum likelihood, the null hypotheses are tested using different methods, such as the Wald test or, as in our study, the likelihood ratio test.
We refer here to the initial Q-matrix used in the RUM analysis. As we explain later, our focus shifts to the DIF items that elicited 24 attributes from the list of the original 25 skills. One processing attribute (applying and evaluating mathematical correctness) was coded as present in the 53 examined items but was not found to be associated with the DIF identified items.
Proportion (percent) correct in NAEP represents the proportion of all US students that would have gotten an item correct on the NAEP assessment had all students received an opportunity to respond to the item. Due to the multistage and stratified random sampling design used by NAEP, proportion correct values and their standard errors are calculated using student sampling weights via the jackknife repeated replication procedure (Brown et al. 2015). Readers are directed to the NAEP Primer (Allen et al. 2001) and other published technical reports (e.g., Beaton et al. 2011) for technical details.
Three SCR items in Panel (c) in Table 1 were scored dichotomously by NAEP, while the remaining two SCR items were scored on three- or four-point scales. In the analysis, all items were dichotomized by researchers.
References
Allen NL, Donoghue JR, Schoeps TL (2001) NAEP technical report. National Center for Education Statistics, Washington, DC
American Psychological Association, National Council on Measurement in Education, American Educational Research Association (1999) Standards for educational and psychological testing. American Educational Research Association, Washington, DC
American Psychological Association, National Council on Measurement in Education, American Educational Research Association (2014) Standards for educational and psychological testing. American Educational Research Association, Washington, DC
Beaton A, Rogers A, Gonzalez E, Hanly M, Kolstad A, Rust K et al (2011) NAEP primer. National Center for Education Statistics, Washington, DC
Bolt SE, Ysseldyke J (2008) Accommodating students with disabilities in large-scale testing: a comparison of differential item functioning (DIF) identified across disability types. J Psychoeduc Assessm 26(2):121–138
Bolt D, Chen H, DiBello LV, Hartz SM, Henson R, Roussos LA, Stout WF, Templin J (2008) The Arpeggio suite: Software for cognitive skills diagnostic assessment [Computer software and manual]. Assessment Systems, St. Paul
Brown N, Dai S, Svetina D (2015) Analyzing NAEP data at the item level. In: Kloosterman P, Mohr D, Walcott C (eds) What mathematics do students know and how is that knowledge changing? Evidence from the National Assessment of Educational Progress. Information Age Publishing, North Carolina
Buzick, H., Stone, E. (2011). Recommendations for conducting differential item functioning (DIF) analyses for students with disabilities based on previous DIF studies. Research Report. ETS RR–11–34. Educational Testing Service, Princeton
Buzick H, Stone E (2014) A meta-analysis of research on the read aloud accommodation. Educ Meas Issues Pract 33(3):17–30
Camilli G (2006) Test fairness. In: Brennan RL (ed) Educational measurement, 4th edn. American Council on Education/Praeger, Westport, pp 221–256
Clauser BE, Mazor KM (1998) Using statistical procedures to identify differentially functioning test items. Educ Meas Issues Pract 17:31–44. doi:10.1111/j.1745-3992.1998.tb00619.x
Cohen AS, Gregg N, Deng M (2005) The role of extended time and item content on a high-stakes mathematics test. Learn Disabilit Res Pract 20(4):225–233
Cook L, Eignor D, Sawaki Y, Steinberg J, Cline F (2010) Using factor analysis to investigate accommodations used by students with disabilities on an English—language arts assessment. Appl Measur Educ 23(2):187–208
Cormier DC, Altman JR, Shyyan V, Thurlow ML (2010) A summary of the research on the effects of test accommodations: 2007–2008 (Technical Report 56). University of Minnesota, National Center on Educational Outcomes, Minneapolis
de la Torre J (2009) A cognitive diagnosis model for cognitively based multiple-choice options. Appl Psychol Meas 33(3):163–183
DiBello LV, Roussos L, Stout WF (2007) Review of cognitively diagnostic assessment and a summary of psychometric models. In: Rao CR, Sinharay S (eds) Handbook of statistics, vol 26. Amsterdam, Elsevier, pp 979–1030
Engelhard G (2009) Using item response theory and model–data fit to conceptualize differential item and person functioning for students with disabilities. Educ Psychol Measur 69(4):585–602. doi:10.1177/0013164408323240
Ferne T, Rupp AA (2007) A synthesis of 15 years of research on DIF in language testing: methodological advances, challenges, and recommendations. Lang Assess Q 4(2):113–148
Fu J, Li Y (2007) Cognitively diagnostic psychometric models: an integrative review. In: Paper presented at the annual meeting of the National Council on Measurement in Education, Chicago, IL
Hambleton R, Rogers H (1989) Detecting potentially biased test items: comparison of IRT area and Mantel-Haenszel methods. Appl Measur Educ 2(4):313–334
Hartz SM (2002) A Bayesian framework for the unified model for assessing cognitive abilities: blending theory with practicality (Unpublished doctoral dissertation). University of Illinois at Urbana, Champaign, IL
Hartz SM, Roussos LA (2008) The fusion model for skills diagnosis: blending theory with practice. Research Report. ETS RR–08–71. Educational Testing Service, Princeton
Henson RA, Roussos L, Templin JL (2005) Fusion model “fit” indices. Unpublished ETS Project Report, Princeton, NJ
Holland PW, Wainer H (eds) (1993) Differential item functioning. Routledge, Hillsdale
Huynh H, Meyer JP, Gallant DJ (2004) Comparability of student performance between regular and oral administrations for a high-stakes mathematics test. Appl Measur Educ 17(1):39–57. doi:10.1207/s15324818ame1701_3
Johnstone CJ, Altman J, Thurlow ML, Thompson SJ (2006) A summary of research on the effects of test accommodations: 2002 through 2004 (Technical Report 45). Minneapolis, MN: University of Minnesota, National Center on Educational Outcomes. http://education.umn.edu/NCEO/OnlinePubs/Tech45/. Accessed 1 Mar 2015
Ketterlin-Geller LR, Alonzo J, Braun-Monegan J, Tindal G (2007a) Recommendations for accommodations: implications of (in)consistency. Remedial Spec Educ 28(4):194–206
Ketterlin-Geller LR, Yovanoff P, Tindal G (2007b) Developing a new paradigm for conducting research on accommodations in mathematics testing. Except Child 73(3):331–347
Kloosterman P (2004) Interpreting the 2000 NAEP Mathematics data: issues and monograph overview. In: Kloosterman P, Lester F, Jr. (eds) Results and interpretations of the 1990–2000 mathematics assessments of the National Assessment of Educational Progress. National Council of Teachers of Mathematics, Reston, pp 3–32
Leighton J, Gierl MJ (eds) (2007) Cognitive diagnostic assessment for education: Theory and applications. Cambridge University Press, New York
Li H (2011) A cognitive diagnostic analysis of the MELAB reading test. Spaan Fellow 9:17–46
Li H (2014) The effects of read aloud accommodations for students with and without disabilities: a meta-analysis. Educ Meas Issues Pract 33(3):3–16
Lord FM (1980) Applications of item response theory to practical testing problems. Lawrence Erlbaum Associates Inc, Hillsdale
Magis D, Raîche G, Béland S, Gérard P (2011) A generalized logistic regression procedure to detect differential item functioning among multiple groups. Int J Test 11(4):365–386
Magis D, Béland S, Raîche G (2013) difR: Collection of methods to detect dichotomous differential item functioning (DIF) in psychometrics. R package version 4.4
Mellenbergh GJ (1982) Contingency table models for assessing item bias. J Educ Behav Stat 7(2):105–118. doi:10.3102/10769986007002105
Meredith W (1993) Measurement invariance, factor analysis and factorial invariance. Psychometrika 58(4):525–543. doi:10.1007/BF02294825
Middleton K, Laitusis CC (2007) Examining test items for differential distractor functioning among students with learning disabilities. Research Report. ETS RR–07–43. Educational Testing Service, Princeton
Milewski GB, Baron PA (2002) Extending DIF methods to inform aggregate report on cognitive skills. In: Paper presented at the annual meeting of the National Council of Measurement in Education, New Orleans, Louisiana
NAEP. (n.d.). NAEP_Inclusion of Special–Needs Students. http://nces.ed.gov/nationsreportcard/about/inclusion.asp. Accessed 1 Mar 2015
No Child Left Behind Act of 2001, Pub. L. No. 107–110, 115 Stat. 1425. (2002)
Randall J, Engelhard G (2010) Using confirmatory factor analysis and the Rasch model to assess measurement invariance in a high stakes reading assessment. Appl Meas Educ 23(3):286–306. doi:10.1080/08957347.2010.486289
Randall J, Cheong YF, Engelhard G (2011) Using explanatory item response theory modeling to investigate context effects of differential item functioning for students with disabilities. Educ Psychol Measur 71(1):129–147
R Core Development Team (2015) R: A language and environment for statistical computing (Version 3.2.1) [Computer software]. R Foundation for Statistical Computing, Vienna, Austria. https://www.R-project.org/
Roussos LA, DiBello LV, Stout W, Hartz SM, Henson RA, Templin JL (2007) The fusion model skills diagnosis system. In: Leighton JP, Gierl MJ (eds) Cognitive diagnostic assessment for education: theory and applications. Cambridge University Press, New York, pp 275–318
Rupp AA, Templin J (2008) Unique characteristics of diagnostic classification models: a comprehensive review of the current state-of-the-art. Meas Interdiscip Res Perspect 6:219–262
Rupp AA, Templin J, Henson RA (2010) Diagnostic measurement: theory, methods, and applications. Guilford, New York
Scarpati SE, Wells CS, Lewis C, Jirka S (2011) Accommodations and item-level analyses using mixture differential item functioning models. J Spec Educ 45(1):54–62. doi:10.1177/0022466909350224
Steinberg J, Cline F, Sawaki Y (2011) Examining the factor structure of a state standardsbased science assessment for students with learning disabilities Research Report. ETS RR–11–38. Educational Testing Service, Princeton
Stone E, Cook L, Laitusis CC, Cline F (2010) Using differential item functioning to investigate the impact of testing accommodations on an English—language arts assessment for students who are blind or visually impaired. Appl Meas Educ 23(2):132–152. doi:10.1080/08957341003673773
Svetina D, Levy R (2014) A framework for dimensionality assessment for multidimensional item response models. Educ Assess 19(1):35–57
Svetina D, Wang X (2014) Examination of different methods to test for invariance in accommodations when mixture data formats exist: Illustration of the NAEP. In: Paper presented at the annual meeting of American Educational Research Association, Philadelphia, PA
Swaminathan H, Rogers HJ (1990) Detecting differential item functioning using logistic regression procedures. J Educ Meas 27:361–370
Tatsuoka KK, Corter JE, Tatsuoka C (2004) Patterns of diagnosed mathematical content and process skills in TIMSS–R across a sample of 20 countries. Am Educ Res J 41(4):901–926
U.S. Department of Education (2007) Title I—Improving the academic achievement of the disadvantaged; Individuals with Disabilities Education Act (IDEA): Final rule [34 CFR Parts 200 and 300]. Federal Register, 72(67). http://ed.gov/legislation/FedRegister/finrule/2007–2/040907a.pdf. Accessed 1 Mar 2015
Xu X, von Davier M (2006) Applying the general diagnostic model to data from large scale educational surveys (ETS Research Rep. No. RR–06–08). ETS, Princeton
Zenisky AL, Sireci SG (2007) A summary of the research on the effects of test accommodations: 2005–2006 (Technical Report 47). University of Minnesota, National Center on Educational Outcomes, Minneapolis
Zenisky A, Hambleton R, Robin F (2004) DIF detection and interpretation in large-scale science assessments: informing item writing practices. Educ Assess 9:61–78
Author information
Authors and Affiliations
Corresponding author
Ethics declarations
Conflict of interest
The authors declare that they have no conflict of interest.
Additional information
Communicated by Russell George Almond.
Appendices
Appendix 1: RUM model fit summary
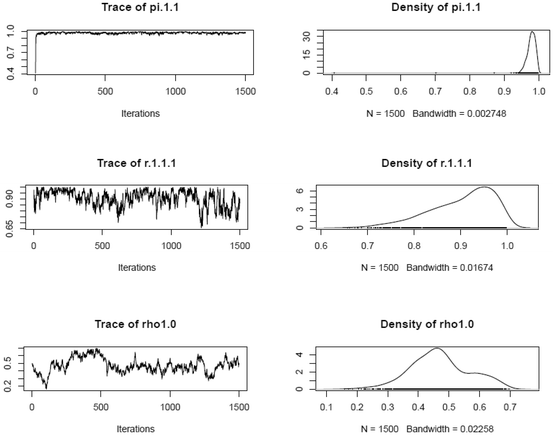
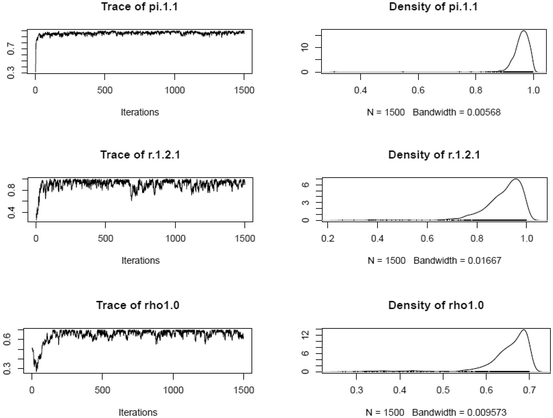
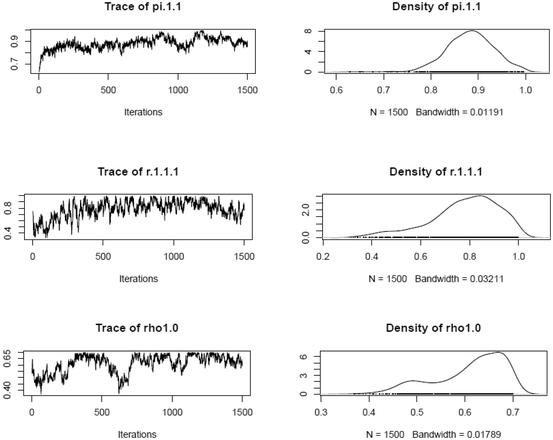
All RUM analyses were run using Markov chain Monte Carlo procedures via Arpeggio software. For each analysis, one chain of 13,000 iterations was run, after the burn-in phase of 17,000 iterations. The considered iterations were thinned by 20 and the remaining iterations were pooled to yield 1500 draws from the posterior distribution for use of model fit. Following Hartz and Roussos (2008), Henson et al. (2005), and Roussos et al. (2007), fusion model fit was examined in three ways, by: (1) visual evaluation of thinned chain plots, estimated posterior distributions, and autocorrelations of the chain estimates; (2) checking item mastery statistics; and (3) comparing observed scores with fusion model predicted scores at both item and examinee levels. Results of the aforementioned procedures showed that analyses of all four booklets have acceptable model fit. Selected plots are included below.
-
1.
Visual examination of selected posterior distribution parameter estimates (after thinning) across booklets
-
2.
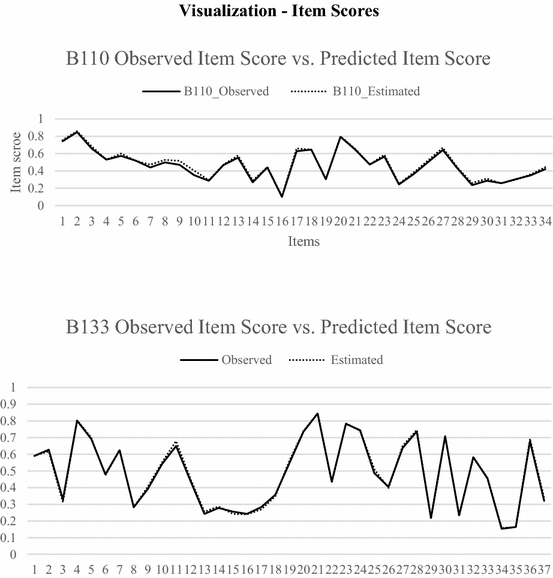
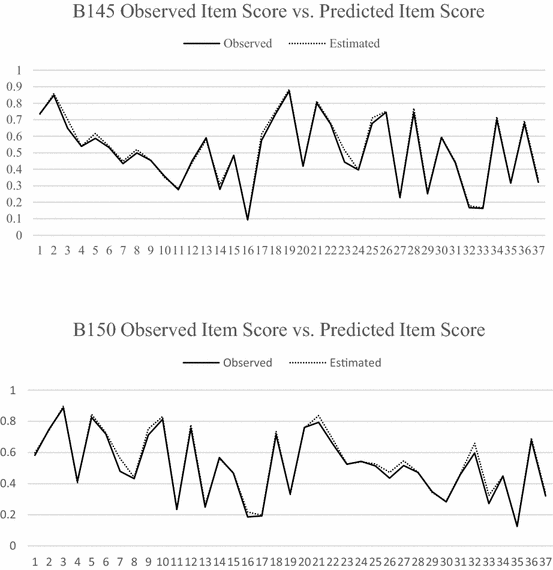
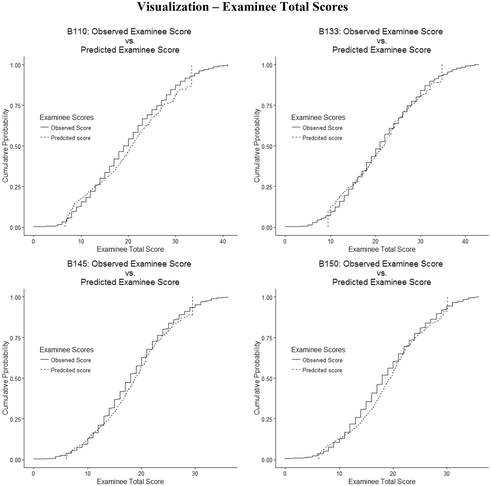
Bias and RMSEs between observed scores and model-estimated scores for both items and examinees


Summary statistics
Booklet | Bias | RMSE | Correlation | |
|---|---|---|---|---|
Summary of fusion model statistics | ||||
Examinee level | B110 | −0.5857 | 2.4847 | 0.9607 |
B133 | −0.1128 | 2.3851 | 0.9597 | |
B145 | −0.4380 | 1.9907 | 0.9603 | |
B150 | −0.5885 | 2.0509 | 0.9622 | |
Item level | B110 | −0.0154 | 0.0209 | 0.9967 |
B133 | −0.0027 | 0.0108 | 0.9987 | |
B145 | −0.0118 | 0.0206 | 0.9967 | |
B150 | −0.0153 | 0.0256 | 0.9951 | |
-
3.
Observed and model implied scores for both persons and items (similarity between the lines in the plots below suggest adequate model fit).


Appendix 2
This table specifies which attributes are associated with each item, and the performance of the various groups across these attributes. Within each item, a more complete attribute mastery for the groups can be seen
Content-based attributes | Process-based attributes | Item-type attributes |
|---|---|---|
C1 Whole numbers and integers C2 Fractions and decimals C3 Elementary algebra C4 Two-dimensional geometry C5 Data and basic statistics C6 Measuring and estimating | P1 Translate/formulate equations P2 Computation application P3 Judgmental application P4 Rule application in algebra P5 Logical reasoning P6 Solution search P7 Visual figures and graphs P9 Data management P10 Quantitative reading | S1 Unit conversion S2 Number sense S3 Figures, tables, and graphs S4 Approximation and estimation S5 Evaluate/verify options S6 Pattern recognition S7 Proportional reasoning S10 Open-ended items S11 Word problems |
Item level skill mastery attribute probability means
Item ID | Group | C1 | C2 | C3 | C4 | C5 | C6 | P1 | P2 | P3 | P4 | P5 | P6 |
|---|---|---|---|---|---|---|---|---|---|---|---|---|---|
M143601 | NonA | 0.77 | 0.43 | 0.73 | 0.65 | ||||||||
A_ET | 0.47 | 0.21 | 0.43 | 0.38 | |||||||||
A_RA | 0.43 | 0.12 | 0.42 | 0.35 | |||||||||
A_SG | 0.46 | 0.18 | 0.47 | 0.39 | |||||||||
M091701 | NonA | 0.43 | 0.73 | ||||||||||
A_ET | 0.21 | 0.43 | |||||||||||
A_RA | 0.12 | 0.42 | |||||||||||
A_SG | 0.18 | 0.47 | |||||||||||
M144901 | NonA | 0.77 | 0.43 | 0.42 | 0.54 | 0.45 | |||||||
A_ET | 0.47 | 0.21 | 0.22 | 0.31 | 0.34 | ||||||||
A_RA | 0.43 | 0.12 | 0.23 | 0.27 | 0.32 | ||||||||
A_SG | 0.46 | 0.18 | 0.24 | 0.30 | 0.30 | ||||||||
M107101 | NonA | 0.43 | 0.69 | 0.73 | 0.65 | ||||||||
A_ET | 0.21 | 0.38 | 0.43 | 0.38 | |||||||||
A_RA | 0.12 | 0.39 | 0.42 | 0.35 | |||||||||
A_SG | 0.18 | 0.43 | 0.47 | 0.39 | |||||||||
M106601 | NonA | 0.77 | 0.73 | ||||||||||
A_ET | 0.47 | 0.43 | |||||||||||
A_RA | 0.43 | 0.42 | |||||||||||
A_SG | 0.46 | 0.47 | |||||||||||
M106401 | NonA | 0.42 | |||||||||||
A_ET | 0.22 | ||||||||||||
A_RA | 0.23 | ||||||||||||
A_SG | 0.24 | ||||||||||||
M106801 | NonA | 0.77 | 0.42 | 0.73 | |||||||||
A_ET | 0.47 | 0.22 | 0.43 | ||||||||||
A_RA | 0.43 | 0.23 | 0.42 | ||||||||||
A_SG | 0.46 | 0.24 | 0.47 | ||||||||||
M144501 | NonA | 0.77 | 0.74 | 0.73 | |||||||||
A_ET | 0.47 | 0.51 | 0.43 | ||||||||||
A_RA | 0.43 | 0.47 | 0.42 | ||||||||||
A_SG | 0.46 | 0.53 | 0.47 | ||||||||||
M107601 | NonA | 0.47 | 0.73 | ||||||||||
A_ET | 0.26 | 0.43 | |||||||||||
A_RA | 0.23 | 0.42 | |||||||||||
A_SG | 0.25 | 0.47 | |||||||||||
M072901 | NonA | 0.74 | 0.45 | ||||||||||
A_ET | 0.51 | 0.34 | |||||||||||
A_RA | 0.47 | 0.32 | |||||||||||
A_SG | 0.53 | 0.30 | |||||||||||
M107201 | NonA | 0.43 | 0.45 | 0.62 | |||||||||
A_ET | 0.21 | 0.34 | 0.43 | ||||||||||
A_RA | 0.12 | 0.32 | 0.41 | ||||||||||
A_SG | 0.18 | 0.30 | 0.46 | ||||||||||
M144401 | NonA | 0.77 | 0.43 | 0.69 | 0.73 | 0.65 | |||||||
A_ET | 0.47 | 0.21 | 0.38 | 0.43 | 0.38 | ||||||||
A_RA | 0.43 | 0.12 | 0.39 | 0.42 | 0.35 | ||||||||
A_SG | 0.46 | 0.18 | 0.43 | 0.47 | 0.39 | ||||||||
M105801 | NonA | 0.42 | |||||||||||
A_ET | 0.22 | ||||||||||||
A_RA | 0.23 | ||||||||||||
A_SG | 0.24 | ||||||||||||
M106701 | NonA | 0.43 | 0.42 | 0.65 | |||||||||
A_ET | 0.21 | 0.22 | 0.38 | ||||||||||
A_RA | 0.12 | 0.23 | 0.35 | ||||||||||
A_SG | 0.18 | 0.24 | 0.39 | ||||||||||
M145001 | NonA | 0.77 | 0.43 | 0.69 | 0.54 | ||||||||
A_ET | 0.47 | 0.21 | 0.38 | 0.31 | |||||||||
A_RA | 0.43 | 0.12 | 0.39 | 0.27 | |||||||||
A_SG | 0.46 | 0.18 | 0.43 | 0.30 | |||||||||
M013131 | NonA | 0.65 | |||||||||||
A_ET | 0.43 | ||||||||||||
A_RA | 0.37 | ||||||||||||
A_SG | 0.45 | ||||||||||||
M145101 | NonA | 0.47 | 0.43 | 0.42 | 0.73 | 0.65 | |||||||
A_ET | 0.26 | 0.21 | 0.22 | 0.43 | 0.38 | ||||||||
A_RA | 0.23 | 0.12 | 0.23 | 0.42 | 0.35 | ||||||||
A_SG | 0.25 | 0.18 | 0.24 | 0.47 | 0.39 | ||||||||
M075801 | NonA | 0.77 | 0.42 | 0.73 | |||||||||
A_ET | 0.47 | 0.22 | 0.43 | ||||||||||
A_RA | 0.43 | 0.23 | 0.42 | ||||||||||
A_SG | 0.46 | 0.24 | 0.47 | ||||||||||
M106301 | NonA | 0.47 | |||||||||||
A_ET | 0.26 | ||||||||||||
A_RA | 0.23 | ||||||||||||
A_SG | 0.25 | ||||||||||||
M144001 | NonA | 0.77 | 0.45 | ||||||||||
A_ET | 0.47 | 0.34 | |||||||||||
A_RA | 0.43 | 0.32 | |||||||||||
A_SG | 0.46 | 0.30 | |||||||||||
M144201 | NonA | 0.47 | 0.73 | 0.54 | |||||||||
A_ET | 0.26 | 0.43 | 0.31 | ||||||||||
A_RA | 0.23 | 0.42 | 0.27 | ||||||||||
A_SG | 0.25 | 0.47 | 0.30 | ||||||||||
M013531 | NonA | 0.47 | |||||||||||
A_ET | 0.26 | ||||||||||||
A_RA | 0.23 | ||||||||||||
A_SG | 0.25 | ||||||||||||
M105601 | NonA | 0.77 | |||||||||||
A_ET | 0.47 | ||||||||||||
A_RA | 0.43 | ||||||||||||
A_SG | 0.46 | ||||||||||||
M105901 | NonA | 0.47 | |||||||||||
A_ET | 0.26 | ||||||||||||
A_RA | 0.23 | ||||||||||||
A_SG | 0.25 | ||||||||||||
M144301 | NonA | 0.47 | 0.43 | 0.69 | 0.73 | 0.65 | |||||||
A_ET | 0.26 | 0.21 | 0.38 | 0.43 | 0.38 | ||||||||
A_RA | 0.23 | 0.12 | 0.39 | 0.42 | 0.35 | ||||||||
A_SG | 0.25 | 0.18 | 0.43 | 0.47 | 0.39 |
Item ID | Group | P7 | P9 | P10 | S1 | S2 | S3 | S4 | S5 | S6 | S7 | S10 | S11 |
|---|---|---|---|---|---|---|---|---|---|---|---|---|---|
M143601 | NonA | ||||||||||||
A_ET | |||||||||||||
A_RA | |||||||||||||
A_SG | |||||||||||||
M091701 | NonA | ||||||||||||
A_ET | |||||||||||||
A_RA | |||||||||||||
A_SG | |||||||||||||
M144901 | NonA | 0.66 | 0.58 | 0.73 | 0.80 | ||||||||
A_ET | 0.42 | 0.29 | 0.51 | 0.54 | |||||||||
A_RA | 0.41 | 0.27 | 0.50 | 0.54 | |||||||||
A_SG | 0.43 | 0.32 | 0.51 | 0.54 | |||||||||
M107101 | NonA | ||||||||||||
A_ET | |||||||||||||
A_RA | |||||||||||||
A_SG | |||||||||||||
M106601 | NonA | 0.58 | |||||||||||
A_ET | 0.29 | ||||||||||||
A_RA | 0.27 | ||||||||||||
A_SG | 0.32 | ||||||||||||
M106401 | NonA | 0.64 | 0.58 | ||||||||||
A_ET | 0.38 | 0.29 | |||||||||||
A_RA | 0.36 | 0.27 | |||||||||||
A_SG | 0.38 | 0.32 | |||||||||||
M106801 | NonA | 0.78 | |||||||||||
A_ET | 0.52 | ||||||||||||
A_RA | 0.50 | ||||||||||||
A_SG | 0.56 | ||||||||||||
M144501 | NonA | 0.53 | 0.77 | ||||||||||
A_ET | 0.43 | 0.59 | |||||||||||
A_RA | 0.44 | 0.59 | |||||||||||
A_SG | 0.38 | 0.59 | |||||||||||
M107601 | NonA | 0.67 | |||||||||||
A_ET | 0.39 | ||||||||||||
A_RA | 0.37 | ||||||||||||
A_SG | 0.44 | ||||||||||||
M072901 | NonA | 0.58 | 0.58 | 0.78 | 0.77 | ||||||||
A_ET | 0.29 | 0.33 | 0.52 | 0.52 | |||||||||
A_RA | 0.27 | 0.29 | 0.50 | 0.51 | |||||||||
A_SG | 0.32 | 0.32 | 0.56 | 0.56 | |||||||||
M107201 | NonA | 0.77 | |||||||||||
A_ET | 0.52 | ||||||||||||
A_RA | 0.51 | ||||||||||||
A_SG | 0.56 | ||||||||||||
M144401 | NonA | 0.53 | 0.64 | 0.77 | |||||||||
A_ET | 0.43 | 0.38 | 0.52 | ||||||||||
A_RA | 0.44 | 0.36 | 0.51 | ||||||||||
A_SG | 0.38 | 0.38 | 0.56 | ||||||||||
M105801 | NonA | 0.58 | |||||||||||
A_ET | 0.29 | ||||||||||||
A_RA | 0.27 | ||||||||||||
A_SG | 0.32 | ||||||||||||
M106701 | NonA | 0.58 | |||||||||||
A_ET | 0.29 | ||||||||||||
A_RA | 0.27 | ||||||||||||
A_SG | 0.32 | ||||||||||||
M145001 | NonA | 0.58 | |||||||||||
A_ET | 0.29 | ||||||||||||
A_RA | 0.27 | ||||||||||||
A_SG | 0.32 | ||||||||||||
M013131 | NonA | 0.67 | |||||||||||
A_ET | 0.39 | ||||||||||||
A_RA | 0.37 | ||||||||||||
A_SG | 0.44 | ||||||||||||
M145101 | NonA | 0.58 | 0.80 | ||||||||||
A_ET | 0.29 | 0.54 | |||||||||||
A_RA | 0.27 | 0.54 | |||||||||||
A_SG | 0.32 | 0.54 | |||||||||||
M075801 | NonA | 0.78 | 0.80 | 0.77 | |||||||||
A_ET | 0.52 | 0.54 | 0.52 | ||||||||||
A_RA | 0.50 | 0.54 | 0.51 | ||||||||||
A_SG | 0.56 | 0.54 | 0.56 | ||||||||||
M106301 | NonA | 0.73 | 0.64 | 0.58 | 0.67 | 0.80 | 0.77 | ||||||
A_ET | 0.49 | 0.38 | 0.29 | 0.39 | 0.54 | 0.52 | |||||||
A_RA | 0.46 | 0.36 | 0.27 | 0.37 | 0.54 | 0.51 | |||||||
A_SG | 0.49 | 0.38 | 0.32 | 0.44 | 0.54 | 0.56 | |||||||
M144001 | NonA | 0.53 | 0.64 | 0.58 | 0.78 | ||||||||
A_ET | 0.43 | 0.38 | 0.29 | 0.52 | |||||||||
A_RA | 0.44 | 0.36 | 0.27 | 0.50 | |||||||||
A_SG | 0.38 | 0.38 | 0.32 | 0.56 | |||||||||
M144201 | NonA | 0.64 | 0.80 | ||||||||||
A_ET | 0.38 | 0.54 | |||||||||||
A_RA | 0.36 | 0.54 | |||||||||||
A_SG | 0.38 | 0.54 | |||||||||||
M013531 | NonA | 0.64 | 0.58 | ||||||||||
A_ET | 0.38 | 0.29 | |||||||||||
A_RA | 0.36 | 0.27 | |||||||||||
A_SG | 0.38 | 0.32 | |||||||||||
M105601 | NonA | 0.58 | 0.78 | ||||||||||
A_ET | 0.33 | 0.52 | |||||||||||
A_RA | 0.29 | 0.50 | |||||||||||
A_SG | 0.32 | 0.56 | |||||||||||
M105901 | NonA | 0.58 | 0.67 | ||||||||||
A_ET | 0.29 | 0.39 | |||||||||||
A_RA | 0.27 | 0.37 | |||||||||||
A_SG | 0.32 | 0.44 | |||||||||||
M144301 | NonA | 0.66 | 0.53 | 0.64 | 0.77 | ||||||||
A_ET | 0.42 | 0.43 | 0.38 | 0.52 | |||||||||
A_RA | 0.41 | 0.44 | 0.36 | 0.51 | |||||||||
A_SG | 0.43 | 0.38 | 0.38 | 0.56 |
About this article

Cite this article
Svetina, D., Dai, S. & Wang, X. Use of cognitive diagnostic model to study differential item functioning in accommodations. Behaviormetrika 44, 313–349 (2017). https://doi.org/10.1007/s41237-017-0021-0
Received:
Accepted:
Published:
Issue Date:
DOI: https://doi.org/10.1007/s41237-017-0021-0