
Abstract
The Big Data challenge has made the issue of “making sense” of data urgent and unavoidable. This paper introduces exploratory computing (EC), a novel paradigm whose aim is to support a comprehensive “exploratory” experience for the user. “Exploratory” because it supports search and discovery of information through various tasks (investigation, knowledge seeking, serendipitous discovery, comparison of information...) in a dynamic interaction, where meaningful feedbacks from the system play a crucial role, closely resembling a human-to-human dialogue. “Computing” because a complex interaction as the one outlined above requires powerful computational strength for the user to be able to fully profit from, and even enjoy, the interaction. EC is not associated with a predefined set of techniques: Rather, it is an approach that can be concretized in different ways. In the paper, two different implementations of the EC approach are presented, both of which interpret the EC high-level requirements. It is the authors’ hope that others will follow.
1 Introduction
Data are available nowadays like never before, creating a treasure of information in wait for the right time to be put into service. For this reason, the exploration of big (and possibly rich Footnote 1) datasets has received much attention lately, in almost all domains of knowledge. This paper is about a comprehensive approach for making sense of data: Exploratory Computing, EC in what follows [1,2,3]. The EC approach has at its core the idea that non-expert users (i.e., non-data analysts) can be empowered to perform complex queries within a set of items to understand a phenomenon, answer research questions, and support a decision-taking process etc.
Why “exploratory”? In the definition of Wikipedia, exploration is “the act of searching for the purpose of discovery of information or resources.” The closest analogy is with human-to-human dialogue. In a dialogue, interlocutors continuously query their respective “mental databases” in ways yet unparalleled by the most sophisticated information access systems. By interacting with each other, human beings can investigate, search inspiration, compare, look for specific data, learn, etc., switching easily from one mode to another.
Why “computing”? Because, in order to support an interaction where the user can pursue the above goals and switch from one to the other at her will and in short time, powerful computing capabilities are mandatory. Nobody would stay in a dialogue where minutes are required to get an answer.
In principle, EC can be applied to datasets of various sizes (from small to very large, to Big Data) and of various structural complexities (in terms of variety of attributes and interrelations among them).
Many effective ways for extracting knowledge are already (well) known and reported in the literature, among which querying, search, faceted search, data mining, data exploration and visualization are only few of them. With respect to these, the intent of EC is to offer a comprehensive approach, exploiting all the affordances that are already there—and possibly giving vent to new ones—to assist a user in a process that resembles the interaction between two human beings, in which questions are explorative, possibly imprecise, and answers may be a bit inaccurate but suggestive, conveying an idea that stimulates the interlocutor to further questions and so on.
From the Big Data perspective, the problems posed by the EC vision are diverse and challenging [3]. Indeed, in the database research community, most methods for extracting significant and synthetic knowledge from data are tailored to be used by professional data scientists, who, besides having knowledge of the domain of interest, should also be proficient mathematicians, statisticians and computer engineers at the same time in order to use them effectively. Moreover, normally the analyst concentrates on one analysis method at a time, for example adopting a certain data mining or statistical technique to solve a specific problem.
The aim of EC—that, from the database researcher’s viewpoint, becomes a genre of database exploration [4]—is instead to assist the so-called data enthusiasts [5]: inexperienced, non-computer-savvy users who need the support of a sophisticated system that guides them in the inspection. The result is a reconnaissance path where, at each step, the system presents the users with relevant and concise facts about the data in order for them to understand better and progress to the next exploration step.
The notion of relevance is of paramount importance, since the main system’s task is to call the user attention to relevant (or surprising) differences or similarities between the datasets encountered along the route. This naturally leads us to the need of two basic instruments: On the one hand, we want to extract “the gist” of the data in order to present the user with a synthetic vision of them, and on the other hand, we also need some kind of comparison between facets, for the user to be aware of their mutual differences, and thus get an idea of relevant facts. Moreover, both operations must be carried out in as little time as possible, since the user will not be happy to wait too much to progress from one exploration step to the next one.
The defining traits of EC can thus be defined as follows:
-
Focused on the intensional (in the logical sense) rather than on the extensional nature Footnote 2 of the sets and subsets being “explored.” Let us clarify with an example: a query about “hotels in Milan” to a search engine will provide the user with a list of hotels (extensional set); a question to a friend about “hotels in Milan” will probably give vent to intensional considerations like “most of them are quite expensive (reference to the whole set), but those around the central station are cheaper and still decent (reference to a subset dynamically created on the spot), just like those close to the University, but there you have more noise.” Another example of “intensionality” is the “comparison of different sets of objects”: most of the times, if a user wishes to understand the difference between objects (in a given dataset), what she is aiming at is not the set difference; but rather the “intensional” one, that is, the properties that distinguish one set from the other.
-
Dialogue-based. The linguist Emile Benveniste [6], who studied how bees communicate and compared their system of signs with human language, noticed that bees have no dialogue, in the sense that just one turn of the conversation is enacted: A bee passes a piece of information to another bee about where the food is located, and then the intercourse finishes. There is no reply of any sort. On the contrary, human beings dialogue, in the sense that they reply to what the interlocutor says, making reference to what she said and building on top of it. EC aims at supporting dialogic interactions where the user can build on top of the feedback provided by the system in the previous turn-taking without having to start every time from scratch. Moreover, and again like in a dialogue, the user must be allowed to make reference to previous turn-takings, not just the one immediately preceding the last.
-
Meaningful in terms of feedback. Again in the spirit of a dialogue, the system has to provide meaningful feedbacks, interpreting the user’s requests and proactively putting forth relevant information, likely to steer the conversation into unexpected directions.
The purpose of this paper is to set forth the exploratory computing Manifesto, clarifying its defining traits and requirements without putting limitations to the ways in which it can be interpreted. Already within this paper, two different research viewpoints will be presented: the first one more oriented to the exploration of rich, not necessarily big datasets, and the second one more concerned with the challenges posed by the exploration of very large databases. The authors are confident that more nuances of the exploratory paradigm may come up in the future from other research groups.
2 Rationale and possible scenarios
In this section, we first discuss the overall features of EC, outlining why they are relevant and in what sense they are novel. In the following sections, we briefly compare EC with other well-known approaches. Then, we describe specific developments (systems and applications) implementing the EC approach. In the final section, we draw the conclusions and describe possible directions for future research.
Let us now try to define what is the vision of EC in general terms (warning the reader that probably the definition will be better understood after reading the following sections, where specific systems and applications are described). First of all, it must be clarified that there is no specific technique associated to EC, but several existing techniques can be used and novel techniques can be developed. In fact, EC is more about a vision than a specific technique and is characterized along 4 dimensions: (1) the user point of view (at the beginning and during an exploratory session), (2) the user experience (during the exploration), (3) the possible outcomes (of an exploratory session) and (4) the emphasis upon the “relevance” of data. Let us now go through each of them.
The user point of view EC cares for users with very generic goals or goals that are not easily translatable in terms of specific actions over a dataset. It must be clarified that by “generic goal” we do not mean “no goal,” since we believe that in all possible real-life situations a goal always exists, even if very generic like “understanding a situation (=dataset).” Let us assume, for example, that there is a dataset about museum exhibits, a set of ancient musical instruments. A potential user of the dataset may have very different starting points, backgrounds, attitudes and goals: For example, she may not know the specific domain well; or, alternatively, she may know (to some extent) the domain, but not that specific dataset; she may want to understand how objects are distributed across various facets (period of time in which they were manufactured, materials used for their various components, type of instruments, style of manufacturing, types of decoration,...); she may want to understand how the facets influence each other (“were instruments of the same material built in the same time period?”); she may want to understand how restorations were performed; she might try to identify the most interesting objects (in view of a possible visit to the museum); she might be trying to understand if a visit is worth a trip; etc.
In addition, it is very realistic to imagine that all the above are not just possible starting points for the user but also (and more important) possible steps within an on-going conversation between the user and the system that, just like in a human-to-human interaction, leads to changes of opinions, ideas, interests and goals. In other words, the situation can evolve during the exploration itself. A user may start with some point of view and end up with different ones. Somehow the essence of an exploratory session is discovery: Users change point of view along the way. Some of the above situations can be dealt with by means of other existing approaches (briefly examined in the next section); dealing with all of them is the goal of EC, and this is not possible with existing approaches.
The user experience (during an exploratory session) The user experience during an exploratory session can combine (in a highly interactive stream) several aspects: investigating properties of the initial dataset; creating subsets and investigating their properties; verifying how facets (attributes) affect other facets (attributes) in the initial dataset or in dynamically created subsets; visualizing properties of datasets; comparing properties of various subsets; identifying interesting phenomena in the initial dataset or subsets; saving/retrieving subsets; comparing properties of subsets, etc. To our knowledge, no system currently bundles all of the features of a user experience above described. EC, instead, aims at providing all (or at least most) of the above features together, in order to empower users with the possibility of continuously changing point of view, as her understanding of the dataset evolves.
The outcomes (of an exploratory session) An exploratory session may have various outcomes and it is nearly impossible to list all of them. Some obvious results could be identifying interesting objects (similar to results obtained via queries or search or faceted search or exploratory approaches). Other results could be understanding the overall properties of the initial dataset (similar to data mining results). Less obvious results could be identifying interesting subsets, by combining facets (attributes) that could not be anticipated at the beginning but were interactively discovered along the session. Even less obvious could be understanding interrelationships (beyond statistical analysis) among facets (attributes) in specific subsets. An example could be that while “style” and “material” have little correlation in general, “ebony” is often used for “keyboard” instruments built between the XVII and XVIII centuries, but not in previous centuries. Even less obvious results could be a better understanding of the domain and of that specific dataset: for example, understanding how “style,” “material” and “restoration technique” are interrelated. Another non-obvious result could be the discovery of niche properties (i.e., properties that make sense only in small subsets), etc.
The relevance of data By “relevance” of data we mean the meaning that users associate with them. Meaning is a subjective point of view, since it is related to how a specific item can be associated, in the user’s perception, with a set of other notions. Assume that an object is made of <gold>, <ebony> and <brass>. The question about the relevance of these materials brings to a deeper (than usual) interpretation of data. Relevance can be interpreted in various ways; one obvious interpretation could be about quantity, in percentage. Saying that the object is made 50% of brass, 40% of ebony and 10% of gold, may seem to provide an obvious answer. But we can interpret the relevance in a different way: It may be possible, in fact, that the brass component is of average quality, while the ebony component is of good quality and the gold component is of extraordinary quality. The relevance in quantity does not match the relevance in quality! So, if a user is exploring the <material> aspect (or facet, or attribute), should the system emphasize quantity or quality? Or other aspects of relevance?
Note that the notion of relevance is strictly related to that of “intensionality,” introduced before, since relevance involves the meaning of data (intension) and not just their “extension.” One of the aims of EC is to put at the center stage of a session the relevance of data.
In the next sections, we exemplify some of the consequences of an EC approach, describing systems and applications that show where EC can lead to, and, as we have done with the “EC manifesto” [1], try to stimulate readers to take on and build their tools and applications that exhibit the features of EC.
Possible envisaged scenarios used throughout the examples, where people have to make sense of information sets, are the following:
-
1.
Exploration of a dataset gathering hundreds of educational experiences, each one described via a set of documents (content) and “profiled” according to a set of facets (e.g., subject-matter, technology used, benefits, organization,...), meant to help users to decide how to foster the introduction of technology at school.
-
2.
Exploring historical medical data about thyroid diseases, trying to extract (possibly unexpected) results.
-
3.
Civil Protection interacts with a dataset about natural disasters in Italy to gain information about floods.
3 State of the art
Since the early practical uses of computers, data have been at the center stage. Two main issues are relevant: how to organize them and how to use them. Since the 1970s, “querying” became known as a paradigm where “the user knows what she is looking for, and asks for it.” Recently, however, the need for a new search paradigm for the exploration of large datasets has been recognized and faced from different perspectives [4]. Differently from the past, nowadays more dynamic data-driven applications are built that do not always have the same requirements as traditional database systems. On the contrary, they are usually discovery-oriented applications whose users have only a vague idea, if any, of what they are looking for. The EC vision [1, 2] borrows intuitions from many research areas, the most prominent of which are tackled below.
Search: you get what you are looking for Search is good at identifying subsets of potentially interesting objects but not good at making sense of datasets or at finding clusters of interesting subsets. EC offers a more relaxed way of specifying what the user is looking for and a much higher “recall” (the percentage of relevant objects retrieved). On the contrary, there is a loss of “precision” (the percentage of relevant objects vs. all retrieved objects) and the need of a “ranking” specifying which objects are more closely related to what the user is looking for. In fact, while search is mainly focused on exhibiting objects, EC is more prone to denote objects by means of their properties, i.e., intension [7, 8]. There are many different research areas that deal with developing and using methods and techniques to extract and maintain intensional information from data.
A key notion in the field of information retrieval but also in information science in general is that of relevance [9] whose definition has stimulated widely dissonant ideas and works. As introduced in Sect. 2, this is a center-stage notion also in the EC approach and its definition might vary depending on the point of view.
Data mining: data speak out Users understand data since they are analyzed in various statistical ways (distribution, outliers, clusters, regression,...) and algorithms and techniques have been widely studied to support the discovery of properties from data. There are several techniques in the field of data mining [10, 11], such as association rule mining, clustering, classification and so on whose aim is to find significant regularities, correlations or groupings in large amounts of data. This information provides implicit (intensional and approximate) knowledge about the initial data. A “preprocessing” is needed (to run the algorithms) so that the initial dataset cannot be modified. Data mining is good at identifying potential relationships across data but has two major problems (with respect to the EC requirements): The dataset cannot be broken down into subsets and the set of available relationships is somehow predefined, and not dynamically discovered via user interaction. In fact, the research in data mining is mostly concerned with finding the best algorithms used to extract knowledge and does not put much emphasis on the way such information should be made available to final users.
Still, there are many interesting approaches from this field of research that can be appropriately adapted to be used in EC. In [12, 13] the authors propose to extract approximate knowledge using data mining techniques, with the aim of storing association rules [14] as a synthetic (yet approximate) description of the data to be returned as intensional answers. These summarization techniques are proposed for relational or XML data and address also the objective of performance, achieved by querying instance patterns instead of using classical indexing techniques. However, these approaches provide very little interaction with users, that is, no incremental exploration is possible. Works in [15, 16] introduce the use of subspace analysis and interactive machine learning to help understand complex and high-dimensional medical data by also leveraging domain expert competences. However, an expert-in-the-loop approach might not always be feasible; moreover, this approach tends to use a single or limited number of algorithms as opposed to EC where many different techniques might be exploited during the data exploration process.
Another interesting data mining technique is subgroup discovery [17] that considers a set of items characterized by some properties, one of which being the target one. The aim is to identify the subgroups of the population that have the most unusual features with respect to the target property, and their descriptions, in most cases expressed through rules.
Data mining, machine learning and other summarization techniques have also been applied in the field of database summarization [18]. The aim of this area of research is to summarize the content and schema of a database by producing a reduced version of it that might describe the data at different levels of granularity. Different techniques have been adopted to summarize both tables and views, among them random walks, hierarchical clustering, probabilistic summarization and fuzzy approaches. The summarized database is query-independent, and thus, a single employment of these techniques is not enough to support an entire exploration process; however, they can be used during each step to summarize the results of a given query.
Probabilistic and fuzzy approaches are also used to represent approximate or uncertain information in probabilistic [19] and fuzzy [20] databases. These areas of research adopt probabilities and fuzzy-set approaches to model data that is uncertain and provide ways to query them. Differently from these approaches, the EC approach is based on certain data and focuses on providing a multitude of ways to explore them.
Faceted search (popular with many commercial applications and not very popular in the scientific field): navigate properties. The field of faceted search [21], or faceted navigation, also deals with the idea of exploration as a process. It proposes a strategy of accessing sets of information items based on a taxonomy. To support faceted search, items have to be classified according to a number of “facets.” Let us start with a definition: “Faceted search, also called faceted navigation or faceted browsing, is a technique for accessing information organized according to a faceted classification system, allowing users to explore a collection of information by applying multiple filters [...] A faceted classification system classifies each information element along multiple explicit dimensions, called facets [22], enabling the classifications to be accessed and ordered in multiple ways rather than in a single, pre-determined, taxonomic order”. Footnote 3 To be more precise, we can define faceted search as faceted navigation enhanced by the use of retrieval systems making use of keywords. It was put forth for querying documents [23], databases [24] and semantic data [25, 26], giving vent to the so-called semantic faceted search. Facets are attributes of objects; in typical applications, users visualize how many objects have certain facets’ values; navigation is achieved by continuously redefining the dataset restricting it to those objects that have a specific value for a facet. Visualizing the possible values for the various facets and the number of objects having that values has a number of advantages: It helps users to understand the application domain; it helps users to understand the distribution of objects across the various facets; it “suggests” choices and navigation moves and prompts an interactive exploration (impossible with data mining, for example). The limitation is that the “sense” that can be made is very limited (basically cardinalities of the various attributes), and correlations across facets’ values are difficult to assess.
Facets add a great deal of flexibility to the search process while reflecting, or even “teaching,” about a domain’s concepts and terms [27]. For example, a system based on faceted navigation within the domain of education could have as facets “pedagogical approaches” (with values like “constructivism,” “authentic learning,” etc.) or “inclusion issues” (with values like “learning disorders,” “sociocultural disadvantage,” etc.). The user can investigate the dataset by combining the values and while doing so she also implicitly “learns” about the domain. It is therefore clear that a faceted navigation system can support user sessions in which the user is encouraged to literally “explore” the dataset [28] instead of narrowing down almost immediately her search by means of keywords, running the risk, in so doing, of eliminating potentially interesting items that could have been found in a more step-by-step, explorative, process. Moreover, faceted search is apt to support investigations that are NOT aimed at finding one or some specific elements but rather at understanding, making sense, of a dataset (or subset), thanks to subsequent selection, or de-selection, of facets [29, 30].
For these reasons, faceted search has become “the” standard for the exploration of complex datasets [21, 23]. The outcomes of a faceted navigation session are basically two: (i) the set of items that satisfy the criteria; (ii) the set of facets’ values that can be combined with the query to produce a non-empty set of answers.
Recently there have been many proposals for semantic faceted search, including gFacet [31], Visor [32] and Sewelis [26]. Faceted search, however, has no foundational model, and it does not support rich data that are also Big, ignoring the performance issues that derive from their coupling.
Exploratory data analysis and Data Exploration: see by yourself Exploratory data analysis is a field of statistics and data analysis mainly concentrating on the way data are displayed and on how their significant aspects are detected [33]. It offers visualization clues about relevant features of the datasets where visualizations can range from simple histograms or multivar-charts, to 3D interactive trees to sophisticated multilinear principle component analysis. The clear advantage is that the properties of the dataset are “shown,” thus giving support to an immediate overall understanding of a dataset; however, the approach mainly focuses on visualization without giving much space to features such as supporting exploration as a process. Data Exploration [4], on the other hand, is about efficiently extracting knowledge from data, and its techniques range from data storage to user interaction. Mainly three lines of research are involved: (i) visualization tools for data exploration, (ii) novel optimizations for interactive exploration times and (iii) re-examination of the database architecture to match the features of the new exploration workloads. Thus, this approach is a databases’ perspective to the problem of exploring data with efficiency as its main focus.
Finally, in the context of relational data, the idea of extending database queries with recommendations has also been introduced [34] with the aim of suggesting to users tuples that are not in the results of their queries but might be of potential interest.
The EC vision borrows intuitions from all the introduced areas of research, in particular combining faceted search with data analysis, and especially data mining, in order to boost the explorative experience. Faceted search is in fact the perfect tool for creating sets of items the user is interested into checking “one by one,” so to speak, while data mining extracts approximate, intensional properties of the datasets, thus allowing a—more or less deep—understanding of the sets themselves, as it will be shown in the next paragraph.
4 A database perspective
At the same time of the development of the EC vision, the database community felt an ever-increasing need of tools and techniques to analyze large-scale databases.Footnote 4 Such large-scale collections of data (e.g., thousands of TBs) make the use of traditional analysis tools and techniques infeasible or not adequate, e.g., due to constraints on the response time, or to memory/technological limitations. The fundamental requirements listed in the previous sections drive the main challenges—obviously strictly related to one another—for database researchers:
-
(a)
Appropriate choice of summarization techniques that through a synthetic view of the data highlight their properties.
-
(b)
Fast summary computation.
-
(c)
Interesting user involvement techniques.
Let us reason on these three aspects on the example of the medical data about thyroid diseases. For instance, in the answer of the query Q1 “find all patients whose thyroid function tests are out of range,” the distribution of the age values could be different from that of the original dataset. This is a relevant fact, maybe allowing the investigator to spot some relationship between age and thyroid disorders. After this step, the user might ask another query, like Q2 “find all patients whose thyroid function tests are out of range and who are over 60 years old,” to see whether the patients of that age group exhibit any special characteristics.
(a) Appropriate choice of the summarization techniques The use of statistical summaries—like for instance distributions—to summarize the values of an attribute may emphasize relevant aspects at a glance, permitting to see the data at a higher level of abstraction (highlighting their properties) and to take one or more further actions. In fact, a distribution can describe a dataset in an approximate, intensional way, in that it exhibits the data properties instead of the data themselves. In this direction, one possible technique is computing the distributions of the attribute values in the tuple sets resulting from two different queries. This analysis has the main aim of helping users to gain knowledge about the datasets they are exploring, by comparison between the main features of two query results. In this case, the differences between the distributions of the same attribute in the two datasets may hint at the relevance of one attribute in the query result(s) as shown by the example of query Q1 above, where the relevant fact is that the age values are distributed differently from that of the original dataset.
Similar results can be also obtained by data mining techniques: One is the well-known subgroup discovery [17], whose aim is discovering interesting relationships between different properties (attributes) of a set with respect to a target variable.The patterns extracted are normally represented in the form of rules and called subgroups. Subgroup discovery is mainly concerned with categorical attributes, while the use of distributions, or of entropy, allows also for numerical attributes; moreover, the adoption of these two typical statistical techniques also allows for the use of traditional statistical hypothesis tests.
Also mining association rules are useful, as shown in detail in the next section. For instance, by mining association rules from the result of query Q2 the system might discover that (i) “\(80\%\) of the patients from Lombardia lived between the Second World War and the sixties in the area of Valtellina” and (ii) “\(70\%\) of patients from Southern Italy are from a seaside location”.
(b) Fast summary computation The fast statistical analysis of large-scale databases becomes essential to the development of a reasonable exploratory system. Of course, while the problem can be faced by pre-computing as many summaries as possible in case of a slowly-changing database, it becomes much more difficult when the database may receive frequent updates. In the first case at least a portion of the feature summaries can be pre-computed, and, in the same fashion as in inductive DBs [35], all the intensional descriptions can be stored together with the data, to be queried when needed. In the second case, the summaries must necessarily be computed on the fly, which entails unfaltering investigation of fast data-intensive computation techniques: one of the eternal challenges for DB researchers.
Quick computation of attribute summaries is a long-studied area for databases, since relational DBMSs build and maintain statistics on the data in order to estimate the selectivity of attribute values for query optimization. Such techniques, along with others, can be applied to our case. In general, many techniques have been proposed for fast, incremental histogram computation, typically based on sampling. For example [36] propose the development of a statistical algorithm to measure the difference between two tuple sets Q1 and Q2 with a common target feature, in order to compute the relative relevance. The method relies on an ensemble of hypothesis tests operating on randomly extracted subsets of the original tuple sets. The main intuition is that the hypothesis tests should be conducted incrementally, in order to increase scalability, while at the same time keeping the emergence of false positives under control.
Similarly quick, albeit less precise, is the computation of other measures, such as the entropy, which establishes the “level of variety” of a set of values. When a query result shows a different entropy of a certain attribute w.r.t. that of the same attribute in the initial dataset, it means that its value set has been altered, suggesting a line of further investigation, like for instance submitting query Q2 above.
(c) Interesting user involvement techniques The first, immediate thought that comes to mind when thinking about effective user interaction is related to intuitive visualization techniques. An exploratory system should support intuitive visualization of the query answer synthesis, which highlights the relevant properties of the answers to the current and past queries. Some efforts in this respect have been presented in the next sections; however, the quest for this kind of tools should never stop.
Another feature that is badly needed in database exploration is the capability to provide explanations [37] and causal dependencies, whose aim is basically to understand the reasons for query results. Imagine that the user wants to understand “why there is a huge difference between Valtellina and the rest of Lombardia”: By joining the original dataset with one containing data about the Italian regions an explanation system might discover that Valtellina is very poor of iodine. The user will thus learn that iodine is strictly related to thyroid disorders, and possibly ask for another explanation, to see why such disorders are also found in seaside locations [rule (ii) extracted from the result of Q2]. The explanation facility is thus another formidable support for a user who tries to grasp from the data more than a flat sequence of items.
4.1 The IQ4EC system
IQ4EC is a highly interactive system that is able to establish a dialog with its users, i.e., a step-by-step process where, at each step, users choose a portion of data to explore and the system provides:
-
1.
a synthetic view of the data (extracted by applying efficient data mining techniques);
-
2.
intensional query answering capabilities, i.e., the answer to a query is the synthetic knowledge rather than the extensional dataset;
When users connect to IQ4EC they access the available datasets that have been previously mined, thus the system is aware of both extensional data and intensional knowledge about them. Suppose the system exposes a dataset about natural disasters in Italy and Alice, a chief of Civil Protection, interacts with it to learn about floods (step 1). The system looks for an answer in the available intensional knowledge and, e.g., it tells Alice that: (i) “70% of floods are coastal floods” and (ii) “60% of fluvial floods are located in Central Italy”.
After this feedback, Alice wants to learn about Central Italy (step 2) and discovers that “23% of flash floods in Central Italy are caused by intense rainfall” thus she asks the system to retrieve information about flash floods (step 3). Suppose the system, after querying the intensional knowledge, realizes that the result is empty; then it performs the query over the extensional data and: (i) it shows the result set to Alice and (ii) it mines this result set on-line to extract intensional knowledge. This new intensional knowledge is stored to be ready to answer future requests on the data
At this point, Alice wants to know about the countermeasures adopted in flooding events (step 4). The system looks for an answer in the intensional knowledge and, e.g., finds that: (i) 50% of countermeasures are structural and, (ii) 65% of structural countermeasures consist in constructing dikes.
The process goes on by refinement: At each step, the system uses the intensional knowledge from the previous steps to answer user requests. When the system cannot answer a user request, it performs on-line mining of the extensional result and stores the mined knowledge to use it in future exploration steps too. Therefore, at step 1 and step 2 of Alice’s exploration experience, the system uses the same intensional knowledge, i.e., the one mined from the original dataset; instead, at step 3 the used intensional knowledge is the one mined during step 3. At any time Alice can decide to start another exploration experience from scratch. Two capabilities are triggered during each step of exploration:
-
1.
Intensional knowledge mining intensional knowledge is mined from the data in the form of association rules (ARs) which are stored into a relational database that acts as an intensional repository.
-
2.
Intensional knowledge querying the intensional repository is used to answer user requests: (i) users formulate queries as if addressed to the extensional data and the system rewrites them and executes them over the intensional repository; (ii) users formulate queries directly on the intensional repository.
Intensional knowledge mining Intensional knowledge is extracted from a generic portion of data (a relation from the initial dataset, the result of an arbitrary user-formulated query, etc.). Given the data and a support and confidence thresholds, IQ4EC runs the Apriori algorithm to extract frequent and significant ARs. For example, disaster="flood" \(\Rightarrow \) type="coastal flood" with confidence 0.7 represents that “70% of floods are coastal floods” and type="flash flood" and area="Central Italy" \(\Rightarrow \) cause="intense rainfall" with confidence 0.23 represents that “23% of flash floods in Central Italy are caused by intense rainfall.” All the mined rules are stored in a relational database with the following logical schema:
-
NODE (idNode, tab, attribute, val)
-
RULE (idRule, tab, supp, conf, nAnt, nCons)
-
ANTEC_CONSEQ (idNode, idRule, role)
-
TUPLE_COUNT (table, nTuples)
Each pair attribute-value is stored in the NODE relation by keeping trace of the table it comes from, and each rule is stored in the RULE relation where we also store its support, confidence and the number of nodes in the antecedent and in the consequent. The ANTEC_CONSEQ relation allows us to understand which nodes are present in each rule and their role (either ‘antecedent’ or ‘consequent’), while the TUPLE_COUNT relation stores the number of tuples in each relation.
Intensional knowledge querying IQ4EC allows users to query the intensional knowledge rather than the data. To this aim, queries formulated on the extensional dataset need to be rewritten to be applied to association rules; not all queries lend themselves to such transformation and the system supports (i) select-project SQL queries or (ii) WHAT ABOUT requests:
-
SELECT clause: the following terms are allowed: ‘*’, attribute names, COUNT aggregate operator. They, however, may not be mixed in a single SELECT clause; moreover, the DISTINCT clause and aggregates different than COUNT are not allowed.
-
FROM clause: It may contain one relation, no aliasing or nested queries are allowed.
-
WHERE clause: It may contain AND and OR operators. No other operators (e.g., NOT, IN), nor nested queries are allowed.
-
WHAT ABOUT query: allows users to directly query intensional knowledge. Its syntax is:
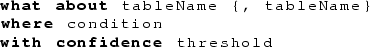
and IQ4EC returns every AR containing:
-
attributes from the tables in the WHAT ABOUT
-
the elements that satisfy the conditions
-
confidence more or equal than the threshold
-

Queries that do not respect these requirements cannot be rewritten; thus, each query is analyzed and:
-
1.
first, syntactic restructuring is performed where all unsupported clauses (such as GROUP BY, ORDER BY) and characters are deleted;
-
2.
second, a semantic inspection is carried out where the query is divided into the three allowed clauses and the content of each clause is further analyzed.
Once rewritten the query is applied to the intensional information to retrieve the ARs that satisfy the request.
Query rewriting The query rewriting is the core of IQ4EC. Suppose the user has formulated a query to retrieve all fluvial floods:

The intensional answer should contain the ARs, mined from the floods table, that provide some information about fluvial floods. We output all ARs that contain, in their antecedent, the constraint type=’fluvial flood’:

This rewriting is the building block for more complex constraints. Queries containing the and (or) operator are rewritten in an equivalent query where each constraint is expressed separately and their results are then combined using the intersect (union) operator. Instead, consider queries containing the COUNT aggregate:

To answer this query, we need to look for an AR that contains, in its antecedent, the same constraints expressed in the WHERE clause. If we have such a rule, then, differently from all the previous examples, we can answer this query without approximation. In fact, the support of the antecedent of an AR can be found by dividing the support of the rule by its confidence. The result, once multiplied by the cardinality of the relation, is the exact count of tuples satisfying the constraints imposed by the WHERE clause.

Note that, if we do not have a rule whose antecedent contains exactly the constraints specified in the WHERE clause, then we cannot answer the query. Finally, suppose the user directly queries the intensional repository using the novel WHAT ABOUT clause:

To answer this query, the system provides the user with all those rules that: (i) have attributes from the floods table; (ii) contain the constraint type=’flash flood’ (either in their antecedent or in their consequent) and (iii) have confidence equal or higher than 0.8.


The EDOC exploratory portal, on educational experiences with ICT at school. On the left the various facets; on the right the dataset
Given a query we can ensure that the answer to it, provided by means of intensional information, conveys the exact properties of the extensional data that validate its requests (the formal proof can be found in [12]).
5 EXPLORE: a tool for exploratory portals
This section presents another specific approach to EC: exploratory portals. A development tool has been built, in various versions: the current one is EXPLORE-5. EXPLORE allows the fast deployment of portals that can be used for exploring “rich” datasets, i.e., datasets where items display a significant number of facets, with complex relationships among them. Various EC-portals have been built and deployed, some of them just for the sake of research and others for real-life usage. The application domains have been cultural heritage (for various sub-domains) and education (in various versions). The main idea of EXPLORE is to combine Faceted Search, Data Mining and novel set-based techniques in order to allow highly interactive and effective exploratory sessions [38,39,40].
The EXPLORE technology was first developed in 2007 by HOC-LAB of Politecnico di Milano. The current version, EXPLORE-5, was implemented by the GSA-LAB of University of Salento. Figure 8 presents the software architecture of EXPLORE-5 that currently (May 2016) implements most of the features described in this section [40].
5.1 The functionalities
In order to describe how an exploratory portal works, let us consider an example from research in educational technology (Fig. 1). The dataset consists of a number of educational experiences based on technology, carried on by teachers at school. On the left, a representation of some intensional properties of the current set can be seen. Each facet (attribute) is displayed with the possible values (visible on demand); for each facet, various representations are possible: absolute value, percentage, distribution, word-cloud, etc. In addition, some small icons above the facets allow the user to make use of the full Boolean expressions, spanning several attributes, which are provided by EXPLORE-5. On the right, data visualization techniques show the instances belonging to the current set (there is one circle for each instance and instances are ordered according to their timestamp). A typical exploratory session starts with the user taking a look at the various facets, looking at how their values are distributed.
The portal was created in cooperation between Politecnico di Milano and the University of Salento (Lecce, Italy) within a national research project (EDOC@WORK).
As can be seen from Fig. 1, emphasis is on the 43 facets, which entails more than 250 different values characterizing this “rich” dataset. The extension of the dataset is shown on the right (the small tiles within the mosaic): It can be used to visualize at a glance the current set and also to directly access each individual item. Various color schemes (unfortunately not shown in the figure) can be used, in order to visualize immediately the distribution of the values for a specific subset.
Let us now follow a possible exploration session. The portal describes features of educational projects where technology played an important role, carried on in various schools in Italy. Many of the facets are related to the TPACK (Technology, Pedagogy and Content Knowledge) model, a well-known theory in the educational technology field [41]. More specifically, the portal aims at emphasizing the distributed and dynamic nature of TPACK: i.e., how the different kinds of knowledge required within a technology-based experience are not in just the teacher’s head but distributed in the “environment” and also evolving, dynamically, as the experience unfolds [38, 42].

Exploration about the possible relation between teachers’ increased Technology Knowledge and their age/area of teaching
Figure 2 shows the portal after a few interactions. The user has opened a few facets in percentage visualization, to explore the flow of TK (Technology Knowledge). The attention, for the time being, is on TK for the teacher (right side of the figure, up): 39.8% of them had high knowledge before the experience, while 20.3% had a low one. After the experience, 20.3% of teachers show a high increase in TK while 30% have a low increase in TK. On the left, the facets “age” of the teachers and “area of teaching” are opened, in order to figure out which factors may influence the increase of TK for teachers.

The value “teachers holding a high Technology Knowledge before the experience” is selected, showing that more than 71% of them are aged between 40 and 60 (left side)
Figure 3 shows the portal after other interactions. The user has modified the dataset by selecting the teachers with high TK before the experience. On the right-hand side, the mosaic shows the items satisfying the selection, but the extension is not interesting for the user, who is attracted instead by the facet on the teachers’ age: More than 71.4% of the teachers, in fact, are aged between 40 and 60. Contrary to what might be expected, older teachers know technology better than younger teachers.

The value “teachers holding a high Technology Knowledge before the experience” is negated
This percentage was 60.1% in Fig. 2, and it drops down to 52.7% if the dataset is changed by excluding “not having high TK” before (as shown in Fig. 4). The area of teaching instead does not seem to play a major role since the percentages do not change much.

Relation between teachers’ and students’ improvement in Technology Knowledge. Where teachers have a “high” gain, students learn more
Now the user wants to understand whether the gain in TK by the teachers is correlated to the gain of TK by the students. Figure 2 seems to indicate that only 27% of the students have a high gain in TK (column on the right, lower facet about TK-after), after the experience. But if the set is changed by selecting teachers with high gain of TK (see Fig. 5), this percentage raises to 42.8%! Apparently, teachers and students learn together, when teachers have a high gain, students learn more.

How the presence of excellent students influences the achievement (for students) in Technology Knowledge (right side, lower box marked as TK-After)

How the presence of excellent students combined with teachers who gain high Technology Knowledge (right side, higher box marked as TK-After) influences the students’ achievement of Technology Knowledge (right side, lower box marked as TK-After)
After a few other interactions, the user discovers that the school level does not seem to influence much the high level of TK acquired by the students. The user tries now several additional interactions. Figure 6 shows another interesting phenomenon: While the general performance of the students does not seem to be very influential, the presence of “some” AND “many” excellent students brings the percentage of students with high gain in TK to almost 36.8% (it was 27.6% in Fig. 2). If this gets combined with teachers with high gain in TK (as shown in Fig. 7), the percentage of students with high gain in TK skyrockets to over 57%! This means that when both teachers strive to learn and excellent students are there (probably giving vent to peer-to-peer learning strategies), benefits in TK are higher.

The architecture of EXPLORE-5
From the point of view of research in educational technology, we can observe that understanding the complexity of distributed/dynamic TPACK requires for sure long and rich exploration sessions, in order to fully understand the implication behind the sheer data. But even a relatively simple exploration as the one just illustrated shows the high potential for research of this tool. From the point of view of the mechanics of the exploration, we have a number of observations:
-
Several subsets have been created during the exploration. At almost every step, the standard answer search/query engines would provide (i.e., “which items correspond to my request”) would basically be irrelevant. As the example shows, the user is almost never interested in the “extensional answer”: She looks at the features and properties of the various subsets, not at the list of experiences.
-
The varieties of possible combination of attributes cannot be anticipated in advance. The user discovers what she is looking for along the way.
-
Even a user with a mild understanding of the educational technology domain can undergo a fruitful exploration session.
-
Exploration (with this type of portals, at least) is a complex interactive process, made of several attempts and trials.
-
It is important to save intermediate stages of exploration along the way, in order to be able to step back and follow promising tracks among the many that open up during a session.
5.2 The technology
As depicted in Fig. 8, users access an exploratory portal through a standard web browser. Two modules take care of the business logic: Faceted Search service and Data Mining service. This facilitates the system’s evolution and the correct intertwining of the two services at the presentation layer. The Faceted Search service is built upon Apache Solr [43] that provides features as full-text search, Faceted Search, real-time document indexing, and dynamic clustering. The Solr engine is executed by Apache Tomcat runtime. The interface layer invokes the Faceted Search service via a JSON interchange protocol and asynchronous JavaScript. Instead, the Data Mining service is based upon Microsoft OLE DB technology [44]. This technology provides us with enough flexibility to be able to easily add new and various data mining algorithms. As for the Faceted Search service, also the Data Mining service is invoked via a JSON protocol and asynchronous JavaScript interface. Moreover, the dataset to be explored using the portal is inserted via an EXCEL-like interface that is then transformed, via an input module, in a relational database [40].
6 Experimental evaluation: user experience
In order to test whether our approach is actually fulfilling the EC objectives, we set up a focus group with scholars from Italian universities and research centers from two domains: education and educational technology. There were representatives from five different research groups, each represented by one/two scholars. The focus group was deemed the best way to assess the approach’s validity because of the ease of going into details where issues emerge: Exploratory portals are meant to support non-trivial tasks, and therefore our aim was understanding what did or did not work, not just in terms of small technicalities, but from a general usability viewpoint.
The focus group was held at HOC-LAB’s premises. There was a focus group leader in charge of managing the conversation and an assistant in charge of taking notes. The first step consisted in an introduction to the focus group’s goals and to the portal. The portal was described in broad terms and the main functionalities were shown. Then, the participants were split into small groups of two persons per each and were asked to perform simple tasks on the portal to test their ability to do so. Participants gathered again; the focus group leader asked each of them whether they had encountered any difficulty and whether the main affordances were clear. Being most of the feedbacks positive, the possibility by the participants to use the portal was assessed. As last step, the leader assigned participants a task that would go beyond the focus group’s boundaries, i.e., to perform complex research investigations in the field of educational technology using the portal. This task would require participants not only to identify their research goal but also the queries needed to accomplish it. The queries were performed outside the limits of the focus group, and the outcomes were elaborated and gave vent to further investigation. In the end, seven different research reports were produced (some of which were later published):
-
1.
The Unexpected Learning: How Unexpected Benefits Can Be Generated Through ICT-Based Experiences, by the Polytechnic University of Marche
-
2.
PoliCultura and Moodle: A Blended Learning Environment, by the University of Perugia
-
3.
Educational Technology at the Primary School Level: A Survey, by the University of Perugia
-
4.
Inclusion and Group Work: What Benefits? by Politecnico di Milano
-
5.
Educational Technology at Junior High-School Level: A Survey, by the University of Bologna
-
6.
Technology@School: Analysis of an ICT-Based Format, by the University of Bologna.
-
7.
Investigation on the Relationship Between Technology and Educational Benefits, by the University of Salento
As the reader can see, the tiles of the reports are quite broad, meaning that the portal allowed comprehensive investigations. Let us look into more details into one of them, “Inclusion and Group Work: What Benefits?” [45] to see what queries were identified in order to perform the investigation. First of all, the main issue was split into 3 research questions:
-
Is there any relation between inclusion and group work?
-
How are experiences dealing with inclusion through group work characterized?
-
What are the differences between two relevant group work organizations, namely heterogeneous and homogenous groups?
To address the first question, the value “inclusion” was selected and the facet on “organization” was explored to see how values had reacted to the selection. The outcome being positive (“group work” does react to the inclusion value) the second query was performed, by creating a subset characterized by “inclusion” (but NOT by disability issues) AND group work in all possible variants (heterogeneous, homogeneous,...). Subset 1 was then compared to the initial set to see how all the other facets had changed. The last research question was eventually addressed by creating two further subgroups, by selecting “homogenous group work” and “heterogeneous group work,” respectively, and comparing them. The results of the above were many and manifolds, and it would be beyond the scope of this paper to go through them (the reader can find a comprehensive description in [45]): what matters is that the portal allowed a quick investigation of relevant issues in the field of educational technology in an effective and user-friendly way.
After the report’s completion, the representatives from each group were interviewed (via Skype) on their usage of the portal. Results are reported elsewhere [38]; for the purpose of this paper, notice that one of the most significant feedbacks was on the “Browsing and serendipity” affordances. In other words, scholars explained that, as an effect of an interaction activity, the portal enticed them to perform further queries they had not thought about at first, and that in doing so they, so to speak, “stumbled” upon unexpected discoveries.
The portal was then redesigned, and further investigations were performed (this time by HOC-LAB of Politecnico di Milano) that again gave vent to scientific publications. Though certainly still subject to improvements, the portal is proving its usefulness as a research tool for non-expert users.
7 Conclusions
In this paper, we illustrated EC, an approach, rather than a specific technique, to assist (non-expert) users in the exploration of Big and Rich datasets. Examples described in this paper show that existing techniques can be “reused” (e.g., faceted search, data mining, semantic queries, data visualization) or new techniques can be developed (as shown in this paper). The relevant aspect, however, is the purpose for which techniques are contrived and combined, i.e., to support an “exploration” (which is not a search, nor a query, nor a visualization), with a number of distinctive features:
-
(A)
emphasis upon the “intensionality” of the datasets, i.e., their “meaning,” versus “extensionality” (i.e., the items they contain).
-
(B)
capability to accommodate users with various kinds/degrees of knowledge: those who know very well the domain and the specific dataset, those who know the domain but not the specific dataset, those who have a weak understanding of the domain, ...
-
(C)
support for in-depth exploration: discovery (e.g., of interesting features), understanding (e.g., of the domain and of the specific dataset), identification of interesting subsets, discovery of “niche features” (e.g., features belonging to subsets only), comparison of features of subsets, etc.
-
(D)
sensemaking: At the end of a session, the user has a better understanding of the domain and of the specific dataset being explored.
All the above do not exclude any of the features of the “kin” approaches like search, data mining etc., but it puts them in a different perspective. Point A, for example, means that it is not so relevant to identify “which items satisfy q” (extensional perspective), but rather to understand “the properties of items that satisfy q” (intensional perspective). Point B implies that an exploration can combine the classical query approach (requiring a user to be aware of the structure of the underlying knowledge) with the classical search approach (allowing the user to perform an unstructured search). In fact, a good implementation of an EC system aims (also) at an evolution of the user’s understanding of the domain. It is part of the “sensemaking.” Points C and D imply that a good exploratory session may include well-defined goals, ill-defined goals and also almost-no-goal at all (if not general understanding). The goal may be modified and discovered along the way, and in a sense a good exploratory session should/could include the sharpening or definition of goals. Given the above, an exploratory session should be meant as a long-term one, requiring several interactions with the same dataset, each time possibly redefining goals, perspectives and understanding.
Among the several directions of research that the authors are pursuing, we outline a few specific challenges: Not necessarily they are “the most important issues” but they demonstrate the richness of research possibilities that an EC approach can lead to.
-
Relevance Since the aim of EC is to help users make sense of data, their “relevance” is an important issue to be considered [46]. As explained in Sect. 2, an EC system must be able to support different interpretations of relevance (quantitative, qualitative) and a quick switch among them. We are therefore struggling with several technicalities in order to allow her to do so: data modeling, concrete data representation, interface design, interaction design, etc.
-
Subsets creation and comparisons After some observations of users’ sessions, we noted that oftentimes more than the properties of data in the “universe” (i.e., the initial set) the properties of “subsets” of the universe matter, in comparison with either the universe itself or other subsets. A sentence like “primary schools make use of tablets a lot” should not be interpreted at face value, but getting to know the data that support it, which are: \(25\%\) of primary schools make use of tablets, which is a higher percentage with respect to the average \(12\%\). Another example is as follows: If we wonder in what sense Lombardy schools are characterized with respect to, let us say, Sicilian (or any other region) schools, what we are hinting to is, in fact, a comparison between subsets. The above raises complexities since, as we have said many times, during an exploration a user may take different points of view and change her mind on the way. Here are some possibilities: (a) the user knows how to qualify subsets (e.g., by regions) and which facets she is interested in (e.g., how technology affects learning benefits); (b) the user knows how to qualify subsets (e.g., by regions) but has a vague if not totally missing idea about which facets she is interested in (she actually wants to discover them); (c) the user does not know how to qualify subsets, but she knows which facets she is interested in (e.g., how technology affects learning benefits); (d) the user does not have predefined hypothesis and tries to discover which subsets may help her sketch interesting hypothesis. The reader may well understand how the goal of supporting all these possibilities as well as letting the user continuously change her point of view is technically difficult in terms of performance as well as of interfaces’ design.
-
Long terms, collaborative and semi-interactive sessions While using an exploratory system, users create a lot of intermediate results (subsets, property analysis, interesting screenshots, etc.). First of all, there is the need of keeping these materials organized (the history of a browser would not be enough); secondly, after several minutes (or a few hours) of exploration, users need to suspend their work and retrieve it later. Another observation is that explorations are not a one-man-job; typically, researchers need to compare their work, exchange intermediate results, intervening in the exploration started by someone else. Exploration create trees (or forests!) of intermediate sessions. Keeping track of them and making them truly collaborative is a challenge. Finally, the notion of “interactive” session should be revised. Long-lived exploration sessions must be understood and properly addressed.
This proposal prompts a growth of new research and various techniques, within the overall frame of EC, not necessarily connected with the two specific systems described in this paper but “exploring” in depth all the possible declensions and interpretations of the concept.
Notes
By rich data we mean data presenting many properties, or facets, as opposed to very simple data like sensor readings or numerical series.
“Meanings are often called intensions, and things designated, extensions” (Stanford Encyclopedia of Philosophy, retrieved April 2016—http://plato.stanford.edu/entries/logic-intensional/#WhaAbo).
In the database world, the notion of facet may well be assimilated to that of attribute. While not necessarily this means being constrained to the choice of a relational database, the examples used from now on will often draw from the relational world for the sake of simplicity.
References
Di Blas, N., Mazuran, M., Paolini, P., Quintarelli, E., Tanca, L.: Exploratory computing: a draft manifesto. In: International Conference on Data Science and Advanced Analytics, pp. 577–580 (2014)
Di Blas, N., Mazuran, M., Paolini, P., Quintarelli, E., Tanca, L.: Exploratory computing: a challenge for visual interaction. In: International Working Conference on Advanced Visual Interfaces, pp. 361–362 (2014)
Buoncristiano, M., Mecca, G., Quintarelli, E., Roveri, M., Santoro, D., Tanca, L.: Database challenges for exploratory computing. SIGMOD Rec. 44(2), 17–22 (2015)
Idreos, S., Papaemmanouil, O., Chaudhuri, S.: Overview of data exploration techniques. In: Proceedings of the 2015 ACM SIGMOD International Conference on Management of Data, pp. 277–281 (2015)
Morton, K., Balazinska, M., Grossman, D., Mackinlay, J.: Support the data enthusiast: challenges for next-generation data-analysis systems. Proc. VLDB Endow. 7(6), 453–456 (2014)
Benveniste, E.: Problèmes de linguistique générale. Gallimard, Paris (1966)
Pirotte, A., Roelants, D., Zimányi, E.: Controlled generation of intensional answers. IEEE Trans. Knowl. Data Eng. 3(2), 221–236 (1991)
Goldin, D.Q., Kanellakis, P.C.: Constraint query algebras. Constraints 1(1/2), 45–83 (1996)
Saracevic, T.: Relevance: A review of the literature and a framework for thinking on the notion in information science. part iii: Behavior and effects of relevance. J. Am. Soc. Inf. Sci. Technol. 58(13), 2126–2144 (2007)
Han, J., Kamber, M., Pei, J.: Data Mining: Concepts and Techniques, 3rd edn. Morgan Kaufmann Publishers Inc., Los Altos (2011)
Tan, P., Steinbach, M., Kumar, V.: Introduction to Data Mining, 1st edn. Addison-Wesley Longman Publishing Co. Inc., Reading (2005)
Mazuran, M., Quintarelli, E., Tanca, L.: Data mining for XML query-answering support. IEEE Trans. Knowl. Data Eng. 24(8), 1393–1407 (2012)
Baralis, E., Garza, P., Quintarelli, E., Tanca, L.: Answering XML queries by means of data summaries. ACM Trans. Inf. Syst. 25(3), Article No. 10 (2007)
Agrawal, R., Srikant, R.: Fast algorithms for mining association rules in large databases. In: International Conference on Very Large Data Bases, pp. 487–499 (1994)
Wartner, S., Girardi, D., Wiesinger-Widi, M., Trenkler, J., Kleiser, R., Holzinger, A.: Ontology-Guided Principal Component Analysis: Reaching the Limits of the Doctor-in-the-Loop. Springer, Berlin (2016)
Hund, M., Böhm, D., Sturm, W., Sedlmair, M., Schreck, T., Ullrich, T., Keim, D.A., Majnaric, Lj, Holzinger, A.: Visual analytics for concept exploration in subspaces of patient groups. Brain Inf. 3(4), 233–247 (2016)
Herrera, F., Carmona, C.J., Gonzalez, P., del Jesus, M.J.: An overview on subgroup discovery: foundations and applications. Knowl. Inf. Syst. 29(3), 495–525 (2011)
Saint-Paul, R., Raschia, G., Mouaddib, N.: General purpose database summarization. In: Proceedings of the 31st International Conference on Very Large Data Bases, VLDB ’05, pp. 733–744. VLDB Endowment (2005)
Suciu, D., Olteanu, D., Ré, C., Koch, C.: Probabilistic Databases. Synthesis Lectures on Data Management. Morgan & Claypool Publishers, San Rafael (2011)
Petry, F.E.: Fuzzy databases: principles and applications, vol. 5. Springer Science and Business Media, Berlin (2012)
Tunkelang, D.: Faceted Search. Synthesis Lectures on Information Concepts, Retrieval, and Services. Morgan & Claypool Publishers, San Rafael (2009)
Ranganathan, S.: Colon classification. Asia Publishing House, Kolkata (1964)
Yee, K.-P., Swearingen, K., Li, K., Hearst, M.A.: Faceted metadata for image search and browsing. In: Conference on Human Factors in Computing Systems, pp. 401–408 (2003)
Dakka, W., Ipeirotis, P.G., Wood, K.R.: Automatic construction of multifaceted browsing interfaces. In: International Conference on Information and Knowledge Management, pp. 768–775 (2005)
Schraefel, M.C., Wilson, M., Russell, A., Smith, D.A.: mSpace: improving information access to multimedia domains with multimodal exploratory search. Commun. ACM 49(4), 47–49 (2006)
Ferré, S., Hermann, A.: Semantic search: reconciling expressive querying and exploratory search. In: The Semantic Web: International Semantic Web Conference, pp. 177–192 (2011)
Walton, R.: Searching high and low: faceted navigation as a model for online archival finding aids (a literature review). J. Soc. N. C. Arch. 12(1), 65–99 (2015)
Sacco, G.M., Tzitzikas, Y.: Dynamic Taxonomies and Faceted Search: Theory, Practice, and Experience, 1st edn. Springer, Berlin (2009)
Spagnolo, L., Bolchini, D., Paolini, P., Di Blas, N.: Beyond findability search-enhanced information architecture for content-intensive rich internet applications. J. Inf. Archit. 2(1), 19–36 (2010)
Spagnolo, L.: Exploratory computing: designing discovery-driven user experiences. Ph.D. thesis, Politecnico di Milano (2013)
Heim, P., Ertl, T., Ziegler, J.: Facet graphs: complex semantic querying made easy. In: The Semantic Web: Research and Applications, pp. 288–302 (2010)
Popov, I.O., Schraefel, M.M.C., Hall, W., Shadbolt, N.: Connecting the dots: a multi-pivot approach to data exploration. In: The Semantic Web: International Semantic Web Conference, pp. 553–568 (2011)
Tukey, J.W.: Exploratory Data Analysis. Addison-Wesley, Reading (1977)
Stefanidis, K., Drosou, M., Pitoura, E.: you may also like results in relational databases (2009)
De Raedt, Luc: A perspective on inductive databases. SIGKDD Explor. Newsl. 4(2), 69–77 (2002)
Alippi, C., Quintarelli, E., Roveri, M., Tanca, L.: Towards a statistical framework for attribute comparison in very large relational databases. 10th Scientific Meeting of the Classification and Data Analysis Group (CLADAG 2015), Santa Margherita di Pula, 8–10 October 2015 (2015)
Meliou, A., Roy, S., Suciu, D.: Causality and explanations in databases. Proc. VLDB Endow. 7(13), 1715–1716 (2014)
Di Blas, N., Fiore, A., Mainetti, L., Vergallo, R., Paolini, P.: A portal of educational resources: providing evidence for matching pedagogy with technology. Res. Learn. Technol., 22, 1–26 (2014)
Paolini, P., Di Blas, N.: Exploratory portals: the need for a new generation. In: International Conference on Data Science and Advanced Analytics, pp. 581–586 (2014)
Di Blas, N., Mainetti, L., Paolini, P., Vergallo, R.: Exploratory computing: combining faceted search with data mining. In: Proceedings of the 24th Italian Symposium on Advanced Database Systems (2016)
Mishra, P., Koehler, M.: Technological pedagogical content knowledge: a framework for teacher knowledge. Teach. Coll. Rec. 108(6), 1017–1054 (2006)
Di Blas, N., Paolini, P.: Distributed and dynamic tpack: evidences from a (large) case study. In: Proceedings of Society for Information Technology and Teacher Education International Conference 2016, pp. 2815–2821. Association for the Advancement of Computing in Education (AACE) (2016)
Nayrolles, M.M.: Mastering Apache Solr: A practical guide to get to grips with Apache Solr. inKstall Solutions, Tigard (2014)
Tang, Z., Maclennan, J., Kim, P.P.: Building data mining solutions with OLE DB for DM and XML for analysis. ACM SIGMOD Rec. 34(2), 80–85 (2005)
Di Blas, N., Paolini, P.: Technology and group work: inclusion or diversification of talents? pp. 218–231 (2013)
Sperber, D., Wilson, D.: Relevance. Communication and Cognition, 2nd edn. Blackwell, Oxford (1995)
Author information
Authors and Affiliations
Corresponding author
Additional information
This paper is an extension version of the DSAA’2014 Long Presentation paper “Exploratory computing: a draft Manifesto” [1].
Rights and permissions
About this article

Cite this article
Di Blas, N., Mazuran, M., Paolini, P. et al. Exploratory computing: a comprehensive approach to data sensemaking. Int J Data Sci Anal 3, 61–77 (2017). https://doi.org/10.1007/s41060-016-0039-5
Received:
Accepted:
Published:
Issue Date:
DOI: https://doi.org/10.1007/s41060-016-0039-5