
Abstract
Strict relation between the substituents or functional groups attached to the coal macromolecules and the generation of the volatile products, e.g., CH4, H2O, CO, CO2, etc., during the coal pyrolysis is an important but confusing subject. In this paper, quadrupole mass spectrometry, gas chromatography, and 13C nuclear magnetic resonance are applied to real-time monitoring the formations of volatile products, off-line quantitative determination of the total products from the pyrolysis of a sub-bituminous coal (SC), and the changes of diverse substitents in the SC along with coke foamation, respectively. These measurements are also performed for the pyrolysis of a caking coal to contrast SC. The qualitative and quantitative data reveal that, during coal pyrolysis, the functional groups related with the formation of CO, i.e., ether, carbonyl, and anhydride, can directly generate CO via bond breaking, or take a detour of the formation of other intermediates via condensation and recombination firstly. Moreover, the formations of CO2 and CH4 are related to the direct removal of -COO- and -CH3, respectively.
Find the latest articles, discoveries, and news in related topics.Avoid common mistakes on your manuscript.
1 Introduction
It is generally recognized that the heterogeneous structure of coal is formed by a complex three-dimensional macromolecular network cross-linked by short aliphatic and etheric bridges (Liu et al. 2014a, b). A variety of substituents, such as hydroxyl, ether, ester, carboxyl, and alkyl groups are attached to the discrete/condensed aromatic rings in coal to form the main structure of coal macromolecules (Poutsma 1990; Ndaji et al. 1997). Pyrolysis is a most generally used technology for down-stream processing and clean utilizations of coal (Shabbar and Janajreh 2013). With the thermal decomposition of coal macromolecules, the substituents on the aromatic rings, including side substituents and bridged ones, are gradually deprived by the release of micromolecules, e.g., H2, CH4, H2O, CO, CO2, etc. (Arenillas et al. 1999). The relationships between substituents on aromatic rings and the volatile products have been extensively studied, but only qualitatively and superficially (Attar and Hendrickson 1980; Solomon et al. 1988; Ibarra et al. 1991; Solomon et al. 1993; Liu et al. 2012). For example, there were report indicating that methyl groups can be deprived and then capped by a hydrogen-free radical to form a methane at high temperature, while other reports concluded that at moderate temperatures the methane formation occurred as well even at moderate temperature, caused by cross-linking reactions. Therefore, mechanisms of the formation of volatile products in coal pyrolysis still remains inconsistent and elusive, even though new reaction models for coal pyrolysis have been proposed in recent years. (Solomon et al. 1988; Grant and Pugmire 1989; Fletcher and Kerstein 1990, 1992; Solomon et al. 1990a, b, c; Niksa 1991a, b, c, 1995; Solomon 1994; Tian et al. 2001).
To study the strict relations between the deprivations of substituents on aromatic rings in coal and the formation of volatile products in coal pyrolysis, the volatile products were always qualitatively or quantitatively analyzed by employing a variety of techniques, such as quadrupole mass spectrometry (QMS), Fourier transform infrared spectroscopy (FTIR), and gas chromatography (GC) (Dollimore et al. 1984; Solomom et al. 1990a, b, c). Many studies have successfully employed QMS and FTIR for real-time detecting the pyrolysis behavior of coal and its gaseous compounds evolution due to the rapid response and sensitivities of QMS and FTIR (Duan 2007; Duan et al. 2009; Wang et al. 2013a, b; Jia et al. 2013; Wu et al. 2014). FTIR is, however, not as sensitive as QMS for those micromolecules in the volatile products. Moreover, QMS and FTIR are always employed for qualitative analysis rather than quantitative one (Le et al. 2015). Compared with QMS and FTIR, GC operation is more accurate and reliable for quantitative analysis, but it has always to be off-line performed for compromising its defect of batch sampling. In addition, nuclear magnetic resonance (NMR) spectroscopy can provide powerful structure information on the different kinds of organic carbons, hydrogens, and oxygen-containing groups in coal, and additionally has good quantitative properties. The solid-state 13C NMR spectroscopy has been widely applied to directly characterize the carbon structural features and functional groups in fossil fuel in the past several decades (Axelson 1985; Davidson 1986; Miknis 1996; Genetti et al. 1999; Perry et al. 2000; Sun et al. 2003; Wang et al. 2013a, b).
In this study, real-time measurements by QMS combined with off-line analysis by GC were performed qualitatively and quantitatively to analyze the evolution rate of each gas along with the pyrolysis of caking coal and sub-bituminous coal. 13C NMR was performed to identify the structural information and the variety of organic carbons in raw coals and the corresponding staged char residues from the coal pyrolysis (Solum et al. 1989). Based on a famous coal model FG/DVC created by Solomon et al. (1992), we analyzed these data or information gotten from QMS, GC, and 13C NMR systematically, and then presented the relationships between the substituents on aromatic rings in coal and the evolution products, as well as the potential mechanisms of gas formation during coal pyrolysis.
2 Experimental
2.1 Samples
Caking coal (North Goonyella, NG) and sub-bituminous coal (Adaro, AD) were used in this study. The proximate and ultimate analyses are listed in Table 1. The coal samples were pulverized to less than 75 μm and dried under vacuum for 24 h.
2.2 Coal pyrolysis and analysis to the gas products
Coal powders of 2.0 g were used in each experiment. As shown in Fig. 1, loose-packed coal powders were heated up to 900 °C with a heating rate of 5 °C/min in a horizontal quartz tube reactor, with using argon as carrier gas with a constant flow rate of 200 mL/min (STP). Filtrated by quartz wool at the tail end of the quartz tube reactor, the volatile products from coal pyrolysis were detected by only one of two separated modes, QMS or GC.

Apparatus of horizontal tube reactor with quadrupole mass spectrometry
QMS (M-QA100TS, ANELVA Corp.) was used for real-time monitoring. The volatile products were introduced into the QMS through a capillary, which was convolved by tape heater of 200 °C to avoid condensation of coal tar therein. A diaphragm pump was used to help transporting the gas into the QMS by reducing the tube pressure to 25 mbar. The delay time of QMS detection was thus decreased within 5 s. The vacuum degree of QMS was kept at 1 × 10⁻⁵ Pa before measurement, and at 1 × 10⁻³ Pa during measurement. Other details of QMS operation were set as follows: ionizing voltage, 24 V; emission current, 1.0 mA; mass number range, 1–80 m/z; scan speed, 100 ms/amu. Mass numbers of 2, 15, 18, 28, and 44 were selected to characterize the presences of H2, CH4, H2O, CO, and CO2, respectively. Real-time evolution curves of these five gases during coal pyrolysis were thus obtained.
GC-TCD/FID (Himadzu, GC-8A and GC-14B) was used for off-line detection. Sufficiently cooled in two cold traps (0 and −70 °C), the non-condensable volatiles were collected into a gas bag, and then analyzed by GC-TCD/FID. H2O in coal tar, which had been retained by the quartz wool in tube reactor and the cold traps, was analyzed by Karl Fischer Moisture analyzer (MKC-210, KYOTO ELECTRONICS). Distribution of products from coal pyrolysis is shown in Table S1 (in Supplementary Information). The data that were obtained from off-line GC assisted the quantitative analysis of the evolution curves of gas products that were obtained from real-time QMS. Therefore, the function curves of gases production during coal pyrolysis with variables of temperatures were finally obtained by employing differential method.
Coal powders were further briquetted at ambient temperature and with mechanical pressure of 128 MPa for 8 min (Mori et al. 2011). Each briquette (1.0 g) was heated up to different target temperatures at the same heating rate of 5 °C/min with a N2 flowrate of 200 mL/min (STP) in a vertical quartz tube reactor for heat treatment coals, as shown in Fig. 2. Once reaching the target temperatures, the char briquettes were instantaneously cooled down by falling into the bottom of the reactor immersed in liquid N2. Yields of heat treatment coals at different temperatures are shown in Fig. S1 (in Supplementary Information). Thermo-gravimetric (TG) curves of the two coal samples were presented in that figure as well. Note that the TG curves are well consistent with those dots of yields, indicating the accuracy of our experiments. Residual heat treatment coals were then pulverized to powders for the characterizations by solid-state 13C NMR spectroscopy. The NMR spectra were recorded with the DEPTH2 technique at 100.53 MHz in a JEOL ECA 400 spectrometer. The repetition time was 20 s. Magic angle spinning was performed at 15 kHz in the commercial probe (JEOL 4 mm CPMAS). The 13C NMR data were then analyzed by a variation of the method described by Solum et al. (1989).

Apparatus of vertical tube reactor for heat treatment coals
3 Results and discussion
In our study, all the evolution curves of gases formation were deconvolved by several independent Gaussian-style functions, varying their parameters such as the locations, line widths, and intensities, to get the highest correlation coefficients. All the correlation coefficients of deconvolution results were higher than 99%. 13C NMR spectra were deconvolved based on the chemical shifts in previous reports (Solum et al. 1989; Kidena et al. 1999), analyzing the organic carbon varieties in the molecules of coal samples. With the help of elemental analysis of raw coal (Table 1), the organic carbons can be quantitatively classified into 8 varieties, i.e., methyl (-CH3), methylene (-CH2), aliphatic carbon with oxygen substituents (Al–O), protonated aromatic carbon (Ar–H), aromatic carbon with alkyl groups (Ar–C), bridgehead carbon, aromatic carbon with oxygen substituents (Ar–O), and carbonyl carbon (O=C–O, C=O) (see Tables 2 and 3). CH4, CO2, CO, H2O, and H2 are the main gas products from coal pyrolysis, and these gases are relative with specific functional groups of coal (Solomon et al. 1988, 1990a, b, c; Figueiredo et al. 1999; Kazuhiro et al. 2002), therefore, it is evident to quantitatively associate the gas outputs with the quantities of the functional groups.
3.1 Mechanism of CO formation
Figure 3 shows the yields of CO with elevated temperatures of coal pyrolysis, and the variations of the related Al–O and Ar–O. With the temperature elevated, CO formation is continuously increased, while the quantities of the two kinds of functional group Al–O and Ar–O are not linearly changed.

Integration of CO as a function of temperature and the trends of its relevant functional groups of Al–O and Ar–O of coal AD
-
(1)
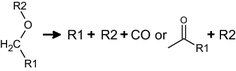
Ar–O increases while Al–O slightly decreased before 400 °C. It was because the side carbon chains in coal transformed into aliphatic carbon rings, and ether bonds were dissociated at the relative low temperature range. To be specific, coking process at low temperatures during coal pyrolysis resulted in the ring formation of side carbon chains. When a side carbon chains contained a primary hydroxyl group originally, the ring formation would cause the formation of Ar–O bonds (Reaction 1). Ether bonds were also easy to be dissociated during coal pyrolysis at low temperature, producing CO gas or carbonyl group, which should be the reason for the quantity of Al–O decreasing (Reaction 2). In the reactions, (coal)Ar- denotes the layer structure of aromatic rings in coal, while R- represents the substituents such as alkyl groups or aromatic rings.
 (1)
(1) (2)
(2) -
(2)
At the temperature range from 400 to 450 °C, the quantity of Ar–O decreased greatly while that of Al–O elevated slightly. In this stage, the formation of CO was not only related with Reaction 2, but also with Reaction 3. As shown in Reaction 3, the carbonyl group will be generated from the cleavage of Ar–O bond of Ar–O–R, only if -R denotes long-chain alkyl groups. CO is also possible to be formed only if -R represents -CH3. In addition, Al–O slightly increasing at the temperature range was probably attributed to the transferred ether groups from aromatic rings to side chains (see Reaction 4).
 (3)
(3) (4)
(4) -
(3)
At the temperature range from 400 to 450 °C, Ar–O increases while Al–O deceases. In this stage, the formation of CO was still attributed to Reactions 2 and 3. In addition, other reactions such as the condensation between O-containing heterocyclic compounds and aromatic rings, and aromatization of cycloalkanes should occur in this stage. Both of these two reactions can increase the quantity of Ar–O (Reactions 5 and 6). Moreover, according to these two reactions, the quantity of bridgehead C atoms should be increased simultaneously, which is also verified by the AD profile in Fig. 4.
 (5)
(5)Fig. 4 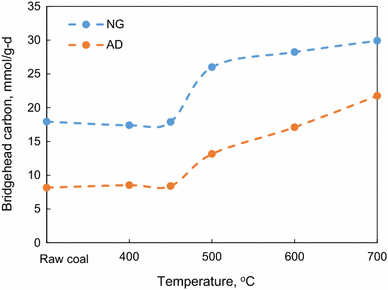
Trends of bridgehead carbons as a function of temperature of coal NG and AD
 (6)
(6) -
(4)
At the temperature range from 500 to 600 °C, the quantity of Ar–O begins decreasing significantly, while that of Al–O is continuously decreasing. In this stage, there was still CO gas generated through Reactions 2 and 3. Meanwhile, with deprivation of O atoms to form oxygen free radicals and to produce CO eventually, the O-containing aromatic rings started to condense, forming bigger condensed arenes. As a result, the quantity of Ar–O decreased largely.
-
(5)
Above 600 °C, Ar–O decreases continuously due to the presence of Reaction 7, while Al–O increased slightly since a few oxygen free radicals reacted with the side substituents of aromatic rings (Reaction 8).
 (7)
(7) (8)
(8)


As shown in Tables 2 and 3 and Fig. 5, compared with AD, NG contains similar quantity of Al–O but less Ar–O, while the CO formation of NG is less than that of AD. This further verifies that the formation of CO is closely relative with Ar–O. It is interesting that the variation profiles of Ar–O and Al–O of NG at the temperature range from ambient to 600 °C are similar with those of AD at the temperature range from 400 to 700 °C. This phenomenon implies that the molecular structures of NG might be similar with those of AD after treatment of pyrolysis at low temperatures. From ambient temperature to 600 °C, the Ar–O in NG should react successively as Reactions from 3 to 7, while Al–O should react as Reactions 2, 6, and 8. When the temperature was elevated above 600 °C, the quantity of Ar–O remained unchanged, while Al–O decreased greatly to form CO gas. This was mainly because the further pyrolysis of side substituents on aromatic rings occurred as Reaction 8.

Integration of CO as a function of temperature and the trends of its relevant functional groups of Al–O and Ar–O of coal NG
According to the above-mentioned analysis about the CO formation and the variations of related functional groups, we deconvolved the CO formation rate profiles of NG and AD, and further identified each independent reaction we proposed. According to previous reports, the CO formation of coal pyrolysis was closely related with three to five potential reactions (Seebauer et al. 1997; Hodek et al. 1991; Giroux et al. 2006). As shown in Fig. 6a, b and Table 4, we recognize that the CO formation is attributed to four independent reactions (correlation coefficients are higher than 99%). CO formation at low temperatures was related with the cleavage of ether group (Reaction 2), and this reaction occurred at a relative wide temperature range from 300 to 500 °C (Liu et al. 2014a, b). Peak 1 is thus assigned to Reaction 2. The reaction indicated by Peak 2 should be caused by the pyrolysis of anhydrides, which forms CO and CO2 at ca. 600 °C (Otake and Jenkins 1993; Zhuang et al. 1994a, b). Note that parts of these anhydrides existed originally in the raw coals, while other parts should come from the condensation of -COOH groups simultaneous with the H2O formation. Peak 3 was relative with the cleavage of carbonyls, which can produce CO at a high temperature (Figueiredo et al. 1999). Peak 4 can be assigned to free radical reactions. As above mentioned, the quantity of Ar–O started decreasing greatly since 500 °C, meanwhile the further condensation among aromatic rings were initiated. The condensation processes removed the O atoms, which then reacted with C and H atoms easily to form CO and H2O, respectively.

Gas evolutions and deconvolutions as a function of the temperature for coal AD and NG
The reactions involving oxygen free radicals were the main sources of CO formation both for AD and for NG, while one of the CO sources of NG at low temperature, the cleavage of ether groups, was not as significant as that of AD. This means the ether groups should widespread in sub-bituminous coal.
3.2 Mechanism of CO2 formation
The deconvolution results of rate profiles of CO2 formation are shown in Fig. 6c and d, in which Peak 1 is located at low temperature, and Peak 2 and 3 are located at 400 and 600 °C. These three peaks were attributed to the removal of carboxyl, ester group, and anhydride, respectively (Vinke et al. 1994; Zhuang et al. 1994a, b; Zielke et al. 1996; Zhao 2007). Note that, according to previous studies, the Peak 3 might include a few contributions from the decomposition of mineral substances at the temperature range from 600 to 700 °C (Li 2009; Wang et al. 2012), otherwise the quantity of CO2 formed at this temperature range should be same with that of CO (see Peak 2 of Table 4a, b) since the decomposition of anhydrides could generate same amount of CO2 and CO.
In Table 4, the quantities of CO2 of AD and NG are so different that CO2 formation of AD (1.72 mmol) is 15 times as much as that of NG (0.11 mmol). This was mainly caused by the different quantities of COO and C=O groups in AD and NG. There was 1.8 mmol COO and C=O in AD, while that in NG was only 0.6 mmol.
3.3 Mechanism of CH4 formation
The formation of CH4 was related with the cleavage of -CH3. As shown in Figs. 7 and 8, with increasing the temperature, the quantity of -CH3 decreases gradually, and the CH4 is produced continuously. There were several -CH3 types in coal, and the removals of different -CH3 groups occurred at different temperature ranges. The -CH3 attached to the aromatic rings in coal molecules can be classified into three groups in addition to those bonding with heteroatoms (Fig. 9). However, these -CH3 types cannot be distinguished from each other through 13C NMR spectra.

Integration of CH4 as a function of temperature and the trends of its relevant functional groups of -CH3 of coal AD

Integration of CH4 as a function of temperature and the trends of its relevant functional groups of -CH3 of coal NG

Segmental structure of coal for illustrating different kinds of methyl groups
As shown in Fig. 6e, f, the formation of CH4 can be attributed to three independent reactions. At the temperature range from 400 to 700 °C, the CH4 should be generated from the cleavage of β-CH3 (-1CH3 in Fig. 9). When the temperature was elevated to 600 °C, the cleavage of Ar-CH3 occurred (-2CH3 in Fig. 9). The formation of CH4 at the temperature higher than 600 °C should be related with the secondary pyrolysis of the long-chain alkanes attached to aromatic rings, since the pyrolysis of such alkanes required very high energy (-3CH3 in Fig. 9). Our study is also supported by previous reports (Zhao 2007; Li 2009; Porada 2004). Liu et al. (2014a, b) proposed the mechanisms of CH4 formation for coal pyrolysis at the temperature range from 400 to 700 °C, which is well consistent with our results.
In Fig. 6e, f, the temperature range of CH4 formation of AD is similar with that of NG. However, compared with AD, whose β-CH3 is the main resource for CH4 formation, the CH4 produced by NG is mainly generated from the cleavage of Ar–CH3. This means that there are many bridged alkyls and long side chains in the coal molecules of AD, while the condensed degree of NG is much higher than that of AD, such that the alkyls of NG are mainly attached to the aromatic rings.
3.4 Mechanism of H2O formation
As shown in Fig. 10, the temperature range from ambient to 900 °C for H2O formation is wider than that of any other gases. The physically adsorbed H2O in coal was emitted when the temperature is lower than 300 °C, while the pyrolysis of coal (mainly as the cleavage of –OH groups) at the temperature higher than 300 °C became the main resource of H2O formation (Suuberg et al. 1985; Ibarra et al. 1991). The formation of H2O was closely related with so many potential reactions that its temperature range is the widest. It was thus impossible to deconvolve its formation profile exactly. For example, as seen in Reactions 9–11, the cleavage of -OH was an important source for H2O formation, while other groups such as ether, ester, and anhydride that underwent pyrolysis at high temperature would produce oxygen free radicals to generate H2O eventually as well.


H2O evolution rates as a function of temperature for coal AD and NG
4 Conclusions
Based on the QMS analysis of the product gases of NG and AD and the 13C NMR spectra, the mechanism of coal structure changes at molecular level during pyrolysis are quantitatively revealed.
-
(1)
The CO formation can be mainly attributed to the cleavage of ether group, the removal of anhydrides, oxygen free radicals reaction, and cleavage of carbonyl groups. The removals of carboxyl, ester, and anhydride groups are the main reasons for the CO2 formation.
-
(2)
The quantity of Ar–O during coal pyrolysis will temporarily increase during coal pyrolysis due to the secondary effects of some reactions such as cyclization of side chains containing hydroxyl groups and condensation of O-containing aromatics. The quantity of Al-O increases temporarily as well, because of the migration of O free radicals.
-
(3)
The formation of H2O must be followed by those of CO and CO2. With the formation of anhydrides, esters, and ethers, the reactions among different carboxyl and hydroxyl groups during coal pyrolysis generate H2O first, and then their further reactions of removing anhydrides and esters must cause the formations of CO and CO2.
-
(4)
The formation of CH4 is relatively independent from that of other volatile products. It is generated by the cleavages of β-CH3, Ar–CH3, and long chain alkanes attached to the aromatic rings in coal molecules. The dissociation energies of methyls of different locations are greatly different from each other, so the main temperature ranges for CH4 formation depend largely on the coal ranks.
In addition, the different performances of coals with different ranks during pyrolysis are ascribed to their different quantities and distributions of O-containing functional groups, alkyls, and scales of aromatic rings. Representing caking coals, NG has less substituents, but higher aromaticity and condensation degree than those of AD representing sub-bituminous coals.
References
Arenillas A, Rubiera F, Pis JJ (1999) Simultaneous thermogravimetric–mass spectrometric study on the pyrolysis behavior of different rank coals. J Anal Appl Pyrolysis 50:31–46
Attar A, Hendrickson GG (1980) Pyrolysis of the polymer coal: structure and kinetics. Am Chem Soc Div Fuel Chem Prepr. US 25 ISBN CONF-800814-P3
Axelson DE (1985) Solid state nuclear magnetic resonance of fossil fuels. Brookfield Publishing Co. Inc, Brookfield. ISBN 0-919868-25-8
Davidson RM (1986) Nuclear magnetic resonance studies of coal. IEA Coal Research, Or IEA Coal Research, London, London
Dollimore D, Gamlen GA, Taylor TJ (1984) Mass spectrometric evolved gas analysis—an overview. Thermochim Acta 75:59–69
Duan CL (2007) Structural characteristics of low-middle rank coals and generation mechanisms of methane and hydrogen during pyrolysis. Master dissertation of Taiyuan University of Technology
Duan LB, Zhao CS, Zhou W, Qu CR, Chen XP (2009) Investigation on coal pyrolysis in CO2 atmosphere. Energy Fuels 23:3826–3830
Figueiredo JL, Pereira MFR, Freitas MMA, Orfao JJM (1999) Modification of the surface chemistry of activated carbons. Carbon 37:1379–1389
Fletcher TH, Kerstein AR (1990) Chemical percolation model for devolatilization. 2. Temperature and heating rate effects on product yields. Energy Fuels 4:54–60
Fletcher TH, Kerstein AR (1992) Chemical percolation model for devolatilization. 3. Direct use of 13C NMR data to predict effects of coal type. Energy Fuels 6:414–431
Genetti D, Fletcher TH, Pugmire RJ (1999) Development and application of a correlation of 13C NMR chemical structural analyses of coal based on elemental composition and volatile matter content. Energy Fuels 13:60–68
Giroux L, Charland JP, MacPhee JA (2006) Application of thermogravimetric fourier transform infrared spectroscopy (TG-FTIR) to the analysis of oxygen functional groups in coal. Energy Fuels 20:1988–1996
Grant DM, Pugmire RJ (1989) Chemical model of coal devolatilization using percolation lattice statistics. Energy Fuels 3:175–186
Hodek W, Kirschstein J, Heek KHV (1991) Reactions of oxygen containing structures in coal pyrolysis. Fuel 70(3):424–428
Ibarra JV, Moliner R, Gavilan MP (1991) Functional group dependence of cross-linking reactions during pyrolysis of coal. Fuel 70(3):408–413
Jia LY, Weng JJ, Wang Y, Sun SB, Zhou ZY, Qi F (2013) Online analysis of volatile products from bituminous coal pyrolysis with synchrotron vacuum ultraviolet photoionization mass spectrometry. Energy Fuels 27:694–701
Kazuhiro M, Taisuke M, Kouichi M (2002) A new method for estimating the cross-linking reaction during the pyrolysis of brown coal. J Chem Eng Jpn 35(8):778–785
Kidena K, Murata S, Artok L, Nomura M (1999) Estimation of the average aromatic cluster size based on solid-state NMR measurement of coal. Jpn Inst Energy 78:869–876
Le CD, Kolaczkowski ST, McClymont DEJ (2015) Using quadrupole mass spectrometry for on-line gas analysis-Gasification of biomass and refuse derived fuel. Fuel 139:337–345
Li MF (2009) Experimental study on kinetics and mechanisms of the main gaseous products generation from low rank coal pyrolysis. Doctoral dissertation of Taiyuan University of Technology
Liu SY, Zhang ZQ, Wang HF (2012) Quantum chemical investigation of the thermal pyrolysis reactions of the carboxylic group in a brown coal model. J Mol Model 18:359–365
Liu JX, Jiang XM, Shen J, Zhang H (2014a) Pyrolysis of superfine pulverized coal. Part 1. Mechanisms of methane formation. Energy Convers Manag 87:1027–1038
Liu JX, Jiang XM, Shen J, Zhang H (2014b) Pyrolysis of superfine pulverized coal. Part 2. Mechanisms of carbon monoxide formation. Energy Convers Manag 87:1039–1049
Miknis FP (1996) Applications of solid-state NMR in oil shale research. Ann Rep NMR Spectros 33:207–246
Mori A, Kubo S, Kudo S, Norinaga K, Kanai T, Aoki H, Hayashi JI (2011) Preparation of high-strength coke by carbonization of hot-briquetted Victorian brown coal. Energy Fuels 26:296–301
Ndaji FE, Butterfield LM, Thomas KM (1997) Changes in the macromolecular structure of coals with pyrolysis temperature. Fuel 76(2):169–177
Niksa S (1991a) FLASHCHAIN theory for rapid coal devolatilization kinetics. 1. Formulation. Energy Fuels 5:647–665
Niksa S (1991b) FLASHCHAIN theory for rapid coal devolatilization kinetics. 2. Impact of operating conditions. Energy Fuels 5:665–673
Niksa S (1991c) FLASHCHAIN theory for rapid coal devolatilization kinetics. 3. Modeling the behavior of various coals. Energy Fuels 5:673–683
Niksa S (1995) Predicting the devolatilization behavior of any coal from its ultimate analysis. Combust Flame 100:384–394
Otake Y, Jenkins RG (1993) Characterization of oxygen-containing surface complexes created on a microporous carbon by air and nitric acid treatment. Carbon 31(1):109–121
Perry ST, Hambly EM, Fletcher TH, Solum MS, Pugmire RJ (2000) Solid-state 13C NMR characterization of matched tars and chars from rapid coal devolatilization. Proc Combust Inst 28:2313–2319
Porada S (2004) The reactions of formation of selected gas products during coal pyrolysis. Fuel 83:1191–1196
Poutsma ML (1990) Free-adical thermolysis and hydrogenolysis of model hydrocarbons relevant to processing of coal. Energy Fuels 4(2):113–131
Seebauer V, Petek J, Staudinger G (1997) Effects of particle size, heating rate and pressure on measurement of pyrolysis kinetics by thermogravimetric analysis. Fuel 76(13):1277–1282
Shabbar S, Janajreh I (2013) Thermodynamic equilibrium analysis of coal gasification using Gibbs energy minimization method. Energy Convers Manag 65:755–763
Solomon PR (1994) Impact of coal pyrolysis on combustion. In: Symposium (International) on Combustion pp 463–474
Solomon PR, Hamblen DG, Carangelo RM, Serio MA, Deshpande GV (1988) General model of coal devolatilization. Energy Fuels 2:405–422
Solomon PR, Hamblen DG, Yu ZZ, Serio MA (1990a) Network models of coal thermal decomposition. Fuel 69(7):754–763
Solomon PR, Serio MA, Carangelo RM, Bassilakis R (1990b) Analysis of the argonne premium coal samples by thermogravimetric fourier transform infrared spectroscopy. Energy Fuels 4:319–333
Solomon PR, Serio MA, Despande GV, Kroo E (1990c) Cross-Linking reactions during coal conversion. Energy Fuels 4:42–54
Solomon PR, Serio MA, Suuberg EM (1992) Coal pyrolysis: experiments, kinetic rates and mechanisms. Prog Energy Combust Sci 18:133–220
Solomon PR, Hamblen DG, Serio MA, Yu ZZ, Charpenay S (1993) A characterization method and model for predicting coal conversion behavior. Fuel 72(4):469–488
Solum MS, Pugmire RJ, Grant DM (1989) 13C Solid-state NMR of argonne premium coals. Energy Fuels 3:187–193
Sun QL, Li W, Chen HK, Li BQ (2003) The variation of structural characteristics of macerals during pyrolysis. Fuel 82:669–676
Suuberg EM, Lee D, Larsen JW (1985) Temperature dependence of crosslinking processes in pyrolysing coals. Fuel 64(12):1668–1671
Tian YJ, Xie KC, Zhu SY, Fletcher TH (2001) Simulation of coal pyrolysis in plasma jet by CPD model. Energy Fuels 15:1354–1358
Vinke P, Eijk MVD, Verbree M, Voskamp AF, Bekkum HV (1994) Modification of the surfaces of a gas-activated carbon and a chemically activated carbon with nitric acid, hypochlorite, and ammonia. Carbon 32(4):675–686
Wang M, Dong Q, Lu SF, Tian SS, Chen GH, Sun YF (2012) Pyrolysis products characteristics and kinetic analysis of coal from Shahezi Formation of Songliao Basin under the TG-MS experiment. J Chin Coal Soc 37(7):1150–1155
Wang PF, Jin LJ, Liu JH, Zhu SW, Hu HQ (2013a) Analysis of coal tar derived from pyrolysis at different atmospheres. Fuel 104:14–21
Wang SQ, Tang YG, Schobert HH, Guo YN, Gao WC, Lu XK (2013b) FTIR and simultaneous TG/MS/FTIR study of late permian coals from Southern China. J Anal Appl Pyrolysis 100:75–80
Wu D, Liu GJ, Sun RY (2014) Investigation on structural and thermodynamic characteristics of perhydrous bituminous coal by fourier transform infrared spectroscopy and thermogravimetry/mass spectrometry. Energy Fuels 28:3024–3035
Zhao LH (2007) Research of reactivities of coal during pyrolysis and gasification. Master dissertation of Taiyuan University of Technology
Zhuang QL, Kyotani T, Tomita A (1994a) DRIFT and TK/TPD analyses of surface oxygen complexes formed during carbon gasification. Energy Fuels 8:714–718
Zhuang QL, Kyotani T, Tomita A (1994b) The change of TPD pattern of O2-gasified carbon upon air exposure. Carbon 32(3):539–540
Zielke U, Huttinger KJ, Hoffman WP (1996) Surface-oxidized carbon fibers: I. Surface structure and chemistry. Carbon 34(8):983–998
Acknowledgements
The authors are also grateful to the China Scholarship Council (Grant Numbers 201406420035 and 201406420041).
Author information
Authors and Affiliations
Corresponding author
Electronic supplementary material
Below is the link to the electronic supplementary material.
Rights and permissions
Open Access This article is distributed under the terms of the Creative Commons Attribution 4.0 International License (http://creativecommons.org/licenses/by/4.0/), which permits unrestricted use, distribution, and reproduction in any medium, provided you give appropriate credit to the original author(s) and the source, provide a link to the Creative Commons license, and indicate if changes were made.
About this article

Cite this article
Zhang, L., Qi, S., Takeda, N. et al. Characteristics of gas evolution profiles during coal pyrolysis and its relation with the variation of functional groups. Int J Coal Sci Technol 5, 452–463 (2018). https://doi.org/10.1007/s40789-017-0175-0
Received:
Revised:
Accepted:
Published:
Issue Date:
DOI: https://doi.org/10.1007/s40789-017-0175-0