
Abstract
The paper aims at presenting the recent European developments in water resources management with particular focus on the EU policies related to floods, droughts and ecosystems and their implementation. In this context, the Water Framework Directive (WFD), the Flood Directive and the Communication on Water Scarcity and Droughts are critically presented and analysed. Also, the main methodologies endorsed by the member states for the implementation of EU directives, such as the DPSIR (Driver-Pressure-State-Impact-Response), the risk assessment and the CEA (Cost-Effectiveness Analysis) are briefly discussed. Further, the first account of the implementation of the EU directives by the member states is presented, together with the statistics that resulted from the first River Basin Management Plans of WFD and the first results from the Flood Directive. It is concluded that despite the significant progress achieved up to now on the fulfilment of the environmental objectives, there is still a long way to go particularly for the new member states of the EU. Enhanced integration of all related policies and better coordination is still required for improving the effectiveness of the Programmes of Measures (PoMs) in the River Basin Districts of the EU territory. Finally, future amendments in European policies on water resources are discussed which will lead to revised environmental objectives for the second and third stage applications of the water directives by the EU member states.
1 Introduction
“Water resources management” as a scientific field has shifted through a number of approaches starting from the decade after the 2nd World War. In the 60s, water resources management (WRM) was characterised by a sectorial approach based on feasibility studies. In the 70s, the Environmental Impact Assessment was introduced which was enhanced in the 80s as Cumulative Impact Assessment. The “sustainability” concept was introduced in the 90s after the Brundtland’s commission report in 1987. Finally, in the new century, new concepts such as Globalisation, Integration, and Adaptiveness were introduced mainly by academics in international conferences, books and journals, and to a lesser extent in the legislation on water resources management.
During these last few decades the objectives and the true definitions of WRM also changed completely. From the objective to fulfil the needs for water of the various sectors of water consumption (municipalities, agriculture, industry, tourism etc.) in an efficient way, now WRM is conceived as the total set of coordinated cost-effective decisions, measures, and actions (including investments, legislation, planning, monitoring and organisational efforts), taken democratically, which aims at achieving a harmonious relationship among all related elements of the water system, now, and in a sustainable fashion in the future horizons. By “related elements” we mean mainly the three poles of the water system: water availability sources, water consumption centres and the environment (health of ecosystems and status of water bodies) (Tsakiris 2013).
This modern concept of Water Resources Management is obviously associated with new approaches in all aspects related to its strategic and operational framework. Changes in some of these aspects are depicted in Table 1.
Based on these new approaches, many countries around the globe created new legislation on WRM with varying effectiveness and success. Among the most remarkable attempts to organise water resources management on a multinational basis are the European water policies implemented through a number of benchmark directives which the EU member states endorsed and currently realise.
It is the aim of this paper to briefly present the implementation of the two major directives, the Water Framework Directive (2000/60) and the Flood directive (2007/60) together with other initiatives which all together address the topics of Floods, Droughts and Ecosystems from the European perspective.
2 The Water Framework Directive
As mentioned, the European water policies and their implementation are among the most remarkable developments in the field of water resources management in the recent decades. Among the various water-related policies of the EU, the WFD with its daughter directives and documents has established the framework for the protection of all waters (surface, transitional, coastal and groundwaters) in the EU territory. According to the WFD, all water bodies are classified as natural, heavily modified or artificial. The target is to bring all natural waters to good ecological and chemical status by 2015. At the same time, artificial and heavily modified waters should achieve a good ecological potential, although there is a possibility, in case of inability, this obligation to be postponed to 2021 or 2027.
Undoubtedly, the WFD represents the most important paradigm shift in the history of water resources management. The WFD recognises the physical boundaries of the water cycle starting from the environment with its limitations and opportunities. It applies the required measures in an organised way for a territorial unit which reflects a spatially wider system, the so called River Basin District (RBD), which in the majority of cases, incorporates multiple watersheds. Of great importance is the emphasis given to the improvement of the status of water bodies and the ecosystems, which is the target within a broader notion of an integrated system, in conjunction with the principles of cost recovery and effective public participation. In one word, the ultimate objectives in the WFD stipulate that good status of all European waters must be achieved by the end of 2015.
The objectives of WFD are achieved by:
-
1.
Preventing further deterioration, protecting and improving the status of water resources
-
2.
Promoting sustainable water use based on long-term protection of water resources
-
3.
Protecting and improving the aquatic environments through the reduction of discharges, emissions and losses of priority substances, and cessation or phasing out of discharges, emissions and losses of hazardous substances
-
4.
Reducing the pollution of groundwater and preventing its further pollution
-
5.
Mitigating the effects of floods and droughts
The key actions undertaken by the member states of EU for implementing the WFD, and the deadlines of completion of each action, are as follows:
-
1.
Identification of river basins and river basin districts (RBD) and the responsible authorities (2003)
-
2.
Characterisation of RBDs in terms of pressures, impacts and economics of water uses (2004)
-
3.
Operation of monitoring networks (2006)
-
4.
Intercalibration of the ecological status classification systems (2006)
-
5.
Formulation of Programme of Measures (PoM) for achieving the environmental objectives of WFD in a cost effective manner (2009)
-
6.
Formulation of River Basin Management Plans for each RBD (2010)
-
7.
Implementation of water pricing policies (2010)
-
8.
Implementation of measures of each PoM (2012)
-
9.
Implementation of PoMs and achievement of the environmental objectives of WFD (2015)
In the next paragraphs, an attempt is made to present the results of the implementation of the WFD in nearly all the RBDs of the member states some months before the benchmark deadline for the fulfilment of environmental objectives (end of 2015).
3 The Flood Directive
Traditionally, the defence against floods has been achieved by flood protection engineering structures based on “design” events of certain severity aiming at avoiding damages in the flood-prone areas. Statistical analysis based on historical or even modelled samples of floods has been used for calculating the “return period” associated with the projects to be constructed for the protection of these areas.
The EU flood directive 2007/60 (European Council 2007) represents also a paradigm shift in the approach of dealing with floods. The new studies are oriented towards the rationalisation of the procedure for the selection of the flood risk mitigation measures. According to the directive, flood scenarios are formulated corresponding to high, medium and low probability, and then, the corresponding risk (in terms of losses/damages) is evaluated. Further improvements are proposed if the anticipated damage cost is higher than the cost of the proposed protection measures. In fact from “structural defence” based on a certain probability of exceedance, we move to a balance of flood risk and protection measures. As a statesman mentioned, the flood directive can be summarised by the slogan “we have to live with floods” (Tsakiris 2014).
The flood directive implementation is based on the following consecutive steps (Tsakiris et al. 2009):
-
preliminary delineation of flood-prone areas
-
flood hazard maps
-
flood risk map resulting for each probability scenario
-
flood management plans
The flood hazard map shows the highest inundation depths at each point in the entire domain, whereas the flood risk map shows the damages/losses at each cell of the computational field in monetary units. From the above two maps, the rational selection and prioritisation of measures or combination of measures can be made.
As will be presented later in this paper, the implementation of the flood directive by the member states proved very useful and it expected to gradually contribute in devising rational plans for the protection of the flood-prone areas (Pistrika et al. 2014).
4 Drought Preparedness Planning
Water scarcity and droughts mainly threaten regions with insufficient water resources such as the Mediterranean regions. Recently, signs have been observed that water stress is threatening also the water sufficient (developed) countries of Northern Europe.
As proposed by several scientists, the general term describing the stress conditions due to lack or deficiency of water, is called water scarcity. The related terms of aridity and drought are defined as “a natural permanent imbalance in the water availability characterising the climatic conditions of a region”, and “a natural but temporary imbalance of water availability caused mainly by low precipitation”, respectively (Tsakiris et al. 2013). It has been shown that apart from low precipitation, the high evaporative demand can also cause or foster drought events. Also water shortage is defined as the deficit of water supply to meet the demands of the various sectors. In this deficit the inappropriate use of water resources and the man-induced changes play an important role. As all natural hazards, droughts affect entities involving a number of interrelated elements conventionally known as systems. Figure 1 depicts the process of assessment of the system risk caused by drought (Tsakiris et al. 2013). As can be seen from Fig. 1, droughts create water shortage, and subsequently, impacts to vegetation and rainfed agriculture, irrigated agriculture, municipalities, industry, tourism and recreation.

Drought risk assessment (after Tsakiris et al. 2013)
In this figure, one can also identify the variables involved, and the sub-systems affected by each type of drought (meteorological, vegetation/agricultural and hydrological).
Water scarcity problems caused by droughts are most likely to intensify in the future due to predicted climate change aggravating this situation in parts of Europe, which also have high water demands for their intensive agriculture, high population density and tourism.
In view of this problem, the European Commission issued the Communication on water scarcity and droughts in 2007 (EC 2007). Although no new daughter directive was devised to fulfill this gap, the member states were asked to address water scarcity problems in the framework of the RBMPs of the WFD.
The Communication on water scarcity and droughts identifies seven policy options for combating water scarcity problems:
-
water pricing
-
more efficient water allocation
-
improving drought risk management
-
considering additional water supply infrastructures
-
fostering water efficient technologies and practices
-
contributing to the water-saving culture in Europe
-
improving knowledge and data collection
Periodic follow-up reports of this Communication, assessing the vulnerability to drought in the regions of the member states and proposing the necessary actions, have been published in recent years (ETC/ICM 2012).
It should be noted that, as in the case of the previous directives, the main approach to address water scarcity problems mainly caused by droughts has changed from the traditional reactive crisis management approach to proactive risk management. However, the effort to implement the proactive approach to combat droughts revealed the inadequate institutional capacity of most member states for altering the previous established response.
It should be noted that permanent water scarcity problems (associated with the aridity of a region) call mainly for engineering projects and management measures which result in conservation and augmentation of water resources. On the contrary, water scarcity caused by droughts requires the implementation of Preparedness and Contingency plans.
5 Principal Methodologies Adopted at European Level
The EU strategy to improve the water quality of its waters and mitigate the effects of floods and droughts are implemented following the relevant directives and the associated documents (e.g., guidance documents for common implementation strategy). However, the topics addressed are so many and the hydro-meteorological conditions so diverse throughout the EU territory, so that no specific tools for most operations can be specified. However, some general methodologies have been adopted for the improvement of ecosystems and for combating phenomena such as floods and droughts. From these principal methodologies we present briefly three which have been adopted throughout the EU.
-
a) The DPSIR framework
Although the impacts on the water bodies are the result of pressures, in most cases a systematic analytical framework is required for linking pressures and impacts. According to the Guidance document for the common implementation strategy (no.3), the DPSIR (driver-pressure-state-impact-response) analytical framework may be used as illustrated in Fig. 2. The explanation of the DPSIR may be achieved through the explanation of terms as follows (Benedini & Tsakiris 2013):
-
Driver: activity which may have an environmental impact (e.g., industry)
-
Pressure: direct effect of the driver (e.g., pollution of the water body)
-
State: physical, chemical and biological status of the water body
-
Impact: environmental effect of the pressure (e.g., fish deaths)
-
Response: measures taken to improve the state of the water body
Fig. 2 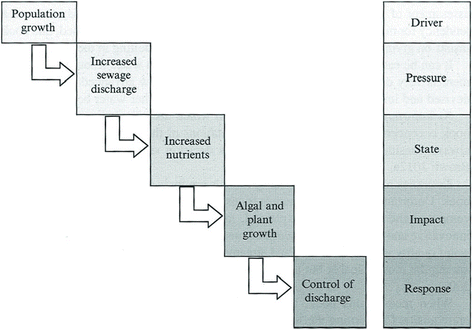
An example of the DPSIR approach (after Benedini & Tsakiris 2013)
-

The DPSIR methodology has been devised practically for all types of drivers in interesting case studies (e.g., ETC./ICM 2012; Alexakis et al. 2013) assisted by research efforts such as ECOFRAME (Moss et al. 2003) and use of water quality indices (Alexakis et al. 2015).
-
b) The risk approach
In order to combat extreme hydro-meteorological events, the risk approach has been adopted in the EU directives and communications. More clearly, the risk approach is incorporated in the Flood directive (Directive 2007/60). The essence of the approach is to quantify the flood or drought threat by studying the historical events of a long timeseries. This is known as hazard of the corresponding natural phenomenon. From the hazard, the real danger (expected consequences) for a potentially affected system is estimated through the vulnerability of the system which reflects the system’s capacity, its exposure and preparedness to deal with the event. The level of consequences of a particular event, given the existing vulnerability of the system, is the risk on the system caused by the hazardous phenomenon. Schematically, the steps for calculating risk from hazard are presented in Fig. 3. Therefore, the Programme of Measures (POMs) for each affected system should have as principal aim to reduce the risk caused by the timeseries of the hazardous events.
Fig. 3 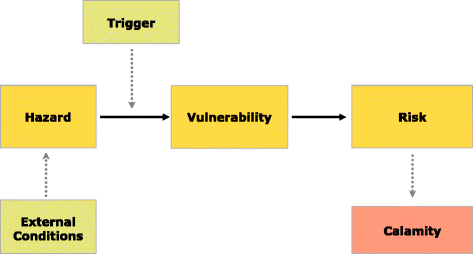
The risk assessment approach

-
c) The Cost Effectiveness Approach (CEA)
As stated in the WFD, the proposed measures and projects in the Programme of Measures (POM) for fulfilling the WFD environmental objectives should be those which are most effective or they represent the most effective combination of them.
Although there is no specific methodology proposed in the WFD for the selection of measures, the Cost-Effectiveness Analysis (CEA) proposed by the WATECO group (EC 2003) has been used in most member states, including Germany (Interwies et al. 2004) and the UK (DEFRA 2007). The method of CEA compares the costs and outcomes of two or more courses of action for choosing the least costly measure or combination of measures to achieve the set objective.
According to Jacobsen (2007), the CEA is expressed by the cost effectiveness ratio (R) which is defined as
$$ R=AEC/ Effectiveness $$(1)where AEC is the annual equivalent cost (e.g., Euros/year) and “effectiveness” is the corresponding quantitative change in either the impact or the pressure.
Obviously a discounting process is necessary for calculating the AEC which includes both the annual value of the investment costs plus the annual operational and maintenance cost related to the action. As expected, the discount rate is left to the member states to decide which led to different rate to be selected by each country (e.g., Spain uses 2 %, Denmark 3 % and the Netherlands 4 %) (Berbel et al. 2011).
There are arguments focusing on the bias of the method towards large scale actions (Aulong et al. 2009) and on the mono-disciplinary (predominately neoclassical) perspective (Martin-Ortega 2012), instead of the multicriteria approach which is widely declared in the documents related to WFD (Tsakiris & Spiliotis 2011; Tsakiris et al. 2015).
6 WFD Implementation: The First Account
In 2012, the European Commission published its “Blue-print to safeguard European Waters” comprising reviews of the WFD and on policies related to water scarcity, droughts and adaptation to climate change (EC 2012a, b, c). During the same year, the European Environment Agency published a set of reports with the title “State of Europe’s water” in support of the EC Blue-print (EEA 2012).
Most of the statistics presented in this paragraph are derived from these reports which summarise assessments of the WFD River Basin Management Plans (RBMPs) finalised during the first round of implementation of WFD by the member states.
By November 2012, all European member states had improved RBMPs (with the exemption of four member states). All related information for 161 RBDs was gathered into the WISE-WFD database. Specific information and data have been gathered for 1.1 million km of European rivers divided into 104,000 water bodies with an average length of 11 km. Also, for 19,000 lake water bodies and 4000 coastal and transitional water bodies (Kristensen et al. 2013).
The major pressures on the European waters are water pollution, water scarcity (including droughts), floods and modification to water bodies. In particular, pollutants of the aquatic ecosystems have their origin in agriculture, industry, municipalities and other sources. According to the EEA reports (EEA 2011), a significant progress in pollution reduction has been observed over the last 25 years which is due to improved wastewater treatment as well as the reduced volumes of industrial effluents, fertilisers, detergents, and atmospheric emissions. Therefore, the quality of European water bodies has been improved over the last few decades.
This is mostly related to the implementation of the water related directives which pre-existed to WFD (e.g., the Nitrate Directive etc.). However, despite the progress made, still diffuse pollution from agriculture is a significant pressure for 40 % of water bodies of rivers and coastal waters and 33 % of water bodies in lakes and transitional waters, whereas significant pressure on 22 % of surface water bodies is due to wastewater and industrial effluents. Figure 4 shows the proportion of water bodies affected by pollution pressures for river and lakes (left) and coastal and transitional waters (right).

Percentages of water bodies affected by pollution pressures, for rivers and lakes (left), and for coastal and transitional waters (right) (source: EEA 2012)
On the contrary, several human modifications mainly on the surface water bodies (such as interbasin transfer, canalization, dams, weirs, reservoirs, bank reinforcements, flood projection works etc.) have changed the hydromorphology of surface water bodies with significant consequences on the aquatic ecosystems.
As known, the objectives in the WFD stipulate that good status in all waters must be achieved by 2015.
Significant hydromorphological pressures are observed for 40 % of water bodies of rivers, 33 % for lakes and 40 % for transitional waters. Figure 5 shows the proportion of water bodies affected by hydromorphological pressures for rivers and lakes (left), and coastal and transitional waters (right).

Percentages of water bodies affected by hydromorphological pressures for rivers and lakes (left) and for coastal and transitional waters (right) (source: EEA 2012)
As far the ecological status of European water bodies is concerned, it can be argued, based on the data gathered in WISE, that more than half of the surface water bodies hold less than good ecological status or potential. Water bodies of rivers and transitional waters are having more pressures than lake and coastal water bodies. Figure 6 presents the proportion of water bodies with less than good ecological status or potential, for rivers and lakes (left) and coastal and transitional waters (right).

Proportion of water bodies holding less than good ecological status or potential, for rivers and lakes (left), and for coastal and transitional waters (right) (source: EEA 2012)
The reports on water scarcity (and in particular droughts) concluded (ETC/ICM 2012; Tsakiris 2013):
-
a)
Several regions of Europe apart from the Mediterranean are periodically or permanently suffering from water scarcity problems. Figure 7 is presented based on data assessed through the WFD RBMPs (Schmidt & Benitez 2012).
Fig. 7 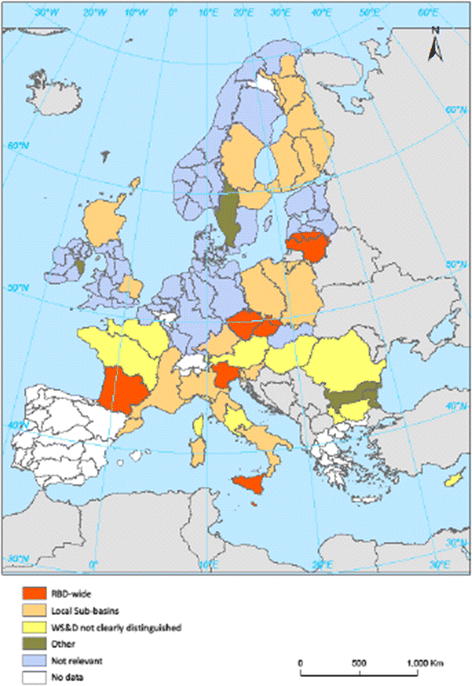
Occurrence of drought as identified in WFD RBMPs (source: Schmidt & Benitez 2012)
-
b)
Enhanced institutional capacity is required by the member states to implement “rules” to all involved (mainly users) with water resources with emphasis on the droughts periods.
-
c)
Since the actions of the “demands” side seem more appropriate and in line with climate adaptation measures, the major priority is to reinforce public participation and awareness through a systemically organized way.
-
d)
More efforts need to be made for effectively applying the “total risk” methodologies accounting for all interacting factors which influence the water balance and the health of the ecosystems.
-
e)
Efforts are needed to fully exploit the process of risk estimation and prioritization of actions based on the study of the elements of each system and sub-system exposed to water scarcity hazards.
-
f)
Finally, Preparedness and Contingency plans should be devised for all drought-prone RBDs.

Following the DPSIR methodology, the RBDs with identified abstraction as a significant pressure have been presented in recent WFD assessments. Figure 8 shows the percentage of water bodies that are reported as being subject to water abstraction (significant pressure) from surface water bodies (left) and groundwater bodies (right) (Source: WISE-WFD version June 2012).

Maps demonstrating the percentage of surface water bodies (left) and groundwater bodies (right) within each RBD that have identified abstraction as a significant pressure in the WFD implementation assessment (Source: WISE-WFD June 2012)
7 Discussion
According to the Commission Staff Working Document (EC 2012a), the status and pressure assessments of the European waters revealed that the achieved results so far are far from meeting the environmental objectives of the WED expected in 2015. The percentage of surface water bodies with at least good quality is expected to be 53 % in comparison with the 43 % which is the percentage characterising the surface water bodies holding good ecological status in 2009.
It is interesting to note that a large number of exemptions were given to member states for extending the first deadline (2015) for meeting the objectives to further deadlines (2021 or 2027) based on reasons such as technical inability, disproportionate expenses or natural barriers for timely improvement.
This “modest” improvement of the European waters during the first round of WFD implementation may be explained by a number of reasons the most common of which are:
-
(i)
The WFD is without any doubt a very ambitious directive with a large number of studies and actions which needed time to be implemented by the member states. In order to establish common implementation procedures a large number of documents had to be compiled (Guidance Documents for Common Implementation Strategy).
-
(ii)
For implementing the WFD, a large number of data were required. It was observed that in most member states there was a remarkable lack of these data. However, extensive monitoring systems have been established for this purpose in a large number of RBDS.
-
(iii)
Deficient coordination of water policies to other policy areas was observed limiting the effect of actions of water policies. It is of great importance for the future to enhance the integration of water policies with other policies such as the Common Agricultural Policy, the Cohesion and Structural Funds and the Policies on Renewable Energy and Transport.
-
(iv)
Unfortunately, for acquiring water quality data, models tailored according to the requirements of the EU water policies were needed. Although water quality models pre-existed to the implementation of the WFD, these models were not adequate to give the replies required by the WFD (Benedini & Tsakiris 2013).
-
(v)
Apart from the pollution pressure which was addressed in most RBMPs, the hydromorphological pressures (degraded morphology or changed flow path) also affect the ecological status of waters, since they do not achieve their full potential as habitats for wildlife. These pressures, although mentioned in RBMPs, were not addressed to a large extent mainly due to the substantial engineering works required and the high cost involved. The most “popular” measure to improve flow regime is to set minimum flow requirements and environmental flow standards which appear in about 50 % of the RBMPs (Kristensen et al. 2013).
-
(vi)
It can be observed that during the first round of WFD implementation the emphasis was given mainly to the pressures and states. Needless to say that more effort should be given in the new round of implementation to quantify impacts and devise response actions.
-
(vii)
The flood directive has not yet produced effective Programmes of Measures, since despite the progress made, there are still obstacles for producing hazard and risk maps for several flood-prone areas. The progress of implementation of the flood directive varies from country to country. More delays are encountered in the new member states.
-
(viii)
The water scarcity issues and mainly those caused by droughts are not yet adequately addressed. Particularly, issues of climate change and other socioeconomic changes (related also to other hazards) are not yet systematically studied.
8 Conclusions
EU policies, implemented through a number of directives, provide a very ambitious initiative of the European Union to improve the quality of its waters and protect them from various drivers such as pollution, floods, water scarcity, and hydromorphological changes. At present, a huge amount of information has been collected in a systematic way using a common information platform, the WISE, and extensive monitoring systems have been established in most RBDs and RBMPs for almost all the water districts of the EU territory.
The environmental objectives of the major water directive, the WFD, seem not to be met at the expected level. The same applies to the legislation and its implementation in the area of floods and droughts. In particular, the Programmes of Measures envisaged in the Flood directive are either incomplete or not devised for many flood-prone areas.
During the new round of the implementation of WFD and its daughter directives (2015–2021), it is expected that more effective steps towards the fulfilment of the environmental objectives of EU water policies will be achieved. During this round, more effective coordination between directives and between policies is required. New issues such as ‘nonstationarity’ of water related variables, due to man-induced and climatic change causes, should be more systematically addressed. Also, water trading, population mobility and socioeconomic changes should be incorporated in the BMPs of the new round of implemantation.
References
Alexakis D, Kagalou I, Tsakiris G (2013) Assessment of pressures and impacts on surface water bodies of the Mediterranean. Case study: Pamvotis lake. Greece Environ Earth Sci 70(2):687–698
Alexakis D., Tsihrintzis A., Tsakiris G., Gikas G. (2015) Evaluation of water quality indices for lakes in the Mediterranean. Proceedings of the 9th World Congress of the European Water Resources Association, Istanbul, 10–13 June 2015
Aulong S, Bouzit M, Dörfliger N (2009) Cost-effectiveness analysis of water management measures in two river basins of Jordan and Lebanon. Water Resour Manag 23:731–753
Benedini M, Tsakiris G (2013) Water quality modelling for rivers and streams. Springer, Dordrecht
Berbel J, Martin-Ortega J, Mesa P (2011) A cost effectiveness analysis of water saving measures for the WFD: the case of the Guadalquivir river basin in Southern Spain. Water Resour Manag 25:623–640
European Council (2007) EU Directive of the European Parliament and of the European Council on the estimation and management of flood risks (2007/60/EU).
DEFRA (2007) Preliminary cost effectiveness analysis of the Water Framework Directive. Revised after stakeholder review (Available at http://www.wfdcrp.co.uk)
EC (2003) Economics and the environment: the implementation challenge of the Water Framework Directive. A guidance document (WATECO), Brussels.
EC (2007) Communication from the Commission to the European Parliament and the Council addressing the challenge of water scarcity and droughts in the European Union. Commission of the European Communities (http://eur-lex.europa.eu/LexUriServ/LexUriserv.do?
EC (2012a) Commission Staff Working Document, European overview accompanying the document report from the commission to the European Parliament and the Council on the implementation of the Water Framework Directive (2000/60/EC) River Basin Management Plans, Volumes 1 and 2. (http://ec.europa.eu/environment/water/blueprint/index_en.htm).
EC (2012b) Report from the Commission to the European Parliament and the Council on the Implementation of the Water Framework Directive (2000/60/EC) River Basin Management Plans. (http://ec.europa.eu/environment/water/blueprint/index_en.htm).
EC (2012c) Communication from the commission to the European parliament, the council, the European economic and social committee and the committee of the regions, a blueprint to safeguard Europe’s water resources (http://ec.europa.eu/environment/ water/blueprint/index_en.htm).
EEA (2011) Europe’s environment — an assessment of assessments, European Environment Agency, Copenhagen (http://www.eea.europa.eu/publications/europes-environment-aoa).
EEA (2012) European waters — assessment of status and pressures, EEA Report No 8/2012. European Environment Agency, Copenhagen, (http://www.eea.europa.eu/publications/ european-waters-assessment-2012).
ETC/ICM (2012) Vulnerability to water scarcity and drought in Europe. Thematic assessment for EEA Water 2012 Report. (http://icm.eionet.europa.eu/ETC_Reports/VulnerabilityToWaterScarcityAndDroughtInEurope)
Interwies E, Kraemer A, Kranz N, Gorlach B, Dworak T (2004) Basic principles for selecting the most cost-effective combinations of measures for inclusion in the program of measures as described in article 11 of the WFD handbook. German Federal Environmental Agency
Jacobsen J (2007) In search of cost-effective measures-Danish report on the use of cost effectiveness analysis when implementing the EU WFD. Institute of food and resource economics, report 191, Copenhagen.
Kristensen P, Solheim A, Austnes K (2013) The water framework directive and state of Europe’s water. Proceedings of the 8th international conference of European water resources association, Porto, 26–29 June 2013, 39–47
Martin-Ortega J (2012) Economic prescriptions and policy applications in the implementation of the WFD. Environ Sci Pol 24:83–91
Moss B, Stephen D, Alvarez C, Becares E, van de Bund W, Collings SE, van Donk E, de Eyto E, Feldmann T, Fernandez-Alaez C, Fernandez-Alaez M, Franken RJM, Garcıa-Criado F, Gross EM, Gyllstrom M, Hansson LA, Irvine K, Jarvalt A, Jensen JP, Jeppesen E, Kairesalo T, Kornijow R, Krause T, Kunnap H, Laas A, Lill E, Lorens B, Luup H, Miracle MR, Noges P, Noges T, Nykanen M, Ott I, Peczula W, Peeters ETH, Phillips G, Romo S, Russell V, Salujoe J, Scheffer M, Siewertsen K, Smal H, Tesch C, Timm H, Tuvikene L, Tonno I, Virro T, Vicente E, Wilson D (2003) The determination of ecological status in shallow lakes–a tested system (ECOFRAME) for implementation of the European Water Framework Directive. Aquat Conserv Mar Freshwa Ecosyst 13:507–549
Pistrika A, Tsakiris G, Nalbantis I (2014) Flood depth-damage functions for built environment. Environ Proc 1:553–572
Schmidt G, Benitez C (2012) Topic report on water scarcity and droughts aspects in a selection of european union river basin management plans, v.3.0., Intecsa-Inarsa SA and Typsa
Tsakiris G (2013) European developments in water resources management. Paper presented at the Dokuz Eulyl University, Izmir, 24 September 2013
Tsakiris G (2014) Flood risk assessment: concepts, modelling, applications. Nat Hazards Earth Syst Sci 14:1361–1369
Tsakiris G, Spiliotis M (2011) Planning against long term water scarcity: a fuzzy multi-criteria approach. Water Resour Manag 25:1103–1129
Tsakiris G, Nalbantis I, Pistrika A (2009) Critical technical issues on the EU flood directive. Eur Water 25(26):39–51
Tsakiris G, Nalbantis I, Vangelis H, Verbeiren B, Huysmans M, Tychon B, Jacquemin I, Canters F, Vanderhaegen S, Engelen G, Poelmans L, De Becker P, Batelaan O (2013) A system-based paradigm of drought analysis for operational management. Water Resour Manag 27:5281–5297
Tsakiris G, Spiliotis M, Vangelis H, Tsakiris P (2015) Evaluation of measures for combating water shortage based on beneficial and constraining criteria. Water Resour Manag 29:505–526
Acknowledgments
I wish to acknowledge the assistance I received from my associates at the Centre for the Assessment of Natural Hazards and Proactive Planning of the National Technical University of Athens, and in particular from the members of the Laboratory of Reclamation Works and Water Resources Management when compiling this review paper. The paper is based principally on the EU documents, the reports of the related agencies (e.g., the European Environment Agency), some pier reviewed papers on the assessment of EU directives (e.g., Kristensen et al. 2013) and previous reviews of mine on the subject (Tsakiris et al. 2009; Tsakiris 2013, 2014). A prior version of this paper was presented at the World Environmental and Water Resources Congress of ASCE/ Watershed Council Awards Luncheon at Austin-Texas on the 19th of May 2015.
Author information
Authors and Affiliations
Corresponding author
Rights and permissions
About this article

Cite this article
Tsakiris, G. The Status of the European Waters in 2015: a Review. Environ. Process. 2, 543–557 (2015). https://doi.org/10.1007/s40710-015-0079-1
Received:
Accepted:
Published:
Issue Date:
DOI: https://doi.org/10.1007/s40710-015-0079-1