
Abstract
Engagement influences participation, progression and retention in game-based e-learning (GBeL). Therefore, GBeL systems should engage the players in order to support them to maximize their learning outcomes, and provide the players with adequate feedback to maintain their motivation. Innovative engagement monitoring solutions based on players’ behaviour are needed to enable engagement monitoring in a non-disturbing way, without interrupting the game-play and game flow. Furthermore, generic metrics and automatic mechanisms for their engagement monitoring and modelling are needed. One important metric that was used for engagement modelling is TimeOnTask, which represents the duration of time required by the player to complete a task. This paper proposes ToTCompute (TimeOnTask Threshold Computation), a novel mechanism that automatically computes - in a task-dependent manner - TimeOnTask threshold values after which student engagement decreases with a given percentage from his initial level of engagement (e.g., after 2 min student engagement will fall with 10 % from his initial level). In this way the mechanism enables engagement modelling at a higher granularity and further enables engagement-based adaptation in GBeL systems. ToTCompute makes use of game-playing information and EEG signals collected through an initial testing session. The results of an experimental case study have shown that ToTCompute can be used to automatically compute threshold values for the TimeOnTask generic engagement metric, which explains up to 76.2 % of the variance in engagement change. Furthermore, the results confirmed the usefulness of the mechanism as the TimeOnTask threshold value is highly task-dependent, and setting its value manually for multiple game tasks would be a laborious process.
Introduction
An important motivation indicator is engagement that represents learner’s psychological investment in learning, the effort directed towards learning, understanding or mastery of the knowledge, and the willingness, need, desire and compulsion to participate and be successful in the learning process (Saeed and Zyngier 2012). Therefore, game-based e-learning (GBeL) systems should be able to engage the players in order to support them to maximise their learning outcomes. Moreover, GBeL systems should integrate engagement modelling and monitoring in order to provide the player with adequate feedback and to personalise the game-play experience so to maintain the player engaged for the duration of the game-play.
There are two main approaches that could be used for monitoring player’s engagement: disturbing and non-disturbing (Ghergulescu 2013; Yearsley and Pothos 2014). The first approach uses questionnaires and requires the player to fill in questionnaire while playing the game (for example after each individual game task). However, interrupting the game with questionnaires can negatively impact on the player’s game-playing experience, their engagement and eventually their learning outcomes (Cowley et al. 2008). Therefore, engagement monitoring should be performed in a non-disturbing way, without interrupting the game-play. Non-disturbing methods make use of game-play interaction monitoring and log information about the player’s behaviour, and may use additional equipment (e.g., EEG, eye-tracking). Various metrics for engagement monitoring have been proposed in the e-learning area, with the most common being time-related metrics (Arroyo et al. 2010; Bica et al. 2006; Cocea and Weibelzahl 2009, 2011; Ghergulescu and Muntean 2012a, 2012b; Johns and Woolf 2006). However, most metrics present a number of drawbacks such as being learning material and system dependent, as well as being difficult to use for engagement modelling without defining specific threshold values for the metrics’ interpretation.
This paper addresses the challenges mentioned above by proposing a novel solution for modelling and monitoring the player’s engagement that makes use of the TimeOnTask generic engagement metric and electroencephalography (EEG). TimeOnTask represents one of the most important metrics in education for over 50 years, since being indicated as a key factor contributing to student learning outcomes in Carroll’s model of school learning (Carroll 1963, 1989). From an engagement modelling point of view, TimeOnTask is interpreted based on predefined threshold values that indicate how much time a player may require to complete different game tasks. Spending too much time on a task without sufficient progression, may decrease the player engagement and brake the game-flow (Gilleade and Dix 2004). However, manually setting the threshold values for multiple tasks within a game is a time consuming and laborious process that requires good knowledge of the particular game. To the best of our knowledge, no automatic solution for threshold values computation has been previously proposed.
Therefore, this paper proposes a novel TimeOnTask Threshold Computation (ToTCompute) mechanism that automatically computes task-dependent threshold values of the TimeOnTask metric for different relative engagement changes. A relative engagement change represents a change in the player’s engagement expressed as the percentage of its engagement at an initial (i.e., reference) moment (e.g., 5, 10, 15 %). The threshold values represent upper limits above which the player’s engagement decreases with a specific relative engagement change. ToTCompute enables engagement modelling at a higher granularity and makes use of game-playing information and EEG signals collected through an initial testing session (see ToTCompute Overview section for more details). This paper builds on our previous research (Ghergulescu and Muntean 2014a) that demonstrated the feasibility of using EEG-based engagement signals in order to measure the player’s motivation, when compared to traditional motivation assessment questionnaires. The research showed that the traditional questionnaire-based methodology is limited to analysing the motivation on short game-playing durations, while losing its feasibility when analysing the overall motivation over a long game-playing duration (Ghergulescu and Muntean 2014a).
The results of an experimental case study show that the proposed ToTCompute mechanism can be used to automatically compute threshold values for the TimeOnTask generic engagement metric, with regression analysis indicating that TimeOnTask explains up to 76.2 % of the variance in engagement change. Furthermore, the results confirmed the usefulness of the mechanism as the TimeOnTask threshold value is highly task-dependent, and setting its value manually for multiple game tasks would be a laborious process.
The following distinction between engagement modelling and monitoring is made in the context of this paper. Engagement modelling refers to the process of applying ToTCompute to automatically build an engagement model for a certain game. This model consists of task-dependent TimeOnTask threshold values after which player’s engagement decreases with a given percentage from his initial level of engagement (e.g., after 2 min student engagement will fall with 10 % from his initial level). As an additional contribution, this research paper specifies how engagement decrease levels can be modelled based on the relative engagement changes and the corresponding TimeOnTask threshold values for different game tasks. Engagement monitoring refers to the process of applying the engagement model in real-world scenarios. Based on player’s engagement decrease levels certain game adaptation strategies may be applied such as feedback, reward, challenge and/or autonomy (e.g., if the player’s engagement decreases by 10 % feedback adaptation is applied to avoid user’s decrease in engagement).
The rest of the paper is structured as follows. Section 2 presents previous research work in the areas of motivation and engagement monitoring, and electroencephalography (EEG). Section 3 details the principle of the proposed ToTCompute mechanism, and section 4 presents the setup and the results of the evaluation case study. Section 5 discusses the outcome of the study and the applicability of the proposed solution within adaptive game-based e-learning systems, whereas section 6 concludes the paper.
Literature Review
This section presents the literature review on the two main areas related to this research work: motivation and engagement monitoring on one side, and electroencephalography (EEG) on the other side. The literature review was conducted from a game-based e-learning perspective, being focused on methods of gathering information for engagement and motivation monitoring and modeling in general, and engagement and motivation detection using EEG in particular.
Engagement and Motivation Monitoring
Motivation represents a psychological attribute described as the energy to achieve a goal, to initiate and to sustain participation (Bandura 1994; Ryan and Deci 2000b). In the learning context, motivation is referred to as the energy to accomplish the goal of knowledge achievement, to initiate, and to maintain participation in the learning process (Zimmerman et al. 1992). Motivation plays a significant role in the success of the learning process in general and of the game-based e-learning in particular (Ghergulescu and Muntean 2014b). At the same time, motivation is a driving agent behind both participation and progression in gaming environments (Konetes 2010).
Engagement represents learner’s psychological investment in and effort directed towards learning, understanding or mastery of the knowledge and the willingness, need, desire and compulsion to participate in, and be successful in the learning process (Saeed and Zyngier 2012). A direct link between motivation and engagement exists; the more motivated a person is the more engaged he/she is (Saeed and Zyngier 2012). Engagement is also seen as an important motivation indicator (Ryan and Deci 2000a; Vansteenkiste et al. 2006). Given the direct connection between the two concepts and the lack of clear consensus among researchers, motivation modelling and monitoring often overlap with engagement modelling and monitoring in the e-learning area (Boulay 2015). Therefore, the literature review will present related works on both engagement and motivation modelling and monitoring. Information on player’s engagement and motivation can be gathered using different methods that can be divided in two main categories: disturbing and non-disturbing (Ghergulescu 2013; Yearsley and Pothos 2014).
Disturbing Methods
Disturbing methods are methods that require the interruption of the game-play. These are mainly dialog-based interaction methods, which consist of presenting different questions to the player and asking them for a response, a rating or a self-report about their motivation or engagement state and beliefs. Dialog-based interaction methods have the main benefits of being well defined and the information collected can be easily assessed. Examples of well-known methods include:
-
Instructional Materials Motivational Survey (IMMS) (Keller 1987) based on the ARCS model (Keller 1987), and used in research studies such as (Huang et al. 2010, 2014; Liu and Chu 2010; Woo 2014);
-
Intrinsic Motivation Inventory (IMI) (IMI 2008) based on the self-determination theory (Ryan and Deci 2000b), and used in research studies such as (Eseryel et al. 2014; Farrell and Moffat 2014; Liu et al. 2011; Vos et al. 2011);
-
Self-efficacy Scale (Bandura 2006), used in research studies such as (Eseryel et al. 2014; McQuiggan et al. 2007; Meluso et al. 2012).
While most of the research studies use one or more of these well-known scales, other researchers used different instruments or scales. For example, Tüzün et al. have used a scale for measuring both the intrinsic and extrinsic motivation with subscales along three dimensions: preference for challenge, curiosity, and independent mastery (Tüzün et al. 2009). Miller et al. analysed the impact of a multimedia science game on student’s motivation to pursue a science career using a custom scale with five specific questions (Miller et al. 2011). Chen and Chan (2008) developed a motivation measuring instrument on four dimensions (i.e., attention, relevance, enjoyment, and challenge), which was used with a game for learning Chinese idioms. Bernard and Cannon (2011) used a 5-item emoticon-anchored scale ranging from ‘highly unmotivated’ to ‘highly motivated’, for measuring students’ motivation during a classroom study with a management retail simulation game. Most of the research studies assess the player’s motivation only at the end of the educational game (Miller et al. 2011; Tüzün et al. 2009), or both at the beginning and at the end of the game (Eseryel et al. 2014; Kebritchi et al. 2010; Vos et al. 2011).
The primary drawback of dialog-based assessment methods is that they interrupt the player and game-play. Moreover, these methods do not capture changes in the player’s motivation during the game-play. In order to overcome these drawbacks, Ghergulescu and Muntean (2010a) have proposed to integrate dialog-based motivation assessment within the game-playing process. In particular the authors proposed to measure player’s self-efficacy, by embedding a questionnaire item in the player’s conversations with non-player characters. However, this method cannot be used in games were the introduction of a non-player character is not feasible (Ghergulescu et al. 2014). Another limitation of dialog-based interaction methods is that they measure the perceived motivation as reported by the students, which can be a biased measure of the actual student motivation (e.g., what they say is not what they actually do).
Non-Disturbing Methods
Non-disturbing methods are automatic methods that do not rely on direct user self-report. The main strength of these methods is the fact that game-play and game-flow are not interrupted. The non-disturbing methods are mainly based on analysing the game-play interaction or on using additional equipment to measure user physiological reaction and behaviour cues. Game-play-based interaction methods consist of monitoring and logging information about player’s behaviour while playing the game. This is performed automatically, without interrupting the player, by logging player’s actions and activity in the game or by embedding a monitoring mechanism in the game. Gathering information through game-play interaction is a non-disturbing method that does not interrupt the game-flow. Using these methods is more challenging as compared to dialog-based methods, because of the diversity and multitude of data that can be collected, as well as the difficulty to analyse the data. The metric interpretation (i.e., assessment of collected data) is the most challenging part, as it requires clear assessment rules on how to interpret the metric values and map them to player’s motivation.
Significant research work was conducted on defining motivation measurement metrics as well as on defining assessment rules for these metrics in the e-learning area (Arroyo et al. 2010; Cocea and Weibelzahl 2011; Munoz-Organero et al. 2010), and game-based e-learning in particular (Ghergulescu and Muntean 2011; Mattheiss et al. 2010). The motivation measurement metrics that were previously proposed in the e-learning area can be grouped into three main categories: time-related metrics, task repetition-related metrics, and additional support-related metrics (Ghergulescu and Muntean 2012a). Examples of time-related metrics are: time spent on reading a page, time spent on solving a problem, time spent on solving an exercise, time spent on tests and time spent on quizzes. Examples of task repetition-related metrics include: number of times a page is read, number of times doing an exercise, number of times doing a test, and number of times watching a video. Examples of additional support-related metrics are number of help requests, and number of hint requests. More information and details on motivation measurement and assessment can be found in (Ghergulescu and Muntean 2012a, 2012b).
Generic metrics were proposed for each category type: TimeOnTask, NumRepeatTask and NumHelpRequest (Ghergulescu and Muntean 2012b). The three generic metrics enable player’s motivation monitoring in a way independent of the game. The TimeOnTask metric is defined as the duration of time required by the player to complete a task. The NumRepeatTask metric accounts for how many times a player repeats a particular task. The NumHelpRequest metric represents the number of times the player asks for help or a hint. In order to use the generic motivation metrics, the game creator or researcher would have to identify clear and independent tasks within the game, for which the metrics can be computed. For example, game events could be used in order to determine when a particular task starts and when this is completed by the player.
Additional equipment (e.g., eye tracker, EEG, heart monitor) may be used in order to get information on player’s physiological reaction and behaviour cues (e.g., electrophysiological (EEG) data, heart rate, galvanic skin response). While this approach may be more invasive as compared to game-play-based interaction methods, it is less disturbing as compared to dialog-based methods. Limitations of these methods that need to be considered are the additional cost of the equipment, and the difficulty to incorporate the equipment within every day game-based e-learning scenarios.
Since the proposed ToTCompute mechanism is computing the TimeOnTask threshold values based on EEG data, the following section provides more details about EEG in general, and EEG-based engagement and motivation detection in particular.
Electroencephalography
Electroencephalography (EEG) represents the process of “recording of electrical brain activity from the human scalp” (Harmon-Jones and Amodio 2012, p. 503). The result of the recording called electroencephalogram is defined as “electrical activity of an alternating type recorded from the scalp surface after being picked up by metal electrodes and conductive media” (Teplan 2002, p. 1). The EEG signal is composed of multiple individual oscillations at different frequencies, which were grouped into five frequency bands or brain waves: delta, theta, alpha, beta, and gamma. While oscillations for all these waves may be present in the overall EEG signal at the same time, one or another is usually dominant during certain states of awareness or different activities.
Delta waves are EEG oscillations of low frequency within 0.5 and 4 Hz, that are the dominant activity in infants up to 2 years of age, and are associated with deep dreamless sleep, unconscious states such as during anaesthesia, or as a result of brain trauma or damage such as tumours (Pizzagalli 2007). Theta waves are EEG oscillations between 4 and 8 Hz. Theta waves that show widespread distribution have been associated with states of decreased awareness such as drowsiness or drifting down into sleep and dreams. Theta waves localised in the frontal region during wakefulness have been associated with attention, mental effort, and effective stimulus processing, as well as memory and emotional regulation (Knyazev 2007; Pizzagalli 2007). Alpha waves are EEG oscillations between 8 and 13 Hz, which increase during wakefulness states such as relaxation, meditation, daydreaming, or when closing the eyes, and can greatly decrease by sudden alerting or eyes opening as well as when the alertness decreases to drowsiness levels (Pizzagalli 2007). While there is much confusion and many question marks surrounding the role of the alpha waves, various research studies have indicated that they may play an important role in operations such as visual input regulation (Romei et al. 2010), memory and transfer of information between long-term and short-term memory (Sauseng et al. 2002), as well as attention and motivation during cognitive activities (Coan and Allen 2004; Cooper et al. 2003; Hanslmayr et al. 2011; Knyazev 2007; Palva and Palva 2007). Beta waves are EEG oscillations between 13 and 30 Hz, that have higher intensity while engaged in activities and conversations, and were associated with sensori-motoric brain operations (Gourab and Schmit 2010; Lalo et al. 2007; Pogosyan et al. 2009), as well as active, concentrated or anxious cognitive activities (Baumeister et al. 2008; Putman 2011; Wang et al. 2012). Gamma waves are high frequency EEG oscillations above 30 Hz, associated with increased neuronal activation, such as focused attention, higher memory load, arousal and mental process, including learning and perception (Hughes 2008; Pizzagalli 2007; van Vugt et al. 2010).
During EEG signals recording, the electrodes are usually positioned on the scalp following the international 10–20 system recommended by the International Federation of Societies for EEG and Clinical Neurophysiology (American Electroencephalographic American Electroencephalographic Society 1994). In the international 10–20 system the electrode names consist of one or two letters and a number, with the exception of the electrodes placed on the central axis of the skull between the Nasio (Nz) and Inion (Iz) reference points. The electrodes on the left side of the head are indicated using odd numbers, while the electrodes on the right side are indicated using even numbers. The letters are derived from the names of the brain lobes or anatomical landscape (i.e., A - Ear lobe, C –central, Pg = nasopharyngeal, P - parietal, F - frontal, Fp - frontal polar, O - occipital).
As player’s engagement represents an important motivation indicator, and the research presented in this paper makes use of the player’s engagement detected using EEG, related work on both engagement and motivation detection using EEG are presented in the subsection ‘Engagement and Motivation Detection using EEG’.
EEG Equipment
Various EEG hardware-software equipment has been produced recently. The EEG equipment can be divided in two main categories: traditional EEG equipment and consumer-grade EEG equipment. The traditional EEG equipment (e.g., equipment produced by BioSemi,Footnote 1 Neuroscan,Footnote 2 Brain Products,Footnote 3 Electrical GeodesicsFootnote 4) provide high accuracy and various useful features, but they are usually very expensive with complete solutions including sensors, amplifiers and software, having a total price of over ten thousand Euros. Apart from the prohibitive price, another disadvantage may be their intrusiveness as the participants are usually required to wear caps with tens of wet sensors which are connected through wires to the signal amplifier and recording equipment. More recently a number of consumer-grade EEG equipment (e.g., NeuroSky, Emotiv EPOC) have started to be commercialised. While these present a number of limitations such as less sensors and features, their affordable price and reduced intrusiveness draw the attention of an increasing number of researchers.
The NeuroSky system (Luo and Sullivan 2010; Yasui 2009) is a wireless computer interface that records EEG signal from one dry sensor. NeuroSkyFootnote 5 provides measures such as RAW EEG signal, EEG power spectrum (alpha, beta, etc.), as well as proprietary measures such as attention and meditation. The usability of NeuroSky MindSet to detect attention level in an assessment exercise was assessed in an evaluation study (Rebolledo-Mendez et al. 2009). The results suggested that NeuroSky provides accurate readings regarding attention as there was found a positive correlation between measures and self-reported attention levels. Furthermore, different research studies have evaluated NeuroSky and showed that the headset can be used to measure meditation (Crowley et al. 2010), or cognitive load (Haapalainen et al. 2010). NeuroSky attention signals were also used in order to adapt the games. Patsis et al. (2013) have used the attention level detected by NeuroSky to adapt the level of challenge to the player’s abilities in a Tetris game. The Beta wave detected by NeuroSky was used in a game that simulated a car drive with numerous distractions designed in order to improve and teach the user to avoid certain distractions (Cheng et al. 2014).
The Emotiv EPOCFootnote 6 system is a wireless brain computer interface device that records EEG signals through 14 electrodes and has two additional sensors that serve as CMS/DRL reference channels (see Fig. 1). The channels are located according to the international 10–20 system location. Additionally, the Emotiv EPOC SDK provides a set of libraries that permit expression detection (Expressiv Suite), real-time detection of the emotional state experienced by the user in terms of engagement, instantaneous excitement, long term excitement, frustration, meditation (Affectiv Suite), brain controlled actions (Cognitiv Suite), as well as EEG logging and processing (with the help of TestBench software).

Sensor locations on Emotiv headset
The research studies that have used the Emotiv EPOC can be grouped in:
-
usage of the Emotiv EPOC headset as a remote control for smartphone, tractor or robot arm (Gomez-Gil et al. 2011; Petersen et al. 2011);
-
further development of the EEG signal processing and analysis methods (O’Regan et al. 2010);
-
further development of emotion detection (Anderson et al. 2011; Petersen et al. 2011);
-
educational related studies that used the engagement, frustration, excitement and meditation measures provided by the Emotiv EPOC Affectiv Suite (Gonzalez-Sanchez et al. 2011; Inventado et al. 2011).
The emotions provided by the Emotiv EPOC Affectiv Suite have been validated using questionnaires by third-party researchers, that have shown that Emotiv EPOC is capable to accurately detect emotions (Cernea et al. 2011, 2012; Kuber and Wright 2013). Another study (Goldberg et al. 2011), evaluated the effectiveness of the Emotiv EPOC using various scenarios and self-report measures of engagement. The results have shown that Emotiv EPOC provides reliable measures of engagement and excitement. Moreover, other research studies showed that the raw signals recorded with Emotiv EPOC can be used for assessing engagement (McMahan et al. 2015a), as well as to differentiate between varying stimulus modalities and accompanying cognitive processes (McMahan et al. 2015b).
Stamps and Hamam (2010) rated the usefulness for research of low-cost EEG equipment on a 1 to 10 scale by comparing them in terms of features such as: number of EEG channels available, ADC (analogue to digital converter) resolution, support for multiple neurological mechanisms, ADC and CMRR (common-mode rejection ratio) hardware design flexibility, sample rate flexibility above 128 KHz, embedded system inerrability, commercial reducibility, ease of electrode placement by the user, portability, and support for dry or hydrated electrodes. Based on this feature set, the authors concluded that Emotiv EPOC has the highest usefulness for researchers. Therefore, Emotiv EPOC was chosen for the case study presented in this paper.
Engagement and Motivation Detection using EEG
Various research studies have explored the possibility of using EEG for detecting engagement levels and/or differentiating engagement from other emotions (Chanel et al. 2011; Kamiński et al. 2012; Mampusti et al. 2011). Engagement was detected in different testing scenarios: during game-playing (Chanel et al. 2008, 2011), during an e-learning course (Shen et al. 2009), while performing various tasks (Mampusti et al. 2011; Prinzel et al. 2000), while presented with auditory and visual stimuli (Kamiński et al. 2012), or while watching videos (Belle et al. 2011).
Analysing the studies that have investigated emotion detection, one can note that the majority of them have preferred to increase the number of stimuli per participant (e.g., images and videos viewed by a participant), instead of a higher number of participants. This approach may influence the performance results, showing a higher detection performance across users because of the low number of participants. Two main approaches are used for detecting user engagement: direct computation and data mining. Direct computation quantifies engagement as a function of the user brain waves. Data mining quantifies engagement using classifiers, statistical methods, or clustering procedures.
Engagement computed as the beta wave divided to the sum of alpha and theta waves is the most common function used and has shown to reflect best engagement (Pope et al. 1995; Prinzel et al. 2000). In (Mampusti et al. 2011), engagement was detected through statistical features of the EEG signals, namely: mean and standard deviation of the signal, mean of absolute first and second differences, and standardized mean of absolute first and second differences. Support vector machines (SVM), multi-layer perceptron (MLP) and k-nearest neighbours (kNN) classifiers were used, with the classification accuracy being 54.09, 46.86 and 40.72 % respectively. SVM was also used to assess EEG signals and engagement in (Belle et al. 2011). The analysis was done in the time-frequency domain, by extracting the 5 bands (delta, theta, alpha, beta, and gamma) using Discrete Wavelet Transform (DWT). The overall classification accuracy was 86.86 %.
Several studies have analysed multiple electrodes or pairs of electrodes in order to assess which electrodes or pairs offer better motivation recognition. For example, pairs of electrodes such as F3-F4, F7-F8, C4-C3, T4-T3, and P4-P3 have been taken into consideration in order to study which pair enables a better detection of the motivation using the alpha asymmetry measure (the difference between the right and left side in the alpha band). The majority of research on motivation detection using EEG has primarily focused on approach motivation and frontal alpha asymmetry (FAA). Approach motivation is conceptualised as the energy that directs the behaviour towards approaching and starting an activity or continuing an activity. Approach motivation is related to the task engagement conceptualised as the effortful striving to reach a desired goal (Fairclough et al. 2013). A direct relationship between approach motivation and FAA was found by various researchers. The main conclusion was that higher values of FAA correspond to higher right than left alpha power. This further corresponds to higher brain activity in the left than in the right frontal region of the brain, corresponding to increased approach motivation. However, only the alpha asymmetry computed at F3-F4 and F7-F8 electrode pairs has correlated with approach motivation given by the BAS scale (Coan and Allen 2003; Fairclough and Roberts 2011). So far, no study has presented a general method for quantifying the approach motivation on different levels (i.e., FAA range values for motivation levels).
Derbali and Frasson (2010) have studied the detection of attention, a motivation indicator during educational games using linear regression. The authors observed that the alpha wave decreased, the theta wave increased and the motivation decreased during the game-playing. The model given by linear regression had a prediction accuracy of 73.6 %. Kleih et al. (2010) have investigated the relation between motivation and the P300 metric of brain response to a stimulus event. The participants had to perform a spelling words task. They were divided in three groups (low monetary reward, high monetary reward, and no monetary reward). The results have shown a positive correlation between self-reported motivation and P300 amplitude at Cz electrode, and that motivation can be significantly predicted by P300.
Engagement Modelling and Monitoring using Timeontask Generic Metric
This section presents the proposed solution for modelling the player engagement based on the generic TimeOnTask metric. This is done by mapping the relative change of player’s engagement to TimeOnTask threshold. The section describes the generic TimeOnTask metric and the novel ToTCompute mechanism that can be used in order to automatically compute task-dependent threshold value of the TimeOnTask metric for different relative engagement changes.
Generic TimeOnTask Metric
The generic TimeOnTask metric (Carroll 1963, 1989) represents the duration of time required by the player to complete a task. Since the player may repeat a particular task multiple times during the game, at a task level the TimeOnTask metric is computed as the duration of time required by the player to successfully complete the task for the first time. Once a mandatory task is completed successfully it is the player’s option if he/she repeats it or not. For the entire game or for a game level the TimeOnTask metric represents the duration of time required by the player to complete the game or to complete the particular game level respectively.
TimeOnTask is a generic metric as its measurement does not depend on a particular game-based e-learning system or on a particular game-playing action. TimeOnTask is interpreted based on predefined task-dependent threshold values. The generic TimeOnTask metric can be used to assess the relative changes in engagement. For a given task t x and a particular relative engagement change ΔE (e.g., 5, 10, 15 %), an upper threshold value \( T{h}_{t_x,\varDelta E} \) can be defined. As presented in Eq. (1), if a student takes longer than the threshold value, his engagement is considered to decrease with ΔE.
Multiple TimeOnTask threshold values \( T{h}_{t_x,\varDelta E} \) can be computed for different predefined ΔE relative engagement changes in order to increase the engagement monitoring granularity. Depending on the chosen granularity the TimeOnTask generic metric can be computed for the entire game, for a game level or for each individual game task. When the value of the metric reaches or passes above a certain threshold an event specific to the particular metric and the particular ΔE relative engagement change could be generated or an adaptation strategy could be triggered (Ghergulescu and Muntean 2010b). An exemplification of the predefined ΔE values and the corresponding TimeOnTask threshold values for a single game task is provided in Table 1.
Since different games, game levels or game tasks have different characteristics, for the same player the TimeOnTask metric will take different values across different games, as well as across different game levels or tasks. Furthermore, different players could have different engagement for the same task and thus the metric will have different values across participants. Therefore, the threshold values for the generic engagement metric indicating upper limits above which the engagement decreases with a specific relative value, vary from task to task, and they need to be set accordingly.
One approach indicated by the literature review is that the game developer sets the threshold values, or an expert provides threshold values for the metric (Bica et al. 2006; Johns and Woolf 2006). The threshold values are then further used for engagement assessment or game adaptation. This approach however, requires a good knowledge of the game (something an expert might not have), as well as of the relationship between player’s behaviour and their engagement (something the game creator might not have). Furthermore, manually setting the threshold values for multiple tasks within a game is a time consuming and laborious process. Therefore, this paper presents an automatic solution for computing task-dependent threshold values for the TimeOnTask metric.
ToTCompute: An Automatic Mechanism for TimeOnTask Threshold Value Computation
Overview
ToTCompute is a mechanism that enables the game creator to automatically compute TimeOnTask threshold values for various game tasks. The prerequisites of the ToTCompute mechanism require the game creator to conduct an initial testing session for collecting game-playing and engagement data while the players wear the Emotiv EPOC headset. The initial testing session, would be similar to beta testing that are commonly conducted during the game development process (Davis et al. 2005; Gold and Wolfe 2012). In advance of the testing session, the game creator will have to identify independent game tasks for which TimeOnTask threshold values should be computed. During the initial testing session, a group of participants will be required to play the game. Since the threshold values are computed based on the player’s relative engagement change, a number of at least 30 participants (Sneed 2006) should be sufficient.
We operationalise the physiological engagement term by the engagement measure provided by the Affectiv Suite of the Emotiv EPOC headset. The Emotiv EPOC Affectiv Suite was validated by different research studies that have shown that the Emotiv EPOC headset can be used to accurately detect and monitor engagement (Cernea et al. 2011, 2012; Goldberg et al. 2011; Kuber and Wright 2013; McMahan et al. 2015a). Therefore, the engagement related data is used by the ToTCompute mechanism in order to automatically compute the TimeOnTask threshold values for different game tasks. The block-level representation of the proposed solution for engagement modelling based on the TimeOnTask generic engagement metric is illustrated in Fig. 2.

Block-level representation of proposed solution for engagement modelling based on TimeOnTask generic engagement metric
During the game-play testing session, the participants’ engagement levels are continuously extracted by the Emotiv EPOC Affectiv Suite’s EmoEngine based on EEG signal data recorded with the Emotiv EPOC headset. The participants’ engagement can be visualised in real-time in the Control Panel software provided by Emotiv, and also it can be retrieved for further processing through the Emotiv API (i.e., part of the SDK provided with the Emotiv EPOC headset). The Engagement Logger retrieves the engagement values through the Emotiv API, and saves them into log files (Engagement Logs Database).
At the same time, information with regard to participants’ game-playing behaviour such as timestamp of the starting and ending moment of a task is logged by the Game-Playing Logger and saved in the Game-Playing Events Database. The Game-Playing Logger is integrated with the game engine in order to monitor and record information regarding players’ actions during the game-play and other events within the game (e.g., game event name, start and stop timestamps). This information is used in order to determine the TimeOnTask timeline for the individual game tasks.
The Relative Engagement Change Computation is applied after the testing session has finished. It takes as input the information collected from multiple participants and stored in the Engagement Logs Database, and the Game-Playing Events Database, and computes the participants’ relative engagement change for the TimeOnTask timeline. Participants’ relative engagement changes are computed for each second over the TimeOnTask timeline, being approximately equal with the granularity at which the Emotiv EPOC Affectiv Suite provides the engagement values. This is necessary in order to verify if participants’ engagement decreases over the TimeOnTask timeline, and thus to compute threshold values above which the engagement decreases with specific relative value starting from a reference moment. ToTCompute provides a solution to automatically compute task-dependent threshold values for the TimeOnTask generic engagement metric, above which the player’s engagement decreases by a relative engagement change predefined by the game evaluator.
Principle
The reference moment is particular for each game task and also differs across game-playing tasks. In case of the TimeOnTask metric, which represents the time required by the player to complete the task for the first time, the reference moment for a particular task represents the moment of time when the player successfully completed the previous task and starts to do the current task. Therefore, the relative engagement change during the TimeOnTask timeline is computed for each participant as in Eq. (2).
where, E 0 represents the participant’s engagement at the beginning of the task, while N represents the number of values from the TimeOnTask timeline (e.g., N = 50 iterations in case of 50 s long TimeOnTask, for a 1 s computation granularity of the relative engagement change).
The Threshold Computation component of the ToTCompute mechanism, takes as input the predefined relative engagement change (ΔE p ), along with the relative engagement changes (ΔE j ) computed for all participants, for each j value from the TimeOnTask timeline. The TimeOnTask is a task-related metric, and thus its thresholds are computed for each individual task of a game or game level. The set of tasks T, corresponding to a game or game level, for which the threshold values are computed is expressed as in Eq. (3), where X represents the number of tasks.
Figure 3 illustrates the principle used by the ToTCompute mechanism in order to compute the TimeOnTask threshold values \( T{h}_{t_x} \) corresponding to a predefined relative engagement change ΔE p , for a list of game tasks T. In order to enable engagement monitoring at a higher granularity the ToTCompute mechanism can be used in a similar way to compute TimeOnTask threshold values for multiple ΔE p relative engagement changes (e.g., 5, 10, or 15 %), which can be specified by the game designer depending on the desired granularity.

ToTCompute threshold values computation principle for multiple game tasks
The algorithm used by ToTCompute in order to compute the threshold value \( T{h}_{t_x} \) corresponding to a certain relative engagement change ∆E, for a particular game task t x is presented next.
TimeOnTask Threshold Computation Algorithm
The pseudo-code for the TimeOnTask threshold computation algorithm is described for the case of a single predefined relative engagement change ΔE p and a single game task t x , in Algorithm 1.
Along with the predefined relative engagement change ΔE p the TimeOnTask threshold computation algorithm takes the following inputs:
-
A set of TimeOnTask timeline’s values (\( To{T}_{t_x}\Big) \) corresponding to a game task t x , computed for each participant i as represented in Eq. (4).
$$ To{T}_{t_x}=\left\{To{T}_{t_x,i,j},\ i=\overline{1,P,}j=\overline{1,{N}_{t_{x,i}}}\right\} $$(4)where, P represents the number of participants and j indexes the iterations of the TimeOnTask metric ranging from 1 s to the maximum possible iteration \( {N}_{t_x,i} \), which represents the actual TimeOnTask needed by the participant i to complete successfully a game task t x .
-
A set of computed relative engagement changes (∆E tx ) corresponding to the t x game task, computed for each participant i, and each iteration j of the TimeOnTask metric, as represented in Eq. (5).
$$ \varDelta {E}_{t_x}=\left\{\varDelta {E}_{t_x,i,j},\ i=\overline{1,P,}j=\overline{1,{N}_{t_{x,i}}}\right\} $$(5)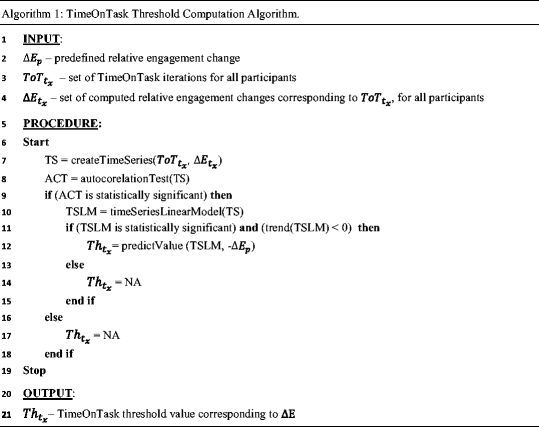

The output of the algorithm for a game task t x , consists of a TimeOnTask threshold value \( T{h}_{t_x} \), corresponding to the predefined relative engagement change ΔE p . The first step of the TimeOnTask threshold computation algorithm is to create a time series of the computed relative engagement changes, by averaging the \( \varDelta {E}_{t_x,i,j} \) across all i participants for each j TimeOnTask iteration. Time series analysis (Yanovitsky and VanLear 2008), is used because the \( \varDelta {E}_{t_x,i,j} \) values corresponding to a game task t x and a participant i, represent successive measures of the same variable (relative engagement change), taken regularity over the entire TimeOnTask period at an interval of 1 s. Specific analysis, statistical modelling and inference methods have to be used for time series analysis (Yanovitsky and VanLear 2008). Since for the same game task t x , the TimeOnTask metric can vary across different participants, the relative engagement changes are averaged across multiple participants in order to obtain a more reliable threshold value. Furthermore, the created time series contains all the averaged relative engagement change values obtained from at least two individual time series, the minimum number required for time series aggregation. Aggregation of time series data is a commonly used procedure in time series analysis (Anderson et al. 2011; Silvestrini and Veredas 2008; Yanovitsky and VanLear 2008). Examples of multiple time series aggregation methods that have been previously used, include averaging or summing the data points taken at the same moment of time across the time series (Iacoboni et al. 1999; Shi et al. 2011).
After the average engagement change time series is created, the next step in the algorithm procedure is to conduct an autocorrelation test (ACT), in order to test if adjacent data samples correlate significantly and in consequence the data is not random (Chatfield 2003; Filliben and Heckert 2012). If the autocorrelation test returns that the data is not random, the time series linear model (TSLM) is computed. ToTCompute will return NA (Not Available) value if the autocorrelation test indicates random data. The algorithm continues by checking if the TSLM is statistically significant and if this has a negative trend (engagement decreases with the TimeOnTask iterations). If the two conditions are verified, the TimeOnTask threshold \( T{h}_{t_x} \) is computed by the TSLM, for the predefined engagement change ΔE p . If any of the two conditions is not verified, the algorithm returns NA (Not Available) value, indicating that the threshold value could not be computed. Similarly, NA value is returned if the autocorrelation test indicates random data.
ToTCompute Applicability
By using the proposed mechanism to compute TimeOnTask threshold values for different relative engagement changes from the initial moment (e.g., 5, 10 or 15 %), engagement modelling at a higher granularity is made possible. The player’s engagement decrease level could be computed in real time based on the events generated when the TimeOnTask metric would reach a predefined value on the predefined mapping with the relative engagement changes. A game monitoring component could trigger specific events when a metric reaches or exceeds a certain threshold value corresponding to a relative engagement change thus informing the game adaptation engine about the metric and the relative engagement change reached.
The mapping between the relative engagement changes and the engagement decrease levels is provided by the game designer. The game designer provides also the set of relative engagement changes for which events could be generated during the monitoring process. The set of relative engagement changes is expressed as in Eq. 6, while the set of engagement decrease levels is expressed as in Eq. (7). The mapping between the relative engagement changes and the engagement decrease levels is represented in Fig. 4.

Mapping between relative engagement changes and engagement decrease levels
The number K of the engagement decrease levels, and thus the granularity of the engagement level computation is provided by the game designer as they specify the set of relative engagement changes ΔE k . The game designer also has to specify the relative engagement change boundaries (ΔE k − 1, ΔE k ) for each engagement decrease level EDL k . An exemplification of the mapping between the engagement relative changes and the engagement decrease levels is provided in Table 2.
Depending on the engagement events received and based on the existing mapping, the corresponding engagement decrease level will be outputted. If a player’s engagement decreases with a relative value higher than ΔE K , the player can be considered as disengaged. This is because the engagement decrease level reaches the highest level provided by the game creator. The relative engagement changes, the engagement decrease levels and the mapping between these (see Fig. 4), are represented from a general point of view. In this way, the proposed solution permits engagement modelling at a higher granularity and further enables engagement-based adaptation.
Experimental Case Study
Overview
An experimental case study was conducted in order to evaluate the proposed ToTCompute mechanism that provides automatic computation of task-dependent threshold values for the TimeOnTask generic engagement metric. During the study, the participants had to play two parts of an educational game and to answer a number of questionnaires (i.e., demographic questionnaire, initial/post motivation questionnaire before/after the game-play, motivation assessment questionnaire for each game part). More details about the questionnaire can be found in (Ghergulescu and Muntean 2014a).
Additional information was recorded during the testing session. The start and stop timestamps needed for computing the TimeOnTask generic engagement metric were recorded for each game-playing task by embedding automatic logging in the educational game. The participants’ EEG data and the affective data (i.e., engagement, frustration, excitement and meditation) were recorded using the Emotiv EPOC headset. Game playing related data and the EEG data collected from 50 participants (eight female and 42 male) were used for the analysis. The participants age ranged from 18 to 55 years old, where the average age was 27 years old (SD = 7). Both native English speakers and non-native speakers have participated in the study. The participants had different nationalities. 64 % of the participants have reported being a casual game player, 22 % being a novice game player and 14 % being an expert player.
Fire Protocol Educational Game
The Fire Protocol game from the < e-Adventure > (e-Adventure Project n.d.) platform was selected for the experimental study. This game was considered to offer a good compromise between the number of distinct game tasks and the time required to complete the game. Fire Protocol is a first-person game that aims to teach the player the fire safety evacuation protocol from a practical perspective. The player takes the role of Pablo, a member of the Faculty of Informatics from Complutense University of Madrid.
During the experimental study the participants had to play the two parts of the Fire Protocol game. The individual tasks corresponding to the two game parts are summarised in Table 3. The first part of the game consists of two mandatory tasks PhoneConversation and ReadProtocolBook. The player has to answer the phone, and since he is new in the university he is instructed to learn about the evacuation procedure during a fire by reading the fire protocol book placed on his desk. The first part of the game ends when the player finishes the reading and proceeds further in the game.
The second game part consists of three mandatory tasks and the optional task of reading the protocol book that can be done anytime during the game play. After checking for fire in office 411, the player has to activate the fire alarm, and then to check the teacher offices. In office 414, the player meets the non-player character Balta, and through a conversation informs him about the fire and asks him to leave the building. Once the player has checked all four offices he can proceed to leave the building. In order to successfully complete the evacuation procedure the player has to do all the tasks, and leave the building on stairs rather than taking the elevator. The game provides the player with feedback when he makes a mistake such as trying to proceed without activating the alarm.
Methodology
Testing Session Description
The testing session was conducted with one participant at a time, and was designed to last around 45 min on average. The participants attended the study on a voluntary basis and although they could withdraw from the study at any moment none of them did so. Before starting the testing session each participant was provided with written information and instructions about the testing procedure, as well as with additional verbal instructions if they had any questions. Following that, the Emotiv EPOC headset was setup making sure good signal was received from all sensors. Before playing the two parts of the game, each participant filled in a demographic questionnaire that was used in collect background information such as age and gender.
Test Setup
Figure 5 illustrates the testing setup for the experimental study. The testing computer (PC1) was used by the participants to play the educational game as well as to fill in the motivation assessment questionnaire at the end of each of the two game parts. The Fire Protocol educational game provided through the < e-Adventure > platform was used.

Testing setup for the experimental case study
The Fire Protocol game, which integrates the functionality of generating game reports, was extended using < e-Adventure > in order to report information required to compute the TimeOnTask metric for individual game tasks (e.g., game event name, start and stop timestamps). The Fire Protocol game runs on the Java platform and launches a window in the middle of the screen. In order to reduce the participants’ head movements and thus the artefacts in the EEG recordings, the questionnaire used for assessing the participants’ motivation for the two game parts was implemented as Java application and displayed also on the PC1 screen.
A second computer (PC2) was used for EEG data recording. The EEG data is captured using the Emotiv EPOC headset and sent via a wireless connection to PC2, where the data can be displayed and recorded using the proprietary TestBench and Control Panel software programs provided by the Emotiv EPOC system. TestBench displays in real time raw EEG signals of the sensors located on the headset device, as well as alpha/beta/gamma/theta brain waves computed by the Emotiv system. The Control Panel displays affective data (e.g., engagement, frustration, excitement and meditation), expressive data (e.g., blinks, facial expression), and cognitive data (if the system was trained to recognise player’s intention).
However, only the raw EEG signals can be saved as binary.edf files through the proprietary software. To overcome this limitation and to facilitate the data processing and analysis, two software programs were developed in Java, saving the raw EEG data and the affective data using the Emotiv API into.csv text files. The programs save the data at the sampling rates provided by the Emotiv API, which are 128 samples per second in case of raw EEG data and approximately 2 samples per second for the affective data.
The experimental study was conducted in two universities Dublin City University (DCU) and National College of Ireland (NCI). Similar conditions were maintained between the two testing environments. To facilitate the data processing the computers were automatically date and time synchronised with the Internet time server “time.windows.com”. The screens of PC1 and PC2 were also recorded using the TechSmith Camtasia Studio software, in order to extract additional data for analysis that cannot be automatically recorded into log files.
Procedure
In order to compute TimeOnTask threshold values corresponding to a particular game task and a predefined relative engagement change (e.g., 5, 10 or 15 %), ToTCompute first computes the relative engagement changes for all participants every second (i.e., every TimeOnTask iteration) over the entire duration of time they played the task for the first time. A participant’s relative engagement change for a particular TimeOnTask iteration is computed relative to his/her engagement level measured at the beginning of the task.
Based on the computed relative engagement change data, ToTCompute outputs the TimeOnTask threshold value (in seconds), above which players’ engagement will decrease with the predefined relative engagement change. For this experimental study, participants’ TimeOnTask metric values were computed based on the timestamps saved in the game reports for each game event (e.g., start task, end task), while participants’ engagement during the game-play was measured and recorded continuously during the game-play using the Emotiv EPOC system. The TimeOnTask threshold computation algorithm was implemented using functions from the forecast package (Hyndman 2012) for the R statistics software. The TimeOnTask threshold computation was conducted for two tasks from game part 1 (PhoneConversation and ReadProtocolBook), and for three tasks from game part 2 (CheckOfficeFire, ActivateAlarm and CheckTeacherOffices).
Data Analysis
This section presents the results of the experimental case study evaluating the proposed ToTCompute mechanism. Three analyses were conducted in this sense. The first analysis investigates the non-randomness of the average relative engagement change time series for the five game tasks, a prerequisite for computing threshold values using the ToTCompute mechanism. The second analysis investigates the performance of the ToTCompute’s threshold value computation for the TimeOnTasks metric across different game tasks. The third analysis investigates the variation of the TimeOnTask threshold value across different game tasks.
Time Series Randomness Results
Time series analysis is based on the assumption that successive observations in a time series are usually dependent and thus the time series is not random. If successive observations are dependent, future values can be predicted from past observations (Chatfield 2003). Autocorrelation, the correlation of a variable with itself, was used in order to test the dependencies of successive observations of the average relative engagement change time series. This is necessary to verify that the time series are not random and can be used by the ToTCompute mechanism for detecting threshold value for the TimeOnTask metric. Autocorrelation plots (corelograms) illustrating the autocorrelations computed for data values at different successive time intervals or lags, are constructed to facilitate the assessment of time series’ randomness. In order for a time series to be random, the autocorrelations should be near zero for any and all time-lag separations (Filliben and Heckert 2012).
Figure 6 presents the autocorrelation plots for the five game tasks. The x-axis of each diagram represents the lags, while the y-axis represents the autocorrelation coefficient. The bars represent the value of the autocorrelation coefficient at specific lags. A one-second time interval between successive lags corresponding to the one second interval between successive engagement values was considered. The dotted blue lines in the autocorrelation plots represent the 5 % significance level (95 % confidence band) for the statistical test of autocorrelation. Any autocorrelation values that fall outside of the dotted lines are statistically significantly different from zero.

Autocorrelation plots for the average relative engagement change time series of the five tasks corresponding to the two game parts
The autocorrelation results show that the average relative engagement change time series are not random for all five game tasks considered in the evaluation, as the degree of autocorrelation between adjacent and near-adjacent observations of the time series is high (above the significance level indicated by the dashed blue lines). The results also show that the time interval between average relative engagement change time series observations that are independent (i.e., do not correlate) varies across the different game tasks considered in the evaluation. The number of lags for which the autocorrelation is statistically significant is 27 for the PhoneConversation task, 28 for the ReadProtocolBook task, 17 for the CheckOfficeFire task, 8 for the ActivateAlarm task, and 50 for the CheckTeacherOffices task.
The results of the first analysis have confirmed the importance of performing a randomness test before proceeding to compute threshold value for the TimeOnTask generic engagement metric using the ToTCompute mechanism. For the five game tasks considered in this evaluation study the average relative engagement change time series were not random. The variation between the five tasks however, indicates that random time series that would compromise the results are possible in case of other games and game tasks. By integrating this autocorrelation pre-check the ToTCompute mechanism provides a way to identify situations when the time series are random. ToTCompute will return NA (Not Available) value for the threshold if the autocorrelation test indicates random data.
Time Series Regression Model Results
In order to compute the threshold values for the TimeOnTask generic engagement metric, the proposed ToTCompute mechanism computes the linear regression model of the average relative engagement change time series. By using regression, the mechanism also provides a measure of its performance, on how accurately the TimeOnTask threshold value is detected for different game tasks in the form of the coefficient of determination R2. This coefficient indicates how well the average relative engagement change time series data points fit the linear model.
Figure 7 presents the variation in time of the average relative engagement change across the 50 participants, for the five game tasks corresponding to the two game parts considered in this paper. The average relative engagement change is represented by the black line, while the blue line represents the fitted time series linear model. The 85 and 95 % confidence intervals are also illustrated for the next 100 values forecasted from the time series linear model. The forecasted engagement change values are within the dark grey upper and lower limits with 85 % confidence, and within the light grey upper and lower limits with 95 % confidence. The ToTCompute mechanism detects threshold value when player’s engagement is decreasing with a specific level. Therefore, the forecasting and the TimeOnTask threshold computation is not done for game tasks for which the average relative engagement time series presents an increasing trend, which is the case for the ActivateAlarm task in this evaluation.

Average and predicted relative engagement change over time for the five game tasks corresponding to the two game parts
While the average engagement presents variations over the TimeOnTask duration, the results show that overall the engagement presents a decreasing trend for four out of the five game tasks considered in the evaluation. Furthermore, the results show that the average relative engagement change also varies across the different game tasks.
The results of the time series linear regression presented in Table 4, show that the regression models and thus the TimeOnTask threshold values computation is statistically significant (p < .001) for the PhoneConversation, ReadProtocolBook, CheckOfficeFire and CheckTeacherOffices tasks. The linear regression results also show that the performance of the ToTCompute mechanism and in particular the goodness of fit of the regression models varies across the different game tasks. The adjusted R2 coefficient of determination, indicates that TimeOnTask explains 76.2 % of the variance in engagement change for the PhoneConversation task, 73.8 % for the ReadProtocolBook task, 43 % for the CheckOfficeFire task, and 70 % for the CheckTeacherOffices task. As the average relative engagement time series for ActivateAlarm task presents an increasing trend, a threshold value cannot be computed for this task.
The results of the second analysis have shown that the proposed ToTCompute mechanism can be used to automatically compute threshold values for the TimeOnTask generic engagement metric, for four out of the five game tasks considered in this evaluation study. For the other task the threshold value cannot be computed as the average relative engagement change time series for this task presents an increasing trend, while the ToTCompute mechanism works only for the case when the engagement decreases.
The results also show that at the beginning of the task, participants’ engagement tends to increase before starting to decrease. This fact is more visible in case of the ActivateAlarm task, and to less extent in case of the PhoneConversation and CheckOfficeFire tasks. Although in case of the ActivateAlarm task the relative engagement change also starts to decrease sharply towards the end, this does not change the overall increasing trend in engagement, thus TimeOnTask threshold values cannot be computed for this particular task.
TimeOnTask Threshold Values Relative to ΔE p
Table 5 presents the threshold values for the TimeOnTask generic engagement metric, computed by the ToTCompute mechanism for three different predefined relative engagement changes, 5, 10 and 15 % provided as input.
The results show high variations between different game tasks. For example, the threshold value corresponding to the 5 % predefined relative engagement change ranges from 34 s in case of the ReadProtocolBook task to 103 s in case of the CheckTeacherOffices task. The variation is caused by the diversity of the game tasks and the fact that each task is unique in its own way.
The results of the third analysis confirm that the TimeOnTask threshold value is task-dependent, and setting it manually for multiple game tasks (e.g., by an expert) would be a laborious process.
Discussion
This section discusses the results, the benefits and the applicability, as well as the limitations of the proposed solution for engagement modelling and monitoring.
Benefits
The ToTCompute mechanism provides automatic computation of threshold values for the TimeOnTask generic engagement metric. ToTCompute makes use of data from a testing session and computes threshold values based on the measured engagement data using the Emotiv EPOC system, but also predicts threshold values based on the existing data even when the participants engagement did not decrease below specific predefined relative engagement change. Furthermore, ToTCompute uses a threshold validation internally and outputs the threshold only when there are statistically significant relationships between the values of the measured generic metric and the participants’ relative engagement change. The internal validation represents an added benefit because the person who is using the mechanism can trust the threshold values, as the mechanism will not provide threshold values when there were no statistically significant relationships (e.g., because of the low number of participants), or the participants’ engagement for a specific task presents an increasing trend.
The results have shown that the proposed ToTCompute mechanism can be used to automatically compute task-dependent threshold values for the TimeOnTask generic engagement metric, with regression analysis indicating that TimeOnTask explains up to 76.2 % of the variance in engagement change.
The results have also shown high variations between different game tasks, with the threshold value corresponding to a 5 % predefined relative engagement change ranging from 34 s in case of the ReadProtocolBook task to 103 s in case of the CheckTeacherOffices task. The variation is caused by the diversity of the task and the fact that each task is unique in its own way. This confirms that the TimeOnTask threshold value is task-dependent, and setting it manually for multiple game tasks (e.g., by an expert) would be a laborious process.
The initial testing session has to be performed for each particular game, and the ToTCompute mechanism has to be run on the collected data in order to define specific thresholds for each of the game tasks identified by the game creator or researcher. More research is needed in order to investigate the relationship between different game types and game tasks from a time spent on task point of view.
Limitations
One of the limitations of this solution represents the prerequisites of using ToTCompute that is to conduct an initial test session during which a number of participants need to play the game, the TimeOnTask metric needs to be logged, and the participants’ EEG signals need to be recorded using the Emotiv EPOC headset. As the practical feasibility of such an initial testing session might affect the generalizability of the proposed solution, it is recommended that the data collection to be conducted as part of the beta testing for individual games.
Another limitation that could be a generalisation issue is in the case when the game is very well designed and the player’s engagement does not decrease and they will not become disengaged. In this case the metrics will not indicate a decrease in player’s engagement. However, the ToTCompute mechanism addresses the issue, as the mechanism is capable to determine if a threshold for the metrics above which the engagement level decreased with a certain percentage can be computed or not.
A robust definition for what a task means and how long a task could take is not available. This research refers to task as to an activity that needs to be done by the player. This research leaves to the game designer (or the person who wants to integrate the engagement monitoring in the game) to decide the task granularity and complexity. On one side, this is very useful because it does not limit the applicability of the proposed solutions to specific types of activities or granularity. On another side, a generalisation issue of the applicability of the ToTCompute mechanism can be raised, in situations when two or more tasks overlap between each other or a clear distinction of the tasks cannot be made. The TimeOnTask Threshold Computation Algorithm requires the time series of the Engagement computed by the Emotiv EPOC internal mechanism during the task period for which to compute. Therefore, this research recommends in such cases to decrease the task granularity for which the engagement monitoring to be done by grouping the multiple interpolated tasks in a single task. The minimal duration for a task in order to apply the method is 50 s as, 50 or more observations provide reasonably accurate estimates in time series analysis (Velicer and Joseph 2003).
Although Emotiv EPOC was reported as having high validity for detection of engagement and other emotions, special attention has to be taken while conducting the initial testing session and measuring the EEG signal. First, the Emotiv EPOC headset has to be setup making sure that good signal was received from all sensors. Second, head movements should be reduced as these could introduce noise in the EEG signal. Therefore, the proposed solution is limited to game-based e-learning scenarios where the players are seated. Traditional equipment could be used in order to solve the signal and noise issues. However, the traditional equipment might be very intrusive and disturbing.
Conclusions
Engagement modelling and monitoring has become an important research topic in the e-learning and game-based e-learning areas. However, in game-based e-learning, engagement monitoring has to be done in a non-disturbing way and without braking the game flow and immersion. Furthermore, automatic mechanisms for facilitating the engagement related metrics assessment, and further to enable engagement monitoring independent of particular game-based e-learning system or of particular game-playing tasks, are needed.
This paper has proposed the TimeOnTask Threshold Computation mechanism (ToTCompute), a novel mechanism that automatically computes task-dependent threshold values for the TimeOnTask generic engagement metric assessment. The threshold value is computed using time series analysis technique based on game-playing data and EEG engagement data collected with the Emotiv EPOC headset.
An evaluation case study on 50 participants was conducted in order to evaluate the performance and the utility of the proposed ToTCompute mechanism. Five different game tasks corresponding to two game parts were considered. The results of the evaluation case study have shown that the proposed ToTCompute mechanism has a good performance for automatically computing task-dependent threshold value for the TimeOnTask generic engagement metric. The results have shown that TimeOnTask explains 65.75 % of the variance in relative engagement change, on average across the four game tasks for which the participants presented a decreasing engagement. A limitation of this paper represents the fact that the threshold values obtained in this case study have not been validated by a second case study.
Furthermore, the results have shown the utility of an automatic threshold value computation solution such as ToTCompute, as the TimeOnTask metric in general and its threshold value after which a player’s engagement decreases with a specific relative value are highly dependent on particular game tasks. Therefore, setting the threshold value manually for multiple game tasks would be a laborious process, especially when high engagement monitoring granularity is also desired.
By automatically computing task-dependent threshold values of the generic TimeOnTask metric for different relative engagement changes from the initial moment (e.g., 5, 10 or 15 %), the mechanism enables engagement modelling at a higher granularity and further enables engagement-based adaptation in GBeL systems. ToTCompute may enable engagement-based monitoring and adaptation where engagement related factors such as feedback, rewards, challenge and/or autonomy can be adapted based on the relative engagement change. Furthermore, higher granularity of the engagement monitoring and modelling could be achieved by taking different subcategories of users (e.g., male, female, novice player, casual player, expert player) and applying the mechanism on data collected by subgroups of users.
Notes
BioSemi - http://www.biosemi.com/
NeuroScan - http://www.neuroscan.com/
Brain Products - http://www.brainproducts.com/
Electrical Geodesics - http://www.egi.com/
NeuroSky Brainwave kit - http://store.neurosky.com/products/brainwave-starter-kit
Emotiv EPOC - https://emotiv.com/epoc.php
References
American Electroencephalographic Society. (1994). Guideline thirteen: guidelines for standard electrode position nomenclature. American electroencephalographic society. Journal of Clinical Neurophysiology: Official Publication of the American Electroencephalographic Society, 11(1), 111–113.
Anderson, E. W., Potter, K. C., Matzen, L. E., Shepherd, J. F., Preston, G. A., & Silva, C. T. (2011). A user study of visualization effectiveness using EEG and cognitive load. Computer Graphics Forum, 30(3), 791–800. doi:10.1111/j.1467-8659.2011.01928.x.
Arroyo, I., Mehranian, H., & Woolf, B. (2010). Effort-based tutoring: An empirical approach to intelligent tutoring. In Proceedings of the 3rd International Conference on Educational Data Mining. Pittsburgh, PA. Retrieved from http://www.centerforknowledgecommunication.info/newPubs/Effort-based%20Tutoring%20-%20%20paper.pdf
Bandura, A. (1994). Self-efficacy. In V. S. Ramachandran (Ed.), Encyclopedia of Human Behavior. San Diego, California: Academic Press Inc. Retrieved from http://www.uky.edu/~eushe2/Bandura/Bandura1994EHB.pdf
Bandura, A. (2006). Guide for constructing self-efficacy scales. In F. Pajares & T. C. Urdan (Eds.), Self-efficacy beliefs of adolescents (Vol. 5, pp. 307–337). Information Age Publishing. Retrieved from http://books.google.com/books?hl=en&lr=&id=Cj97DKKRE7AC&oi=fnd&pg=PA307
Baumeister, J., Barthel, T., Geiss, K. R., & Weiss, M. (2008). Influence of phosphatidylserine on cognitive performance and cortical activity after induced stress. Nutritional Neuroscience, 11(3), 103–110. doi:10.1179/147683008X301478.
Belle, A., Hobson, R., & Najarian, K. (2011). A physiological signal processing system for optimal engagement and attention detection. In 2011 I.E. International Conference on Bioinformatics and Biomedicine Workshops (BIBMW) (pp. 555–561). Atlanta, Georgia, USA. http://doi.org/10.1109/BIBMW.2011.6112429
Bernard, R. R. S., & Cannon, H. M. (2011). Exploring Motivation: Using Emoticons to Map Student Motivation in a Business Game Exercis. In Developments in Business Simulation and Experiential Learning (Vol. 38, pp. 229–240). Pensacola, FL: Association for Business Simulation and Experiential Learning. Retrieved from http://www.nesig.ufsc.br/publicacoes/pdf/Bernard_and_Cannon-2011-Exploring_Motivation_Using_Emoticons_to_Map_Student_Motivation_in_a_Business_Games_Exercise.pdf
Bica, F., Verdin, R., & Vicari, R. M. (2006). Towards Cognitive Modeling of Students’ Self-Efficacy. In Sixth International Conference on Advanced Learning Technologies, 2006 (pp. 1017–1021). http://doi.org/10.1109/ICALT.2006.1652618
Boulay, B. du, & Soldato, T. del. (2015). Implementation of Motivational Tactics in Tutoring Systems: 20 years on. International Journal of Artificial Intelligence in Education, 1–13. http://doi.org/10.1007/s40593-015-0052-1
Carroll, J. B. (1963). A model of school learning. The Teachers College Record, 64(8), 723–723.
Carroll, J. B. (1989). The Carroll model: a 25-year retrospective and prospective view. Educational Researcher, 18(1), 26–31.
Cernea, D., Kerren, A., & Ebert, A. (2011). Detecting Insight and Emotion in Visualization Applications with a Commercial EEG Headset. In Proceedings of the SIGRAD 2011 Conference on Evaluations of Graphics and Visualization. Retrieved from http://www.ep.liu.se/ecp/065/008/ecp11065008.pdf
Cernea, D., Olech, P.-S., Ebert, A., & Kerren, A. (2012). Measuring subjectivity. KI - Künstliche Intelligenz, 26(2), 177–182. doi:10.1007/s13218-011-0165-0.
Chanel, G., Rebetez, C., Bétrancourt, M., & Pun, T. (2008). Boredom, engagement and anxiety as indicators for adaptation to difficulty in games (pp. 13–17). New York: ACM. doi:10.1145/1457199.1457203.
Chanel, G., Rebetez, C., Bétrancourt, M., & Pun, T. (2011). Emotion assessment from physiological signals for adaptation of game difficulty. IEEE Transactions on Systems, Man, and Cybernetics Part A: Systems and Humans, 41(6), 1052–1063. doi:10.1109/TSMCA.2011.2116000.
Chatfield, C. (2003). The Analysis of Time Series: An Introduction, Sixth Edition. Taylor & Francis.
Chen, Z.-H., & Chan, T.-W. (2008). Learning by Substitutive Competition: Nurturing My-Pet for Game Competition Based on Open Learner Model. In 2008 Second IEEE International Conference on Digital Games and Intelligent Toys Based Education (pp. 124–131). Banff, BC, Canada. http://doi.org/10.1109/DIGITEL.2008.36
Cheng, J., Mabasa, G., & Oppus, C. (2014). Prolonged distraction testing game implemented with ImpactJS HTML5, Gamepad and Neurosky. In 2014 International Conference on Humanoid, Nanotechnology, Information Technology, Communication and Control, Environment and Management (HNICEM) (pp. 1–6). http://doi.org/10.1109/HNICEM.2014.7016184
Coan, J. A., & Allen, J. J. B. (2003). Frontal EEG asymmetry and the behavioral activation and inhibition systems. Psychophysiology, 40(1), 106–114. doi:10.1111/1469-8986.00011.
Coan, J. A., & Allen, J. J. B. (2004). Frontal EEG asymmetry as a moderator and mediator of emotion. Biological Psychology, 67(1–2), 7–49. doi:10.1016/j.biopsycho.2004.03.002.
Cocea, M., & Weibelzahl, S. (2009). Log file analysis for disengagement detection in e-Learning environments. User Modeling and User-Adapted Interaction, 19(4), 341–385. doi:10.1007/s11257-009-9065-5.
Cocea, M., & Weibelzahl, S. (2011). Disengagement detection in online learning: validation studies and perspectives. IEEE Transactions on Learning Technologies, 4(2), 114–124. doi:10.1109/TLT.2010.14.
Cooper, N. R., Croft, R. J., Dominey, S. J., Burgess, A. P., & Gruzelier, J. H. (2003). Paradox lost? Exploring the role of alpha oscillations during externally vs. internally directed attention and the implications for idling and inhibition hypotheses. International Journal of Psychophysiology, 47(1), 65–74. doi:10.1016/S0167-8760(02)00107-1.
Cowley, B., Charles, D., Black, M., & Hickey, R. (2008). Toward an understanding of flow in video games. Comput Entertain, 6(2), 20:1–20:27. doi:10.1145/1371216.1371223.
Crowley, K., Sliney, A., Pitt, I., & Murphy, D. (2010). Evaluating a brain-computer interface to categorise human emotional response. In 2010 10th IEEE International Conference on Advanced Learning Technologies (pp. 276–278). Ieee. Retrieved from http://www.computer.org/csdl/proceedings/icalt/2010/4055/00/4055a276-abs.html
Davis, J. P., Steury, K., & Pagulayan, R. (2005). A survey method for assessing perceptions of a game: The consumer playtest in game design. Game Studies, 5(1). Retrieved from http://gamestudies.org/0501/davis_steury_pagulayan/
Derbali, L., & Frasson, C. (2010). Prediction of Players Motivational States Using Electrophysiological Measures during Serious Game Play. In 2010 I.E. 10th International Conference on Advanced Learning Technologies (ICALT) (pp. 498–502). Sousse, Tunisia. http://doi.org/10.1109/ICALT.2010.143
e-Adventure Project. (n.d.). Retrieved December 10, 2012, from http://e-adventure.e-ucm.es/
Eseryel, D., Law, V., Ifenthaler, D., Ge, X., & Miller, R. (2014). An investigation of the interrelationships between motivation, engagement, and complex problem solving in game-based learning. Educational Technology and Society, 17(1), 42–53.
Fairclough, S. H., & Roberts, J. S. (2011). Effects of performance feedback on cardiovascular reactivity and frontal EEG asymmetry. International Journal of Psychophysiology, 81(3), 291–298. doi:10.1016/j.ijpsycho.2011.07.012.
Fairclough, S. H., Gilleade, K., Ewing, K. C., & Roberts, J. (2013). Capturing user engagement via psychophysiology: measures and mechanisms for biocybernetic adaptation. International Journal of Autonomous and Adaptive Communications Systems (IJAACS), 6(1), 63–79. doi:10.1504/IJAACS.2013.050694.
Farrell, D., & Moffat, D. (2014). Applying the Self Determination Theory of Motivation in Games Based Learning. In 8th European Conference on Games Based Learning: ECGBL2014 (p. 118). Retrieved from http://books.google.com/books?hl=en&lr=&id=IedEBQAAQBAJ&oi=fnd&pg=PA118&dq=applying+the+self+determination+theory+of+motivation+on+games+based+learning&ots=bEWe5S7k0Y&sig=fVnlOWMN2zycnnfChAnf-LiRz9U
Filliben, J. J., & Heckert, A. (2012). Exploratory data analysis. In C. Croarkin & P. Tobias (Eds.), NIST/SEMATECH e-handbook of statistical methods. NIST/SEMATECH. Retrieved from http://www.itl.nist.gov/div898/handbook/eda/section3/eda331.htm
Ghergulescu, I. (2013). Automatic Non-Disturbing Motivation Monitoring in Game-based E-learning through Player Behaviour and EEG (Ph.D. Thesis). National College of Ireland, Dublin, Ireland.
Ghergulescu, I., & Muntean, C. H. (2010a). Assessment of motivation in games based e-learning. In Proceeding of IADIS International Conference Cognition and Exploratory Learning in Digital Age (CELDA 2010) (pp. 71–78). Timisoara, Romania. Retrieved from http://www.iadisportal.org/digital-library/assessment-of-motivation-in-gaming-based-e-learning
Ghergulescu, I., & Muntean, C. H. (2010b). MoGAME : Motivation based Game Level Adaptation Mechanism. Presented at the 10th Annual Irish Learning Technology Conference (EdTech 2010), Athlone Institute of Technology. Retrieved from http://trap.ncirl.ie/1267/
Ghergulescu, I., & Muntean, C. H. (2011). Learner Motivation Assessment with <e-Adventure> Game Platform. In World Conference on E-Learning in Corporate, Government, Healthcare, and Higher Education 2011 (pp. 1212–1221). Chesapeake, VA: AACE. Retrieved from http://editlib.org/p/38880
Ghergulescu, I., & Muntean, C. H. (2012a). Measurement and analysis of learner’s motivation in game-based e-learning. In D. Ifenthaler, D. Eseryel, & X. Ge (Eds.), Assessment in Game-Based Learning (pp. 355–378). New York, NY: Springer. Retrieved from http://link.springer.com/chapter/10.1007/978-1-4614-3546-4_18?null
Ghergulescu, I., & Muntean, C. H. (2012b). Supporting motivation based educational games through Web 3.0. In P. Isaias, D. Ifenthaler, D. G. Sampson, & J. M. Spector (Eds.), Towards Learning and Instruction in Web 3.0 (pp. 247–264). New York, NY: Springer. Retrieved from http://link.springer.com/chapter/10.1007/978-1-4614-1539-8_15
Ghergulescu, I., & Muntean, C. H. (2014a). A novel sensor-based methodology for learner’s motivation analysis in game-based learning. Interacting with Computers, 26(4), 305–320. doi:10.1093/iwc/iwu013.
Ghergulescu, I., & Muntean, C. H. (2014b). Motivation monitoring and assessment extension for input-process-outcome game model. International Journal of Game-Based Learning (IJGBL), 4(2), 15–35. doi:10.4018/ijgbl.2014040102.
Ghergulescu, I., Moldovan, A.-N., & Muntean, C. H. (2014). Measurement of Self-Efficacy in Game-Based E-Learning Through Interaction With Non-Player Characters. In Proceedings of 25th Society for Information Technology and Teacher Education International Conference (SITE 2014) (pp. 640–644). Jacksonville, Florida, USA: AACE. Retrieved from http://www.editlib.org/p/130827
Gilleade, K. M., & Dix, A. (2004). Using frustration in the design of adaptive videogames (pp. 228–232). New York: ACM. doi:10.1145/1067343.1067372.
Gold, S. C., & Wolfe, J. (2012). The validity and effectiveness of a business game beta test. Simulation and Gaming, 43(4), 481–505. doi:10.1177/1046878111431868.
Goldberg, B. S., Sottilare, R. A., Brawner, K. W., & Holden, H. K. (2011). Predicting learner engagement during well-defined and ill-defined computer-based intercultural interactions. In Affective Computing and Intelligent Interaction (pp. 538–547). Springer. Retrieved from http://link.springer.com/chapter/10.1007/978-3-642-24600-5_57
Gomez-Gil, J., San-Jose-Gonzalez, I., Nicolas-Alonso, L. F., & Alonso-Garcia, S. (2011). Steering a tractor by means of an EMG-based human-machine interface. Sensors, 11(7), 7110–7126. doi:10.3390/s110707110.
Gonzalez-Sanchez, J., Chavez-Echeagaray, M. E., Atkinson, R., & Burleson, W. (2011). ABE: An Agent-Based Software Architecture for a Multimodal Emotion Recognition Framework. In 2011 9th Working IEEE/IFIP Conference on Software Architecture (WICSA) (pp. 187–193). Boulder, CO, USA. http://doi.org/10.1109/WICSA.2011.32
Gourab, K., & Schmit, B. D. (2010). Changes in movement-related β-band EEG signals in human spinal cord injury. Clinical Neurophysiology, 121(12), 2017–2023. doi:10.1016/j.clinph.2010.05.012.
Haapalainen, E., Kim, S., Forlizzi, J. F., & Dey, A. K. (2010). Psycho-physiological measures for assessing cognitive load. In Proceedings of the 12th ACM international conference on Ubiquitous computing (pp. 301–310). ACM. Retrieved from http://dl.acm.org/citation.cfm?id=1864395
Hanslmayr, S., Gross, J., Klimesch, W., & Shapiro, K. L. (2011). The role of alpha oscillations in temporal attention. Brain Research Reviews, 67(1–2), 331–343. doi:10.1016/j.brainresrev.2011.04.002.
Harmon-Jones, E., & Amodio, D. M. (2012). Electroencephalographic methods in psychology. In H. Cooper, P. M. Camic, D. L. Long, A. T. Panter, D. Rindskopf, & K. J. Sher (Eds.), APA handbook of research methods in psychology, vol 1: Foundations, planning, measures, and psychometrics (pp. 503–522). Washington: American Psychological Association.
Huang, W.-H., Huang, W.-Y., & Tschopp, J. (2010). Sustaining iterative game playing processes in DGBL: the relationship between motivational processing and outcome processing. Computers & Education, 55(2), 789–797. doi:10.1016/j.compedu.2010.03.011.
Huang, Y.-M., Huang, S.-H., & Wu, T.-T. (2014). Embedding diagnostic mechanisms in a digital game for learning mathematics. Educational Technology Research and Development, 62(2), 187–207. doi:10.1007/s11423-013-9315-4.
Hughes, J. R. (2008). Gamma, fast, and ultrafast waves of the brain: their relationships with epilepsy and behavior. Epilepsy & Behavior, 13(1), 25–31. doi:10.1016/j.yebeh.2008.01.011.
Hyndman, R. J. (2012). Package “forecast”: Forecasting functions for time series. Retrieved from http://cran.r-project.org/web/packages/forecast/
Iacoboni, M., Woods, R. P., Brass, M., Bekkering, H., Mazziotta, J. C., & Rizzolatti, G. (1999). Cortical mechanisms of human imitation. Science, 286(5449), 2526–2528. doi:10.1126/science.286.5449.2526.
IMI. (2008). Intrinsic motivation inventory description. Retrieved September 19, 2012, from http://www.psych.rochester.edu/SDT/measures/IMI_description.php
Inventado, P. S., Legaspi, R., Suarez, M., & Numao, M. (2011). Predicting student emotions resulting from appraisal of ITS feedback. Research and Practice in Technology Enhanced Learning, 6(2), 107–133.
Johns, J., & Woolf, B. (2006). A dynamic mixture model to detect student motivation and proficiency. In Proceedings of the 21st national conference on Artificial intelligence - Volume 1 (pp. 163–168). AAAI Press. Retrieved from http://dl.acm.org/citation.cfm?id=1597538.1597565
Kamiński, J., Brzezicka, A., Gola, M., & Wróbel, A. (2012). Beta band oscillations engagement in human alertness process. International Journal of Psychophysiology, 85(1), 125–128. doi:10.1016/j.ijpsycho.2011.11.006.
Kebritchi, M., Hirumi, A., & Bai, H. (2010). The effects of modern mathematics computer games on mathematics achievement and class motivation. Computers & Education, 55(2), 427–443. doi:10.1016/j.compedu.2010.02.007.
Keller, J. M. (1987). Development and use of the ARCS model of instructional design. Journal of Instructional Development, 10(3), 2–10. doi:10.1007/BF02905780.
Kleih, S. C., Nijboer, F., Halder, S., & Kübler, A. (2010). Motivation modulates the P300 amplitude during brain–computer interface use. Clinical Neurophysiology, 121(7), 1023–1031. doi:10.1016/j.clinph.2010.01.034.
Knyazev, G. G. (2007). Motivation, emotion, and their inhibitory control mirrored in brain oscillations. Neuroscience & Biobehavioral Reviews, 31(3), 377–395. doi:10.1016/j.neubiorev.2006.10.004.
Konetes, G. D. (2010). The function of intrinsic and extrinsic motivation in educational virtual games and simulations (Rising Scholar Paper). Journal of Emerging Technologies in Web Intelligence, 2(1). http://doi.org/10.4304/jetwi.2.1.23-26
Kuber, R., & Wright, F. P. (2013). Augmenting the instant messaging experience through the use of BCI and gestural technologies. International Journal of Human-Computer Interaction, 29(3), 178–191. doi:10.1080/10447318.2012.702635.
Lalo, E., Gilbertson, T., Doyle, L., Lazzaro, V., Cioni, B., & Brown, P. (2007). Phasic increases in cortical beta activity are associated with alterations in sensory processing in the human. Experimental Brain Research, 177(1), 137–145. doi:10.1007/s00221-006-0655-8.
Liu, T.-Y., & Chu, Y.-L. (2010). Using ubiquitous games in an English listening and speaking course: impact on learning outcomes and motivation. Computers & Education, 55(2), 630–643. doi:10.1016/j.compedu.2010.02.023.
Liu, M., Horton, L., Olmanson, J., & Toprac, P. (2011). A study of learning and motivation in a new media enriched environment for middle school science. Educational Technology Research and Development, 59(2), 249–265. doi:10.1007/s11423-011-9192-7.
Luo, A., & Sullivan, T. J. (2010). A user-friendly SSVEP-based brain–computer interface using a time-domain classifier. Journal of Neural Engineering, 7(2), 026010.
Mampusti, E. T., Ng, J. S., Quinto, J. J. I., Teng, G. L., Suarez, M. T. C., & Trogo, R. S. (2011). Measuring academic affective states of students via brainwave signals. In 2011 Third International Conference on Knowledge and Systems Engineering (KSE) (pp. 226–231). Hanoi, Vietnam. http://doi.org/10.1109/KSE.2011.43
Mattheiss, E., Kickmeier-Rust, M. D., Steiner, C. M., & Albert, D. (2010). Approaches to detect discouraged learners: assessment of motivation in educational computer games. In In proceedings of eLearning Baltics (eLBa) 2010. Rostock, Germany. Retrieved from http://www.kmi.tugraz.at/layout/set/print/content/download/445/2005/file/PDF.pdf
McMahan, T., Parberry, I., & Parsons, T. D. (2015a). Modality specific assessment of video game player’s experience using the Emotiv. Entertainment Computing, 7, 1–6.
McMahan, T., Parberry, I., & Parsons, T. D. (2015a). Evaluating player task engagement and arousal using electroencephalography. In Proceedings of the 3rd International Conference on Affective and Pleasurable Design. Retrieved from http://psychology.unt.edu/~tparsons/pdf/Parsons_Evaluating%20player%20task%20engagement%20and%20arousal%20using%20electroencephalography.pdf
McQuiggan, S. W., Mott, B. W., & Lester, J. C. (2007). Modeling self-efficacy in intelligent tutoring systems: an inductive approach. User Modeling and User-Adapted Interaction, 18(1–2), 81–123. doi:10.1007/s11257-007-9040-y.
Meluso, A., Zheng, M., Spires, H. A., & Lester, J. (2012). Enhancing 5th graders’ science content knowledge and self-efficacy through game-based learning. Computers & Education, 59(2), 497–504. doi:10.1016/j.compedu.2011.12.019.
Miller, L. M., Chang, C.-I., Wang, S., Beier, M. E., & Klisch, Y. (2011). Learning and motivational impacts of a multimedia science game. Computers & Education, 57(1), 1425–1433. doi:10.1016/j.compedu.2011.01.016.
Munoz-Organero, M., Munoz-Merino, P. J., & Kloos, C. D. (2010). Student behavior and interaction patterns with an LMS as motivation predictors in E-learning settings. IEEE Transactions on Education, 53(3), 463–470. doi:10.1109/TE.2009.2027433.
O’Regan, S., Faul, S., & Marnane, W. (2010). Automatic detection of EEG artefacts arising from head movements using gyroscopes. In 2010 3rd International Symposium on Applied Sciences in Biomedical and Communication Technologies (ISABEL) (pp. 1 –5). http://doi.org/10.1109/ISABEL.2010.5702924
Palva, S., & Palva, J. M. (2007). New vistas for α-frequency band oscillations. Trends in Neurosciences, 30(4), 150–158. doi:10.1016/j.tins.2007.02.001.
Patsis, G., Sahli, H., Verhelst, W., & De Troyer, O. (2013). Evaluation of attention levels in a tetris game using a brain computer interface. In User Modeling, Adaptation, and Personalization (pp. 127–138). Springer. Retrieved from http://link.springer.com/chapter/10.1007/978-3-642-38844-6_11
Petersen, M., Stahlhut, C., Stopczynski, A., Larsen, J., & Hansen, L. (2011). Smartphones get emotional: mind reading images and reconstructing the neural sources. In S. D’Mello, A. Graesser, B. Schuller, & J.-C. Martin (Eds.), Affective Computing and Intelligent Interaction (Vol. 6975, pp. 578–587). Springer Berlin/Heidelberg. Retrieved from http://www.springerlink.com/content/y54475t124093054/abstract/
Pizzagalli, D. A. (2007). Electroencephalography and high-density electrophysiological source localization. In J. T. Cacioppo, L. G. Tassinary, & G. G. Berntson (Eds.), Handbook of psychophysiology (3rd ed.) (pp. 56–84). New York, NY, US: Cambridge University Press. Retrieved from http://psycnet.apa.org/psycinfo/2007-08652-003
Pogosyan, A., Gaynor, L. D., Eusebio, A., & Brown, P. (2009). Boosting cortical activity at beta-band frequencies slows movement in humans. Current Biology, 19(19), 1637–1641. doi:10.1016/j.cub.2009.07.074.
Pope, A. T., Bogart, E. H., & Bartolome, D. S. (1995). Biocybernetic system evaluates indices of operator engagement in automated task. Biological Psychology, 40(1–2), 187–195. doi:10.1016/0301-0511(95)05116-3.
Prinzel, L. J., Freeman, F. G., Scerbo, M. W., Mikulka, P. J., & Pope, A. T. (2000). A closed-loop system for examining psychophysiological measures for adaptive task allocation. The International Journal of Aviation Psychology, 10(4), 393–410. doi:10.1207/S15327108IJAP1004_6.
Putman, P. (2011). Resting state EEG delta–beta coherence in relation to anxiety, behavioral inhibition, and selective attentional processing of threatening stimuli. International Journal of Psychophysiology, 80(1), 63–68. doi:10.1016/j.ijpsycho.2011.01.011.
Rebolledo-Mendez, G., Dunwell, I., Martínez-Mirón, E. A., Vargas-Cerdán, M. D., De Freitas, S., Liarokapis, F., & García-Gaona, A. R. (2009). Assessing neurosky’s usability to detect attention levels in an assessment exercise. In Human-Computer Interaction. New Trends (pp. 149–158). Springer. Retrieved from http://link.springer.com/chapter/10.1007/978-3-642-02574-7_17
Romei, V., Gross, J., & Thut, G. (2010). On the role of prestimulus alpha rhythms over occipito-parietal areas in visual input regulation: correlation or causation? The Journal of Neuroscience, 30(25), 8692–8697. doi:10.1523/JNEUROSCI.0160-10.2010.
Ryan, R. M., & Deci, E. L. (2000a). Intrinsic and extrinsic motivations: classic definitions and new directions. Contemporary Educational Psychology, 25(1), 54–67. doi:10.1006/ceps.1999.1020.
Ryan, R. M., & Deci, E. L. (2000b). Self-determination theory and the facilitation of intrinsic motivation, social development, and well-being. American Psychologist, 55(1), 68–78. doi:10.1037/0003-066X.55.1.68.
Saeed, S., & Zyngier, D. (2012). How motivation influences student engagement: a qualitative case study. Journal of Education and Learning, 1(2), 252.
Sauseng, P., Klimesch, W., Gruber, W., Doppelmayr, M., Stadler, W., & Schabus, M. (2002). The interplay between theta and alpha oscillations in the human electroencephalogram reflects the transfer of information between memory systems. Neuroscience Letters, 324(2), 121–124. doi:10.1016/S0304-3940(02)00225-2.
Shen, L., Wang, M., & Shen, R. (2009). Affective e-learning: using “emotional” data to improve learning in pervasive learning environment. Educational Technology and Society, 12(2), 176–189.
Shi, E., Chan, T.-H. H., Rieffel, E., Chow, R., & Song, D. (2011). Privacy-preserving aggregation of time-series data. Presented at the 18th Annual Network & Distributed System Security Symposium, San Diego, California. Retrieved from http://amplab.cs.berkeley.edu/publication/privacy-preserving-aggregation-of-time-series-data/
Silvestrini, A., & Veredas, D. (2008). Temporal aggregation of univariate and multivariate time series models: a survey. Journal of Economic Surveys, 22(3), 458–497. doi:10.1111/j.1467-6419.2007.00538.x.
Sneed, Z. (2006). Postsecondary disability support services: a survey of achievement of national program standards. ProQuest. Retrieved from http://books.google.ie/books?id=Ref0WuNVSccC
Stamps, K., & Hamam, Y. (2010). Towards inexpensive BCI control for wheelchair navigation in the enabled environment – a hardware survey. In Y. Yao, R. Sun, T. Poggio, J. Liu, N. Zhong, & J. Huang (Eds.), Brain informatics (Vol. 6334, pp. 336–345). Springer Berlin/Heidelberg. Retrieved from http://www.springerlink.com/content/l683157470640344/abstract/
Teplan, M. (2002). Fundamentals of EEG measurement. Measurement Science Review, 2(2), 1–11.
Tüzün, H., Yılmaz-Soylu, M., Karakuş, T., İnal, Y., & Kızılkaya, G. (2009). The effects of computer games on primary school students’ achievement and motivation in geography learning. Computers & Education, 52(1), 68–77. doi:10.1016/j.compedu.2008.06.008.
van Vugt, M. K., Schulze-Bonhage, A., Litt, B., Brandt, A., & Kahana, M. J. (2010). Hippocampal gamma oscillations increase with memory load. The Journal of Neuroscience, 30(7), 2694–2699. doi:10.1523/JNEUROSCI.0567-09.2010.
Vansteenkiste, M., Lens, W., & Deci, E. L. (2006). Intrinsic versus extrinsic goal contents in self-determination theory: another look at the quality of academic motivation. Educational Psychologist, 41(1), 19–31.
Velicer, W. F., & Joseph, F. (2003). Time Series Analysis. doi:10.1002/0471264385.wei0223.
Vos, N., van der Meijden, H., & Denessen, E. (2011). Effects of constructing versus playing an educational game on student motivation and deep learning strategy use. Computers & Education, 56(1), 127–137. doi:10.1016/j.compedu.2010.08.013.
Wang, L., Jensen, O., van den Brink, D., Weder, N., Schoffelen, J.-M., Magyari, L., & Bastiaansen, M. (2012). Beta oscillations relate to the N400m during language comprehension. Human Brain Mapping. doi:10.1002/hbm.21410.
Woo, J.-C. (2014). Digital game-based learning supports student motivation, cognitive success, and performance outcomes. Educational Technology and Society, 17(3), 291–307.
Yanovitsky, I., & VanLear, A. (2008). Time series analysis: Traditional and contemporary approaches. In M. D. Slater, L. B. Snyder, & A. Hayes (Eds.), The sage sourcebook of advanced data analysis methods for communications research (pp. 89–124). Thousand Oaks: Sage.
Yasui, Y. (2009). A brainwave signal measurement and data processing technique for daily life applications. Journal of Physiological Anthropology, 28(3), 145–150.
Yearsley, J. M., & Pothos, E. M. (2014). Challenging the classical notion of time in cognition: a quantum perspective. Proceedings of the Royal Society B, 281(1781), 20133056. doi:10.1098/rspb.2013.3056.
Zimmerman, B. J., Bandura, A., & Martinez-Pons, M. (1992). Self-motivation for academic attainment: the role of self-efficacy beliefs and personal goal setting. American Educational Research Journal, 29(3), 663–676. doi:10.2307/1163261.
Acknowledgments
This work was supported by Irish Research Council for Science, Engineering and Technology (IRCSET) Embark Postgraduate Scholarship Scheme.
Author information
Authors and Affiliations
Corresponding author
Rights and permissions
About this article

Cite this article
Ghergulescu, I., Muntean, C.H. ToTCompute: A Novel EEG-Based TimeOnTask Threshold Computation Mechanism for Engagement Modelling and Monitoring. Int J Artif Intell Educ 26, 821–854 (2016). https://doi.org/10.1007/s40593-016-0111-2
Published:
Issue Date:
DOI: https://doi.org/10.1007/s40593-016-0111-2