
Abstract
Background
Body-fluid loss during prolonged continuous exercise can impair cardiovascular function, harming performance. Delta percent plasma volume (dPV) represents the change in central and circulatory body-water volume and therefore hydration during exercise; however, the effect of carbohydrate–electrolyte drinks and water on the dPV response is unclear.
Objective
To determine by meta-analysis the effects of ingested hypertonic (> 300 mOsmol kg−1), isotonic (275–300 mOsmol kg−1) and hypotonic (< 275 mOsmol kg−1) drinks containing carbohydrate and electrolyte ([Na+] < 50 mmol L−1), and non-carbohydrate drinks/water (< 40 mOsmol kg−1) on dPV during continuous exercise.
Methods
A systematic review produced 28 qualifying studies and 68 drink treatment effects. Random-effects meta-analyses with repeated measures provided estimates of effects and probability of superiority (p+) during 0–180 min of exercise, adjusted for drink osmolality, ingestion rate, metabolic rate and a weakly informative Bayesian prior.
Results
Mean drink effects on dPV were: hypertonic − 7.4% [90% compatibility limits (CL) − 8.5, − 6.3], isotonic − 8.7% (90% CL − 10.1, − 7.4), hypotonic − 6.3% (90% CL − 7.4, − 5.3) and water − 7.5% (90% CL − 8.5, − 6.4). Posterior contrast estimates relative to the smallest important effect (dPV = 0.75%) were: hypertonic-isotonic 1.2% (90% CL − 0.1, 2.6; p+ = 0.74), hypotonic-isotonic 2.3% (90% CL 1.1, 3.5; p+ = 0.984), water-isotonic 1.3% (90% CL 0.0, 2.5; p+ = 0.76), hypotonic-hypertonic 1.1% (90% CL 0.1, 2.1; p+ = 0.71), hypertonic-water 0.1% (90% CL − 0.8, 1.0; p+ = 0.12) and hypotonic-water 1.1% (90% CL 0.1, 2.0; p+ = 0.72). Thus, hypotonic drinks were very likely superior to isotonic and likely superior to hypertonic and water. Metabolic rate, ingestion rate, carbohydrate characteristics and electrolyte concentration were generally substantial modifiers of dPV.
Conclusion
Hypotonic carbohydrate–electrolyte drinks ingested continuously during exercise provide the greatest benefit to hydration.
Graphical abstract

Some confusion exists around the effect of commonly ingested carbohydrate–electrolyte drinks and water on the hydration response during exercise. |
We meta-analysed the common measure of central hydration status—delta plasma volume—and found that hypotonic carbohydrate–electrolyte drinks ingested continuously during exercise provide the greatest benefit to hydration when compared with hypertonic drinks, isotonic drinks and water. |
1 Introduction
Prolonged exercise leads to the loss of body fluid associated with elevated sweat rates [1,2,3,4]. Dehydration of greater than at least 3–4% of total body-water (> 2% body mass) can reduce cardiac output [5,6,7,8,9], increase perceived exertion [10], impair cutaneous and central thermoregulatory function [5, 8, 9, 11,12,13], and impair muscle blood flow [14] and endurance exercise performance in some [15,16,17,18,19] but not all conditions [20,21,22]. To offset the sometimes deleterious effects of dehydration on cardiovascular function and performance, drinks containing mostly carbohydrate and electrolytes are now widely recommended for ingestion to provide carbohydrate for energy [23, 24] and fluid to attenuate dehydration [25] and offset hyponatremia [23].
Because of the role of ingested carbohydrate (CHO)–electrolyte (CHO-E) (sports drinks) and non-carbohydrate–electrolyte (non-CHO-E) beverages (sports waters) on performance and health, there is considerable commercial and practical interest in the relative impact of sports drink composition on hydration during exercise, and in recent times with concern over sugar content, the emergence of less concentrated hypotonic carbohydrate–electrolyte drinks. The physiological rationale guiding the interest in (re)hydration with ingested CHO-E and non-CHO-E beverages during exercise lies in the rapid restoration or maintenance of body-fluid homeostasis, cardiovascular and thermoregulatory function [5, 9, 19, 26]. The question of what sports drink or sports water composition is better to hydrate/rehydrate during exercise depends upon the properties of the ingested drinks, which affect gastric emptying, intestinal fluid absorption, body fluid retention and (renal) excretion [1, 2, 27, 28] (Fig. 1). More comprehensive reviews on gastric emptying and intestinal absorption effects on fluid absorption are available [26, 29,30,31] and will not be reviewed here. However, a summary of these physiological processes is provided to assist readers in understanding the rationale for beverage formulation for the purposes of hydration during continuous exercise (Tables 1 and 2). By magnitude, the most influential factors are beverage volume and osmolality, the latter of which is determined primarily by CHO concentration and format, with sodium and other electrolytes having a lesser impact on absorption, plasma volume, and fluid retention during exercise [23, 32, 33].

Summary of the basic physiology underlying the effect of carbohydrate–electrolyte drink (CHO-E) and non-carbohydrate–electrolyte drink (non-CHO-E) beverage ingestion on hydration. This figure summarises the processes believed responsible for the temporal relative expansion of body-water content following intestinal fluid absorption. Whole-body water exchange, gain, loss, distribution and osmotic equilibrium are indicated by the arrows across the plasma, interstitial and intracellular fluid compartments. Fluid transport across the gut epithelia occurs via passive and osmotic gradient and channel (aquaporin, AQP)-mediated processes, facilitated by carbohydrate transport and solvent drag [1, 24]. Fluid shifts across body fluid compartments occurs through a combination of rapid time-course hydrostatic pressure and osmotic pressure gradients, and slower time-course reabsorption in the kidneys [110]. SGLT1 sodium-dependent glucose co-transporters, GLUT5 fructose transporter, DRTS disaccharide-related transport system, ATP Na+/K+-ATPase
Mechanistic measures of fluid flux in hydration research have included the net rate of appearance of isotopically labelled water (deuterium oxide, D2O) into the plasma compartment, the delta percent plasma volume (dPV), and ingested fluid delivery rate to the gut and the circulation from measures of gastric emptying and intestinal absorption (e.g., triple lumen segmental perfusion methodology). Each method has limitations for inference of hydration effects. D2O appearance captures only unidirectional fluid flux, and therefore is useful for the determination of fluid kinetics from ingestion to the appearance in the plasma or urine, but does not provide information on the net increase in fluid available to the body [34]. Intestinal absorption measured using segmental perfusion provides inference only to the specific segment of the intestine assayed, which is a limitation because absorption rates vary along the length of the intestine [1, 35]. Foundation physiological principles specify that the cellular component of blood has a fixed osmolality, while the extracellular compartment of the body fluid is in osmotic equilibrium between the vascular and interstitial compartments (Fig. 1). Therefore, change in dPV does not directly trace fluid absorption or compartmental transfer kinetics, but rather provides a direct measure of the net effect of ingested beverages on real-time central hydration status; dPV is also by far the most widely available parameter to permit large-scale analysis and inferential conclusions on hydration.
This brings us to the physical property of osmosis—the movement of fluid across semi-permeable membranes (permeable to the solvent, but not the solute)—to categorise the hydration properties of hypertonic, isotonic and hypotonic beverages [36,37,38,39]. Inference from intestinal absorption studies suggests benefits to hydration are possible from the ingestion of water and hypotonic and isotonic drinks, but conclusions as to the comparative benefits are equivocal when measures of dPV and contrasting solution compositional characteristics (CHO type, CHO concentration, salt concentration) are considered, leaving consensus on the most beneficial ingested drink tonicity for hydration unclear.
Therefore, the purpose of the current study was to determine the hydrating effects of ingested hypertonic, isotonic and hypotonic CHO-E drinks and non-CHO-E waters and water during continuous endurance exercise, as measured by dPV, by way of systematic meta-analysis. Hydration benefits were defined as a more positive directional gain of dPV over exercise time following drink ingestion. The present analysis was predicted to provide clarity on what beverage osmolality category may result in better rehydration for the implied purpose of offsetting potentially harmful effects of dehydration on cardiovascular function, thermoregulation and physical performance. While it is beyond the scope of the current review to cover optimal hydration strategies for sports or the effects of dehydration on sports performance, the new analysis may aid in future work towards these objectives.
2 Methods
2.1 Protocol and Registration
The meta-analysis was conducted and reported in accordance with the guidelines stipulated in the Preferred Reporting Items for Systematic Review and Meta Analyses (PRISMA) statement and SYRCLE protocol, and first registered with CAMARADES, publication date 27 April 2017. After initial analysis, re-evaluation of the available data led to a protocol refresh to include hypertonic drinks and water contrasts as described below.
2.2 Search Strategy, Study Selection and Data Extraction
To retrieve relevant literature on hypotonic, isotonic and hypertonic solutions and water and their effects on hydration (dPV) during continuous exercise a systematic search was conducted from April 2017 to January 2018 and refreshed February to 30 June 2020 using the databases Scopus (including Medline), Web of Science, SPORTDiscus, PubMed and the Cochrane Central Register of Controlled Trials (Australia/New Zealand, North America). There was no limit to publication date. Search terms are listed in Table 3. Due to the potential for reference to animals appearing in the abstracts or full texts of relevant articles, the database searches were not restricted to studies conducted in humans. Studies published as reviews, abstracts, commentaries, etc., or studies for which the subject was irrelevant (i.e., on animals, in plants, in vitro) were excluded. No limitation was placed on the literature search with respect to language; however, the search terms naturally favoured English.
Titles and abstracts were screened for relevance by scanning for exclusion criteria by two reviewers (HK and CB). Full-text publications of potentially relevant studies were retrieved and reviewed for eligibility according to the inclusion criteria by the same reviewers. Reference lists of accepted articles were manually reviewed for relevant citations to supplement the search results. The data extracted included study characteristics, such as first author, year of publication, number of participants, and intervention characteristics (continuous exercise characteristics). Data sets were extracted in the form reported: text, tables, extracted from graphed data with a digital ruler. Authors were contacted to obtain missing data. Studies where only a single drink bolus was ingested were omitted because of different absorption kinetics and effects on dPV versus continuous drink boluses. Only datasets for continual regular drink ingestion, typically 10- to 15-min intervals, during continuous exercise were compiled for the analysis. Pre-exercise diet was unreported or euhydrated post-prandial. Contrasts with > 50 mEq L−1 sodium were excluded [33, 40, 41] because of non-specificity to current commercialised formulations (> 50 mEq L−1 sodium considered too salty to taste [26]), the impact of that much salt being moderate-large on plasma volume expansion and retention [41], and regulatory parameters [42].
2.3 Inclusion and Exclusion Criteria
Included studies had to represent original research appearing in full-text format in peer-reviewed journals or an unpublished full study report of human intervention studies in healthy adults during continuous fixed-workload exercise. Studies had to compare the effect of ingestion of solutions formulated to different osmolality by altering either the CHO concentration and type and/or the electrolyte concentration or type. Dosing regimens had to be specified and were classified as: hypertonic (> 300 mOsmol kg−1), hypotonic (< 275 mOsmol kg−1), isotonic (275–300 mOsmol kg−1) or water from tap, mineral or beverage containing non-caloric flavouring, minerals or vitamins but without CHO at < 40 mOsmol kg−1 [43]. All drink osmolality values were measured or in some waters were unreported (Table 4; an analysis value of zero was assigned to all water treatments, see Sect. 2.5). Drinks were to be consumed orally in all trials and the ingestion rate (mL min−1) of solutions was standardised with ≥ 1 mL min−1 representing practical intake. Hydration was evaluated with plasma volume change (delta) from stable resting baseline (dPV), reported in a usable way, with > 1 during-exercise samples. Studies were also excluded if they represented duplicate or kin publications, the treatment or outcome was not appropriate or uninterpretable with regard to the outcome measures, subjects were dehydrated prior to exercise, the studies were not conducted in humans, or the ingested drinks contained protein.
2.4 Study Quality
Included studies were assessed for quality based on the following assessment categories: purpose and/or hypotheses stated, confounders, participant background diet and lifestyle, exercise type, study duration and measurement time frame. Each study was independently assessed by two authors (CB and HK). Discrepancies were resolved by discussion, if necessary, with a third-party arbitrator present (DR).
2.5 Statistical Analysis
Random-effects meta-analyses realised with mixed linear models (Proc Mixed in SAS Enterprise Guide 8.2.1) provided estimates and compatibility intervals of predicted values and effects; the effects were processed to give Bayesian posterior intervals and probabilities. All analysis codes and datasets are provided in Online Supplementary Material (OSM) 1–3.
2.5.1 Statistical Model
Each estimate was weighted by the inverse of the square of its standard error (SE), and the method of setting the residual variance to unity in Proc Mixed was used [44]. The fixed effects were the drink condition (Treatment: hyper-osmolar (hypertonic), iso-osmolar (isotonic), hypo-osmolar (hypotonic), water) interacted with time in tertiles of the dataset (TimeBin: < 30, 30–63, 63–180 min). Drink osmolarity was added as a linear numeric covariate (Treatment*TimeBin*DrinkOsM) to estimate the modifying effect of ingested drink osmolality on dPV of each CHO-containing drink. Predicted dPV and effects were adjusted to the mean osmolarity of the drinks in each condition. Three other linear numeric covariates interacted with condition and time were included: drink ingestion rate (the total volume ingested divided by the final dPV sampling time); heat index (calculated from the reported study ambient temperature and relative humidity using the tool provided by the National Weather Service at wpc.ncep.noaa.gov/html/heatindex.shtml); and metabolic rate (mean oxygen consumption rate during exercise in L min−1). Sweat rates, acclimation status, prior diet and urine production were not reported with sufficient consistency to allow inclusion in the model.
The random effects were: study identity (StudyID), to account for between-study heterogeneity; a unique identity for each exercise bout (ExptID) nested within StudyID, to account for Treatment as a repeated measure within studies between bouts; and a unique identity for each estimate (EstimateID) nested within StudyID, to account for TimeBin as a repeated measure within bouts. Variances were assumed to have a normal distribution, and negative values were permitted [45]. The variances of the random effects were combined and presented as a standard deviation (SD) representing unexplained typical uncertainty in the predicted mean dPV for a given drink at a given time in a new setting.
2.5.2 Inferential Framework
The Bayesian analysis promoted by Greenland [46] was used, since it allows practical analysis and interpretation of the prior as a probability distribution of the expected magnitude. Each effect on dPV was modified by a generic normally distributed weakly informative prior centred on zero with a 90% confidence interval (± 6.25% dPV; see below) that excluded very large effects on dPV drawn from the within-subject variability in endurance cycling performance and relationship to change in plasma volume. The prior distribution provided a reasonable physiological coverage of the possible mean effect. A more informative prior could not be justified since it would inevitably be biased by the current authors' knowledge of the published effects around the selected studies.
We used data for the relationship of change in PV after a (de)hydration intervention with change cycling performance time in healthy trained athletes, and information on the smallest meaningful effect on performance, to derive an estimate of the smallest important change in dPV from which to base statistical estimates of superior outcomes. The pooled average increase in PV (+ 3.6%, SD 8.8%) was associated with a pattern for improved time-trial performance (− 1.9%, SD 2.5%) [47]. The average coefficient of variation (CV%) for endurance road cycling time trial (TT) performance in a single event was 1.3% (90% CL 0.9–2.4%) [48]. The value for the smallest important effect that improves the chances of winning is 0.3 × CV% for performance [49]. This information provides an estimate for the smallest important effect (SIE) on dPV of 0.75% (i.e., 0.4 × 3.6/1.9). Accordingly, thresholds for moderate, large, very large and extremely large effect sizes were modelled and determined to be 0.9, 1.6, 2.5 and 4.0 times the CV, respectively [50].
For all outcomes, uncertainty was presented as 90% compatibility limits (CLs) (equivalent to Bayesian credibility) [51]. The unadjusted and Bayesian posterior probabilities were the area of the sampling t-distribution of the effect statistic relative to the SIE. Probabilities of increasing or superior (p+) or decreasing or inferior (p–) relative to the reference provided the compatibility measure that the effect is substantially different to the reference condition [46]. In a case where both p-values were < 0.05, the outcome represented equivalency. To assist with evidence-based qualification of outcomes, posterior probabilities that were compatible with an outcome > SIE were binned into conservative descriptors within a framework of information drawn from sport science and medicine [50] and climate change science [52], where: p = 0.25–0.75, about as likely (substantial) as not (equivalent); p = 0.75–0.95, likely; p = 0.95–0.995, very likely; p > 0.995, virtually certain. Effects with inadequate precision (i.e., p– > 0.05 and p+ > 0.05) were noted as unclear or inconclusive.
2.5.3 Moderating Effects of Carbohydrate and Electrolyte Composition and Effective Intestinal Osmolality
Another appropriate analysis provided a model to account for the moderating effects of drink CHO composition on dPV. The model implementation was justified based on the premise of reducing all ingested CHO to monosaccharide functional equivalents providing the effective intestinal osmolality following (the rapid) digestion in the small intestine. This approach ignores the rapid water absorption through the duodenal leaky segment and the opposing secretion of fluid into the lumen with hypertonic intestinal contents [1, 38].
An analysis of the effect of the three CHO parameters concentration, format and transportable-CHO type was complexed by the multiple underlying levels and digestion and absorption interactions, all with numeric effects. Accordingly, CHO concentration was modelled as the total in grams percent volume (g/vol%). Carbohydrate format, whether monosaccharide, disaccharide or glucose polymer/maltodextrin, was coded in SAS using a two-level dummy variable, where monosaccharide = 0, and each of the disaccharide and glucose polymers were coded as a fraction of the gram percent concentration, respectively. This approach to coding had the effect of weighting the drink composition by make-up of the CHO format. The effective, post-digestion fructose and glucose (F:G) ratio of total ingested CHO was coded as the absolute g% ratio; for example, a solution comprising 20% fructose, 30% glucose polymer and 50% sucrose had an F:G value of 0.818. All four terms were interacted with TimeBin*Treatment.
Accounting for the di- and polysaccharide and electrolyte concentration allowed for an analysis of the ingested drink adjusted to the effective intestinal luminal osmolality following CHO digestion. This analysis was generated whereby the disaccharide concentration in mOsM kg−1 units (i.e., concentration in g 100 mL−1 divided by 180 g mol−1 times 1000/0.1) was doubled and the mass glucose polymer concentration divided by the molar mass of glucose (180 g mol−1). The total electrolyte composition was converted to mEq L−1 by multiplying the cation concentration by the valency to produce the total electrolyte mOsM concentration. Adding the CHO to the electrolyte osmolality produced the sum effective osmolality of the drink.
2.5.4 Generation of the Inverse Standard Error for Weighting
The inverse SE2 for the dependent variable was generated from the published or imputed SD for the dependent variable (dPV). Where the SD was not provided by study authors, the imputation was made by meta-regression of the natural log of the SD (logSD), by dPV adjusted for treatment, weighted by the inverse standard error for the logSD, which was 1/2DF (i.e., 1/(2*(subjectn-1)); W.G. Hopkins, personal communication, 2018). The number of imputed SD represented 17% of total SD. The SE was calculated from SD/SQRT(subjectn).
2.5.5 Heterogeneity
Heterogeneity was determined from the SD of the study and sample estimate residuals, expressed as the within-study average t-value, derived from the random effects solution. Visual inspection of a funnel plot of t-value versus SE for each study and individual estimate heterogeneity revealed data symmetry. No t-values exceeded 3.5, the threshold above which there is a 5% chance of at least one value in the absence of heterogeneity [45]. The rationale for choosing this approach was based on the argument that heterogeneity in a meta-analysis refers to real differences between effect magnitudes, which arise not from sampling variation but from moderation of the effect by differences between studies in subject characteristics, environmental factors, study design, measurement techniques or method of analysis [45]. The typical practice of testing for heterogeneity with the I2 statistic is problematic, because non-significance does not usually exclude the possibility of substantial heterogeneity, and neither the I2 nor the related Q statistic properly represent the magnitude of heterogeneity [53].
3 Results
The systematic literature search returned 266 potentially eligible studies (Fig. 2). We only considered the hydrating effects of ingested beverages during continuous exercise study settings due to methodological and physiological issues associated with disruption to plasma volume homeostasis and fluid shifts during intermittent exercise. The first bout of 60-min continuous exercise was included from one study using intermittent exercise [34]. Following review for eligibility and exclusions, a total of 28 publications with 29 study identities were extracted due to one publication containing three distinct samples and environmental conditions [54] (Table 4). Of the study identities, all utilised cycling ergometry except four, which utilised treadmill running [55,56,57,58]. There were insufficient studies to model the effect of exercise mode on outcomes. In total there were 68 unique drink treatment conditions of between one to five conditions per study, with a total of 258 measures of dPV over 0–180 min of continuous exercise utilised within the meta-analysis.

Preferred Reporting Items for Systematic Review and Meta Analyses (PRISMA) style summary of systematic review analysis workflow
3.1 Summary of Articles
Of the 28 trials included in the systematic review, 23 were randomized crossover trials (RXTs) [9, 32, 34, 35, 37, 55,56,57,58,59,60,61,62,63,64,65,66,67,68,69,70,71,72] and five were double blinded [34, 60, 61, 63, 67], while only two investigations were single blind [64, 70] (Table 4). Five trials were assumed to be non-RXT due to the authors not stating a randomized study design in the methods [54, 73,74,75,76]. The mean age of participants was 26.3 years, height 175.7 cm and weight 71.0 kg. The mean VO2peak was 60.1 mL kg−1 min−1, with 13 studies recruiting healthy and non-athletes [32, 35, 37, 56, 58, 59, 64, 66,67,68,69,70, 75] and 15 studies indicating recruitment of well-trained or elite cyclists, runners and triathletes [9, 34, 54, 55, 57, 60,61,62,63, 65, 71,72,73,74, 76]. Average study sample size was eight, with data collected from 210 male and 16 female participants.
Twenty-four of the trials used a cycle ergometer and four used treadmill running [55,56,57,58]. The longest exercise duration was 180 min [60], with 12 prescribing 120 min [9, 34, 57, 58, 61,62,63, 65, 72, 74,75,76], four prescribing 90 min [55, 66, 70, 71] and six prescribing < 90 min [32, 35, 37, 59, 67, 68]. Four of the trials prescribed exercise until exhaustion at a set intensity of 70% VO2max [54, 64, 69, 73]. All trials were sub-maximal at 48–85% VO2max.
Eleven trials reported participants completing the exercise task in hot conditions [9, 54, 57, 60,61,62, 65,66,67, 70, 71]: 30–36 °C, relative humidity 29–65%. The remaining trials reported thermoneutral conditions: 21–26 °C, relative humidity 21–55% (Table 4).
All studies provided participants with a beverage prior to exercise of between 100 and 813 mL. Thirteen of the trials provided servings at 15-min intervals, six trials used 10-min feeding intervals, six used 20-min intervals, and only two used 30-min intervals. The per-serving beverage volume ingested during exercise ranged from 100 to 407 mL (Table 4). Across all qualifying studies, the pre-exercise diet was reported as euhydrated post-prandial or unreported; accordingly, composition was not factored into the analysis due to lack of data.
3.2 Heterogeneity and Descriptive Statistics for Modifying Covariates
The between-study variance (heterogeneity) of dPV derived from the random effects model (unadjusted for Bayesian prior) was expressed as a SD to describe the typical difference in the observed effect between studies. For the main effects meta-analysis model, adjusted for metabolic rate and average ingestion rate, the between-study SD (StudyID random effect) was 2.7% (90% CL 1.8, 3.3; SE 1.5%). These SDs should be doubled prior to inference relative to the reference SD of 2.62% used herein [50, 77]. Accordingly, the standardised mean difference for between-study heterogeneity was 1.03, or a moderate effect size. The within-study random variance between multiple levels of treatment (ExptID) expressed as an SD was 0.8% (90% CL 0.2, 1.2), while the within-study random variance between sample time points within a treatment (EstimateID) was 0.6% (90% CL 0.2, 0.8). Descriptive statistics for the modifying covariates are given in Table 5.
3.3 Main Effects
Estimates for the meta-analytical mean effect of the CHO-E and non-CHO-E drinks on dPV by TimeBin are shown in Fig. 3, where the greatest reduction in plasma volume during exercise occurred with isotonic and the least reduction with hypotonic drinks. The overall mean dPV estimates were: hypertonic − 7.4% (90% CL − 8.5, − 6.3); hypotonic − 6.3% (90% CL − 7.4, − 5.3); isotonic − 8.7% (90% CL − 10.1, − 7.4); water − 7.5% (90% CL − 8.5, − 6.4). Contrasts are shown in Fig. 4. With respect to the overall main effect in the population estimate setting, the adjusted mean dPV reduction was attenuated the most with the hypotonic drink, with the effect size and precision highest and most compatible with a substantial hydration effect relative to the isotonic drink, followed with lower probability by water/non-CHO-E and hypertonic drink contrasts. Time course (TimeBin) effects for the overall mean effect considering the precision of estimate of the mean were largely consistent with the overall mean effects, except for the hypotonic–water difference likely > 63 min, and the hypertonic–hypotonic difference about as likely as not > 30 min.

Effect of hypotonic, isotonic and hypertonic drinks and water ingestion during continuous endurance exercise on delta plasma volume (dPV) by TimeBin. Data are the estimates and 90% compatibility limits (CLs) from the full fixed-effects model adjusted for the modifiers metabolic rate and drink ingestion rate. Plot placement along the x-axis is in the mid-point of the TimeBin (< 30, 30–63, 63–180 min), with data points offset by 3–6 min for presentation clarity. Also shown is the mean dPV response when no drink is ingested under thermoneutral [76] and heat stress [71] environmental conditions

Differences in the effect of ingested hypotonic, isotonic and hypertonic drinks and water on delta plasma volume (dPV) during continuous exercise. Data are estimates and 90% compatibility limits (CLs) from the meta-analysis adjusted for metabolic rate and average drink ingestion rate partitioned into the unadjusted data-derived estimate and CL (unfilled symbols, hashed lines), and the posterior estimate and CL incorporating the weakly informative prior (filled symbols, solid lines). Panels include: a the overall effect for the population mean setting; b the overall effect for an individual-study setting (i.e., the fixed effect adjusted for random effects); and c the overall effect for the population mean setting apportioned by TimeBin, where the TimeBins were < 30, 30–63, and 63–180 min. The two directional probabilities were provided based upon the probability that a given drink contrast is compatible with a substantial increasing (p+) or decreasing (p-) effect relative to the smallest important effect (SIE) defined as 0.75% dPV. p-values are rounded to two significant figures relating to probability bins (see Sect. 2). Carbohydrate–electrolyte (CHO-E) drink categories were: hypertonic > 300 mOsmol·kg−1, hypotonic < 275 mOsmol·kg−1, isotonic 275–300 mOsmol·kg−1, water/non-CHO-E solutions < 40 mOsmol·kg−1
We also analysed the predicted individual-study estimate setting outcome—the mean single-study outcome after adjustment for study random effects. In this setting, the attenuating effect on dPV of the hypotonic drink relative to the isotonic and hypertonic drink contrasts remained likely, but the compatibility of a substantial effect of water relative to isotonic was made unclear, of hypotonic on water attenuated, and of hypertonic on water increased but remaining as likely as not (Fig. 4). Together, the individual-study estimate setting outcomes suggest unaccounted for study-effects were influencing the population estimate main effect, mostly in the water and hypertonic drink associated samples.
3.4 Adjustment for Modifying Covariates
The independent modifying effects of the study-design parameters metabolic rate and drink ingestion rate, and the drink carbohydrate composition parameters and electrolyte concentration affecting dPV during continuous endurance exercise relating to the ingested CHO-E and non-CHO-E drink conditions are shown in Fig. 5. Effects on dPV presented are 2SDs of the modifier and are adjusted for the Bayesian prior. Shrinkage was observed in several of the larger magnitude estimates (OSM 3).
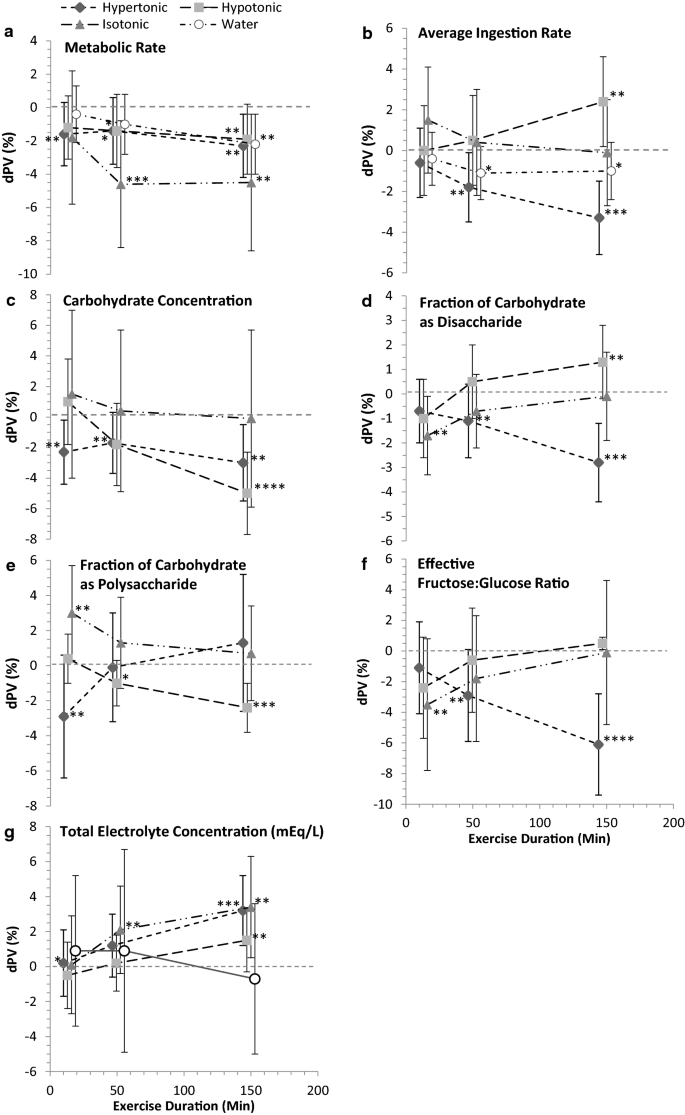
Modifying effects of study-design and drink compositional parameters on delta plasma volume (dPV) during continuous endurance exercise relating to hypotonic, isotonic, hypertonic drink and water ingestion. Effects represent the dPV response within a given drink category to 2SD of the modifiers: a metabolic rate and b drink ingestion rate, and the carbohydrate parameters c concentration, d disaccharide and e polysaccharide fractions, and f effective (after digestion) fructose:glucose ratio, and g total electrolyte concentration. Data are the estimate and 90% compatibility limits (CLs) from the full fixed effects model adjusted for ingested osmolality and the individual modifier, and the weakly informative Bayesian prior. Plot placement along the x-axis is in the mid-point of the TimeBin, with data points offset by 3–6 min for presentation clarity. Posterior probability of a substantial increase or decrease, relative to smallest important effect (SIE) (0.75% dPV), were binned for efficiency of data presentation denoted with star (*) symbols: p > 0.25 < 0.75*; p > 0.75 < 0.95**; p > 0.95 < 0.995***; p > 0.995****. Drink categories were hypertonic > 300 mOsmol·kg−1, hypotonic < 275 mOsmol·kg−1, isotonic 275–300 mOsmol·kg−1, water, non-carbohydrate solutions < 40 mOsmol·kg−1. mEq/L milliequivalents per litre
3.4.1 Exercise Metabolic Rate
Metabolic rate was associated with lower dPV; the overall largest effect was with isotonic drinks: isotonic − 4.0% (90% CL − 7.6, − 0.4); hypertonic − 1.8% (90% CL − 3.6, − 0.1); hypotonic − 1.6% (90% CL − 3.4, 0.3); and water − 1.2% (90% CL − 2.9, 0.4) (Fig. 5a).
3.4.2 Drink Ingestion Rate
Increasing the drink ingestion rate lowered overall mean dPV when hypertonic drinks (− 1.8%; 90% CL − 3.3, − 0.2) were ingested from the second tertial Timebin. However, ingesting the hypotonic drink had no impact on dPV early in exercise, but likely increased dPV in the final Timebin (Fig. 5b).
3.4.3 Drink Carbohydrate Composition
Only during the third Timebin and with the hypotonic and isotonic drinks was there evidence that was likely compatible with a modifying effect of CHO concentration (Fig. 5c), but with no clear drink difference (Fig. 6b). Evidence compatible with substantial effect sizes on dPV was found with the fractions of CHO as disaccharide (Fig. 5d) and polysaccharide (Figs. 5e, 6d), and the effective fructose:glucose ratio. Noteworthy was a small overall − 1.5% (90% CL − 2.8, − 0.3) reduction in dPV with the fraction of CHO as disaccharide when the drink was hypertonic (Fig. 5d), and the time effect of hypotonic (decreasing dPV) in response to the fraction of CHO as a polysaccharide (Fig. 5e).

Differences in the effect of ingested hypotonic, isotonic and hypertonic drinks and water on delta plasma volume (dPV) during continuous exercise when adjusted for individual drink compositional modifiers. Data are estimates and 90% compatibility limits (CLs) from the meta-analysis adjusted for metabolic rate and average drink ingestion rate partitioned into the unadjusted observed mean and CL (unfilled symbols, hashed lines), and the posterior mean and CL incorporating the weakly-informative prior (filled symbols, solid lines). Panels include: a the overall main effect on dPV when adjusted for the effective intestinal luminal osmolality after carbohydrate disaccharide and polysaccharide hydrolysis, and the effect on dPV when adjusting for carbohydrate composition modifiers (see Fig. 5 for raw effect of modifiers on dPV) when osmolality is the ingested value for; b carbohydrate concentration (%); c carbohydrate weight (g)/volume percent (w/vol%) disaccharide; d w/vol% polysaccharide; e the effective fructose:glucose ratio; and f for the effect of total electrolyte concentration. The two directional probabilities were provided based upon the probability that a given drink contrast is compatible with a substantial increasing (p+) or decreasing (p-) effect relative to the smallest important effect (SIE) defined as 0.75% dPV. p-values are rounded to two significant figures relating to probability bins (see Sect. 2). Carbohydrate-electrolyte (CHO-E) drink categories were: hypertonic > 300 mOsmol·kg−1, hypotonic < 275 mOsmol·kg−1, isotonic 275–300 mOsmol·kg−1, water/non-CHO-E solutions < 40 mOsmol·kg−1. mEq/L milliequivalents per litre
3.4.4 Drink Electrolyte Concentration
Electrolytes were mostly favourable on dPV (Fig. 5g), with increases by the third TimeBin in isotonic, hypertonic and hypotonic drinks and a moderating effect in the hypotonic-water difference (Fig. 6f).
3.4.5 Effective Intestinal Luminal Osmolality
The meta-analytical relationship between ingested osmolality and the effective intestinal luminal osmolality after di- and polysaccharide CHO digestion prior to absorption (ignoring any trans-epithelial water flux) is shown in Fig. 7. For every 100 mOsM kg−1 increase in ingested osmolality, dPV decreased by − 1.1% (90% CL − 1.4, − 0.8). Adjusting for the effect of CHO digestion—all CHO monosaccharide units and net effective osmolality—reduced a 100 mOsM kg−1 increase to a dPV decrease of − 0.3% (90% CL − 0.4, − 0.1).

The effect of ingested drink osmolality (∆) and effective intestinal luminal osmolality after carbohydrate disaccharide and polysaccharide hydrolysis (□) on delta plasma volume (dPV). Data are mean estimate and 90% compatibility interval for eight representative levels of osmolality, derived from the random effects model with Treatment*Osmolality the moderator term with adjustment for metabolic rate and average ingestion rate. mOsmol/kg osmolality
Overall, the meta-analytical outcome of the effect of adjusting carbohydrate composition for effective intestinal osomolality on dPV (Fig. 6a) was to marginally increase the effect-size difference and compatibility (posterior probability) of a substantial difference between treatments; most evident, relative to the isotonic control. The adjustment effect was to increase by ~ 60% the width of the compatibility interval (from ~ 2.5% to ~ 4%) for the isotonic drink contrasts, which were most evidently affected by carbohydrate modifiers (Fig. 5) and contained the highest compositional representation of disaccharide (sucrose) content of the drinks evaluated (Table 5). Adjusting for the prior had a minor shrinkage effect on all data-derived estimates except the hypertonic-water contrast (Fig. 6; OSM 3).
4 Discussion
The current analysis revealed that hypotonic CHO-E drinks ingested during continuous exercise very likely maintain better central hydration (dPV) when compared with the ingestion of isotonic CHO-E drinks. While evidence was less compatible, hypotonic CHO-E drinks were also more likely than not better central hydrators than hypertonic CHO-E drinks and non-CHO-E drinks/water, although the latter contrast was more likely trivial after accounting for between-study random effects. The attenuation of the reduction in dPV with the hypotonic drink was apparent, even after adjustment for exercise intensity (metabolic rate) and drink ingestion-rate modifiers, with a lesser reduction in dPV observed with hypertonic solutions and water. Integration of the Bayesian prior had no substantial impact on the data-driven primary meta-analysis. The prior did, however, cause substantial shrinkage within the 2SD of the modifier effect analysis, which is unsurprising given the effect size of the modifier. Overall, the analysis of probability finds evidence compatible with the conclusion that hypotonic CHO-E solutions provide the best hydration outcomes during exercise, even after considering remaining uncertainty after accounting for study design modifiers and random effects.
Some confusion in the literature and in commercial settings exists around the relative hydration efficacy of hypotonic versus isotonic drinks and water, because of what appear to be conflicting outcomes produced with different methodology and physiological measurement sites. Using triple-lumen intestinal segmental perfusion methodology at rest, Shi et al. [39] showed that both intestinal fluid absorption flux rate and net solute movement were higher with three 6% or 8% isotonic solutions that contained multiple-transportable CHO (MTC) as glucose, maltodextrin and sucrose controlled for [Na+], relative to hypotonic solutions with the same CHO concentrations but containing the single-transportable maltodextrin CHO source; however, in all cases the dPV pattern trended higher with the hypotonic solution, probably because of faster proximal intestinal fluid absorption indicated by the increase to iso-osmotic conditions in the distal segment (290–295 mOsmol kg−1). Gisolfi et al. [37] perfused hypotonic and isotonic solutions with 6% MTC into the proximal intestine of individuals at rest, with a drink osmolality difference due to maltodextrin replacing glucose. The intestinal fluid absorption flux rate was equivalent, but a relatively increased dPV was in favour of the hypotonic solution. In the distal intestine, as water flux follows solute transport across the apical membrane of the intestinal epithelial cell, the CHO facilitatory effects on intestinal absorption rates may be explained by solvent drag, whereby the transport of MTC creates a greater osmotic gradient [1, 39] supporting increased water draw, relative to a single transportable CHO (e.g., glucose) (Fig. 1). During continuous exercise, a drink containing MTC produced higher plasma D2O accumulation versus glucose [78]. With an isotonic drink comprising mostly sucrose and maltodextrin (Powerade, 7.6% CHO, 281 mOsmol kg−1) and a mildly hypertonic drink comprising sucrose, fructose and glucose (Gatorade, 6.0% CHO, 327 mOsmol kg−1), plasma D2O accumulation was substantially lower relative to a hypotonic drink (Mizone Rapid, 3.9% CHO, 220 mOsmol kg−1) comprising sucrose, fructose and glucose [34] (Table 4). The calculated intestinal osmolality of the isotonic and hypotonic drinks after digestion was 480 and 243 mOsmol kg−1, respectively, suggesting that the hypotonic drink remained functionally hypotonic, and that fluid absorption from isotonic solutions containing di- and polysaccharides will be relatively delayed versus a hypotonic solution, probably accounting for the lower dPV values.
Epithelial processes relating to water absorption by solvent drag, modified by CHO concentration and composition, were confirmed within the analysis (Fig. 5). As CHO drives osmotic pressure within the gut lumen, the effect of concentration was affirmed on dPV from the regression observation for the effective intestinal osmolality analysis: on average for every 100 mOsmol kg−1, dPV declined − 0.3% (Fig. 7). In support, higher CHO concentrations negatively correlated with water absorption in the proximal small intestine [1, 29]. Sucrose as an MTC promotes greater solute and water flux compared to isocaloric glucose [39], but the effect is likely limited to situations where glucose concentration is above the maximal glucose transporter (SGLT1) saturation capacity [79]. At carbohydrate concentration above the SGLT1, sucrose, being an MTC, promotes higher water flux since fructose is absorbed alternatively (GLUT5) [80]. However, results from perfusion studies are equivocal on the use of sucrose to increase water absorption. Some research has suggested equivalent fluid uptake rates from glucose and sucrose solutions [81], while in others the greatest benefit appears to arise from 6% versus 8% MTC and maltodextrin [1, 39].
An important observation was evidence compatible with a small benefit of hypotonic drinks to dPV compared to non-CHO-E/water drinks. On the other hand, non-CHO-E/water drinks also provided small benefit to hydration compared with isotonic drinks, although the contrast was made unclear after adjusting for study random effects (individual-study estimate setting analysis Fig. 4b), suggesting a level of within-study confounding bias contributed to the population estimate (Fig. 4a). Nevertheless, in the sensitivity analysis for the non-CHO-E/water-isotonic contrast (Fig. 6a), effect size and posterior probability remained compatible with a likely substantial benefit. These observations suggest that within the current data setting, both sports waters and hypotonic CHO-E drinks are superior to isotonic CHO-E drinks for hydrating during exercise. A possible explanation is that segmental fluid absorption is dictated by pore size, which progressively declines from proximal to distal. Therefore, faster water flux in the proximal duodenal segment (0–30 cm) will enhance fluid absorption from solutions of low carbohydrate concentration and tonicity facilitated by the osmotic gradient [1]. With a range of solutions comprising MTC and osmolality, there was no difference in intestinal water absorption rate versus water [38, 57, 59], which is probably secondary to rapid CHO-absorption rates in the jejunum promoting jejunal fluid absorption [1] that is secondary in turn to higher CHO-transporter density [24] compensating for the hypotonic effect at the proximal segment [37, 39].
Exercise intensity (metabolic rate covariate) substantially decreased dPV in all drinks, an effect twofold worse in the isotonic drink (Fig. 5a). Exercise, particularly intense exercise, can cause splanchnic hypoperfusion, driving gut mucosal ischemia [82], although effects on permeability are less clear [83]. A concentrated isotonic drink produced lower gut comfort versus a hypotonic drink [34]. Hypotonic drinks and water on the other hand increase unilateral water flux [34], which could attenuate the effects of blood-flow restriction on gut comfort during high-intensity exercise. Ingested fluid volume influences gastric emptying (GE), with a larger single volume emptied faster than a smaller up to 600 mL volume [30, 84]. Repeated ingestion maintains higher gastric volume and GE [30].
Including electrolytes, primarily sodium, in a sports drink increases body water retention through plasma Na+ concentration [40, 85,86,87]. In the current analysis, electrolyte concentration increased the effect on dPV with the hypertonic, isotonic and hypotonic drinks, but not water, later in exercise (Fig. 5g), suggesting electrolytes are an important mechanism influencing hydration in CHO-E drinks. On the other hand, the exclusion of sodium from glucose solutions did not influence water absorption in the small intestine [33]; the bi-directional movement of sodium across the mucosa of the proximal intestine possibly negates any pre-requisite for exogenous sodium in glucose solutions [1]. Gisolfi et al. [32] determined the effect of carbohydrate and Na+ concentration on intestinal absorption and plasma volume. Intestinal fluid absorption was faster with the hypotonic beverages, but plasma volume expansion was greater in the isotonic solution containing Na+ concentration 45 mEq L−1. A role for electrolytes, particularly Na+, however, is likely during prolonged exercise and in the heat. Body fluid loss can lead to relative hyponatremia since sweat Na+ concentration is ~ 20–80 mmol L−1 [88]. Failure to replace the excreted Na+, such as by consuming plain water, can lower plasma osmolality, increasing diuresis and leading to possible clinical deleterious effects [89]. During rehydration, increasing Na+ concentration by 1, 31, 40 and 50 mmol L−1 within a 2% sports drink stepwise increased rehydration, associated with reduced urine output [85]. In the current analysis, we excluded drinks with Na+ concentration > 50 mmol L−1 because of unfavourable palatability inhibiting drinking by reduced ad libitum consumption [90]. Furthermore, there are few commercial sports drinks or waters with [Na+] > 40 mmol L−1. Thus, the results from this meta-analysis support the addition of some electrolytes into sports drinks.
4.1 Limitations
The dPV was assumed to represent net central body-water status during exercise justified theoretically from foundation physiological principles of compartmental fluid dynamics; whether this assumption holds requires empirical investigation. It is debatable whether the effort is warranted when compared to the comparatively understudied performance phenotype. Included studies were of limited sample size (majority n ≤ 12) and dPV was not the primary outcome in most, perhaps producing higher between-study errors compared to if dPV was a primary outcome. An estimate of the reliability for plasma volume (ICC 0.96) [91], the within-subject SD = SD*sqrt (1 − r) = 0.288%, where the composite SD for plasma volume was 1.44%, resulted in a traditional sample size of n = 18 (5% α, 20% β error) to detect 0.2SD, suggesting higher sample sizes are warranted. The effective intestinal osmolality analysis is based on an assumed universal intestinal luminal osmolality, which may not hold. Finally, the methods available for dPV provide differing levels of precision, suggesting the analysis method be considered as a random effect in future analyses.
5 Conclusions
The regular ingestion of hypotonic CHO-E sports drinks during continuous exercise produced a greater attenuation of the exercise-mediated plasma volume decline, compared to isotonic and hypertonic drinks, and to non-CHO-E water/water. Additionally, the population estimate and sensitivity analyses provided outcomes compatible with sports waters hydrating better than isotonic CHO-E drinks. The sensitivity analysis suggested that isotonic drinks containing di- (sucrose) or polysaccharides present more like a hypertonic of equal carbohydrate concentration, reducing the hydration effect. The modifier analysis supported prior research indicating the inclusion of multiple transportable CHO in CHO-E drinks through an increased intestinal water absorption rate and net central hydration by increasing the threshold for transporter saturation and solvent drag. Electrolytes increase plasma volume retention and attenuate diuresis, assisting with retention of internal body fluid volume, which was seen to benefit hydration later in exercise in all CHO-E drinks. Isotonic drinks are most disadvantageous to hydration under conditions of higher metabolic rate. The greater the volume of hypertonic drink ingested, the worse the dPV outcome; but the opposite effect was true with the hypotonic drink as exercise duration progressed. Future research could investigate the efficacy of hypotonic CHO-E beverages on exercise performance during exercise in thermoneutral and hot conditions, relative to more concentrated solutions and non-CHO-E or water; drinks should be formulated with multiple-CHO types and contain sodium, and research designs should be adequately powered and use appropriate environmental conditions and exercise loads and reliable work tests (Table 6).
References
Shi X, Passe DH. Water and solute absorption from carbohydrate–electrolyte solutions in the human proximal small intestine: a review and statistical analysis. Int J Sport Nutr Exerc Metabol. 2010;20:427–42.
Gisolfi CV, Duchman SM. Guidelines for optimal replacement beverages for different athletic events. Med Sci Sports Exerc. 1992;24:679–87.
Shirreffs SM, Sawka MN. Fluid and electrolyte needs for training, competition, and recovery. J Sports Sci. 2011;29(Suppl 1):S39-46.
Sawka MN, Burke LM, Eichner ER, Maughan RJ, Montain SJ, Stachenfeld NS. American College of Sports Medicine position stand. Exercise and fluid replacement. Med Sci Sports Exerc. 2007;39:377–90.
Montain SJ, Sawka MN, Latzka WA, Valeri CR. Thermal and cardiovascular strain from hypohydration: influence of exercise intensity. Int J Sports Med. 1998;19:87–91.
Sawka MN, Knowlton RG, Critz JB. Thermal and circulatory responses to repeated bouts of prolonged running. Med Sci Sports. 1979;11:177–80.
Watanabe K, Stöhr EJ, Akiyama K, Watanabe S, González-Alonso J. Dehydration reduces stroke volume and cardiac output during exercise because of impaired cardiac filling and venous return, not left ventricular function. Physiol Rep. 2020;8:e14433.
Sawka MN, Young AJ, Francesconi RP, Muza SR, Pandolf KB. Thermoregulatory and blood responses during exercise at graded hypohydration levels. J Appl Physiol. 1985;59:1394–401.
Gonzalez-Alonso J, Mora-Rodriguez R, Below PR, Coyle EF. Dehydration reduces cardiac output and increases systemic and cutaneous vascular resistance during exercise. J Appl Physiol. 1995;79:1487–96.
Sawka MN, Noakes TD. Does dehydration impair exercise performance? Med Sci Sports Exerc. 2007;39:1209–17.
Montain SJ, Latzka WA, Sawka MN. Control of thermoregulatory sweating is altered by hydration level and exercise intensity. J Appl Physiol. 1985;1995(79):1434–9.
Saltin B. Circulatory response to submaximal and maximal exercise after thermal dehydration. J Appl Physiol. 1964;19:1125–32.
Trangmar SJ, González-Alonso J. New insights into the impact of dehydration on blood flow and metabolism during exercise. Exerc Sport Sci Rev. 2017;45:146–53.
González-Alonso J, Calbet JA, Nielsen B. Muscle blood flow is reduced with dehydration during prolonged exercise in humans. J Physiol. 1998;513(Pt 3):895–905.
Goulet ED. Effect of exercise-induced dehydration on time-trial exercise performance: a meta-analysis. Br J Sports Med. 2011;45:1149–56.
James LJ, Moss J, Henry J, Papadopoulou C, Mears SA. Hypohydration impairs endurance performance: a blinded study. Physiol Rep. 2017;5:e13315.
Cheuvront SN, Kenefick RW, Montain SJ, Sawka MN. Mechanisms of aerobic performance impairment with heat stress and dehydration. J Appl Physiol. 1985;2010(109):1989–95.
Cheuvront SN, Carter R 3rd, Castellani JW, Sawka MN. Hypohydration impairs endurance exercise performance in temperate but not cold air. J Appl Physiol. 2005;99:1972–6.
Sawka MN. Physiological consequences of hypohydration: exercise performance and thermoregulation. Med Sci Sports Exerc. 1992;24:657–70.
Wall BA, Watson G, Peiffer JJ, Abbiss CR, Siegel R, Laursen PB. Current hydration guidelines are erroneous: dehydration does not impair exercise performance in the heat. Br J Sports Med. 2015;49:1077–83.
Dion T, Savoie FA, Asselin A, Gariepy C, Goulet ED. Half-marathon running performance is not improved by a rate of fluid intake above that dictated by thirst sensation in trained distance runners. Eur J Appl Physiol. 2013;113:3011–20.
Berkulo MA, Bol S, Levels K, Lamberts RP, Daanen HA, Noakes TD. Ad-libitum drinking and performance during a 40-km cycling time trial in the heat. Eur J Sport Sci. 2016;16:213–20.
Brouns F, Saris W, Schneider H, Brouns F, Saris W, Schneider H. Rationale for upper limits of electrolyte replacement during exercise. Int J Sport Nutr. 1992;2:229–38.
Rowlands D, Houltham S, Musa-Veloso K, Brown F, Paulionis L, Bailey D. Fructose–glucose composite carbohydrates and endurance performance: critical review and future perspectives. Sports Med. 2015;45:1561–76.
Hamilton MT, Gonzalez-Alonso J, Montain SJ, Coyle EF. Fluid replacement and glucose infusion during exercise prevent cardiovascular drift. J Appl Physiol. 1991;71:871–7.
Baker LB, Jeukendrup AE. Optimal composition of fluid-replacement beverages. Compr Physiol. 2014;4:575–620.
Murray R, Eddy DE, Murray TW, Seifert JG, Paul GL, Halaby GA. The effect of fluid and carbohydrate feedings during intermittent cycling exercise. Med Sci Sports Exerc. 1987;19:597–604.
Maughan RJ, Watson P, Cordery PA, Walsh NP, Oliver SJ, Dolci A, et al. A randomized trial to assess the potential of different beverages to affect hydration status: development of a beverage hydration index. Am J Clin Nutr. 2016;103:717–23.
Leiper JB. Fate of ingested fluids: factors affecting gastric emptying and intestinal absorption of beverages in humans. Nutr Rev. 2015;73:57–72.
Noakes TD, Rehrer NJ, Maughan RJ. The importance of volume in regulating gastric emptying. Med Sci Sports Exerc. 1991;23:307–13.
Shi X, Osterberg KL, Petrie H, Stofan JR, Murray R. Effect of different osmolalities, CHO types, and [CHO] on gastric emptying in humans. Med Sci Sports Exerc. 2017;49:1015–21.
Gisolfi CV, Lambert GP, Summers RW. Intestinal fluid absorption during exercise: role of sport drink osmolality and [Na+]. Med Sci Sports Exerc. 2001;33:907–15.
Gisolfi CV, Summers RD, Schedl HP, Bleiler TL. Effect of sodium concentration in a carbohydrate–electrolyte solution on intestinal absorption. Med Sci Sports Exerc. 1995;27:1414–20.
Rowlands DS, Bonnetti DL, Hopkins WG. Unilateral fluid absorption and effects on peak power after ingestion of commercially available hypotonic, isotonic, and hypertonic sports drinks. Int J Sport Nutr Exerc Metab. 2011;21:480–91.
Lambert GP, Chang RT, Xia T, Summers RW, Gisolfi CV. Absorption from different intestinal segments during exercise. J Appl Physiol. 1997;83:204–12.
Miller VS, Bates GP. Hydration, hydration, hydration. Ann Occup Hyg. 2010;54:134–6.
Gisolfi CV, Summers RW, Lambert GP, Lambert GP, Xia T. Effect of beverage osmolality on intestinal fluid absorption during exercise. J Appl Physiol. 1998;85:1941–8.
Shi X, Summers RW, Schedl HP, Chang RT, Lambert GP, Gisolfi CV. Effects of solution osmolality on absorption of select fluid replacement solutions in human duodenojejunum. J Appl Physiol. 1994;77:1178–84.
Shi X, Summers RW, Schedl HP, Flanagan SW, Chang R, Gisolfi CV. Effects of carbohydrate type and concentration and solution osmolality on water absorption. Med Sci Sports Exerc. 1995;27:1607–15.
Maughan RJ, Leiper JB. Sodium intake and post-exercise rehydration in man. Eur J Appl Physiol. 1995;71:311–9.
Maughan RJ, Owen JH, Shirreffs SM, Leiper JB. Post-exercise rehydration in man: effects of electrolyte addition to ingested fluids. Eur J Appl Physiol. 1994;69:209–15.
Murray R. In: Sadler MJ, editor. Foods, nutrients and food ingredients with authorised Eu health claims . Sawston: Woodhead Publishing; 2014. p. 349–72.
Mettler S, Rusch C, Colombani PC. Osmolality and pH of sport and other drinks available in Switzerland. Schweizerische Zeitschrift fur Sportmedizin und Sporttraumatologie. 2006;54:92.
Yang M. A review of random effects modelling in SAS (release 8.2). London: Centre for Multilevel Modelling, Institute of Education, University of London; 2003.
Hopkins WG. Improving meta-analyses in sport and exercise science. Sportscience. 2018;22:11–7.
Greenland S. Bayesian perspectives for epidemiological research: I. Foundations and basic methods. Int J Epidemiol. 2006;35:765–75.
Pethick WA, Murray HJ, McFadyen P, Brodie R, Gaul CA, Stellingwerff T. Effects of hydration status during heat acclimation on plasma volume and performance. Scand J Med Sci Sports. 2019;29:189–99.
Paton C, Hopkins W. Variation in performance of elite cyclists from race to race. Eur J Sport Sci. 2006;6:25–31.
Hopkins WG, Hawley JA, Burke LM. Design and analysis of research on sport performance enhancement. Med Sci Sports Exerc. 1999;31:472–85.
Hopkins WG, Marshall SW, Batterham AM, Hanin J. Progressive statistics for studies in sports medicine and exercise science. Med Sci Sport Exerc. 2009;41:3–13.
Rafi Z, Greenland S. Semantic and cognitive tools to aid statistical science: replace confidence and significance by compatibility and surprise. BMC Med Res Methodol. 2020;20:244.
Mastrandrea MD, Field CB, Stocker TF, Edenhofer O, Ebi KL, Frame DJ, et al. Guidance note for lead authors of the IPCC Fifth Assessment Report on consistent treatment of uncertainties. Intergovernmental Panel on Climate Change (IPCC). 2010. https://pure.mpg.de/rest/items/item_2147184/component/file_2147185/content.
Higgins JP. Commentary: heterogeneity in meta-analysis should be expected and appropriately quantified. Int J Epidemiol. 2008;37:1158–60.
Febbraio MA, Murton P, Selig SE, Clark SA, Lambert DL, Angus DJ, et al. Effect of CHO ingestion on exercise metabolism and performance in different ambient temperatures. Med Sci Sports Exerc. 1996;28:1380–7.
Daries HN, Noakes TD, Dennis SC. Effect of fluid intake volume on 2-h running performances in a 25 °C environment. Med Sci Sports Exerc. 2000;32:1783–9.
Fallowfield JL, Williams C, Booth J, Choo BH, Growns S. Effect of water ingestion on endurance capacity during prolonged running. J Sports Sci. 1996;14:497–502.
Owen MD, Kregel KC, Tim Wall P, Gisolfi CV. Effects of ingesting carbohydrate beverages during exercise in the heat. Med Sci Sports Exerc. 1986;18:568–75.
Deuster PA, Singh A, Hofmann A, Moses FM, Chrousos GC. Hormonal responses to ingesting water or a carbohydrate beverage during a 2 h run./Reponses hormonales a l’ ingestion d’ eau ou d’ une boisson aux hydrates de carbone pendant une course de 2 heures. Med Sci Sports Exerc. 1992;24:72–9.
Rogers J, Summers RW, Lambert GP. Gastric emptying and intestinal absorption of a low-carbohydrate sport drink during exercise. Int J Sport Nutr Exerc Metab. 2005;15:220.
Ryan AJ, Bleiler TL, Carter JE, Gisolfi CV. Gastric emptying during prolonged cycling exercise in the heat. Med Sci Sports Exerc. 1989;21:51–8.
Criswell D, Renshler K, Powers SK, Tulley R, Cicale M. Fluid replacement beverages and maintenance of plasma volume during exercise: role of aldosterone and vasopressin. Eur J Appl Physiol. 1992;65:445–51.
Yaspelkis BB III, Ivy JL. Effect of carbohydrate supplements and water on exercise metabolism in the heat. J Appl Physiol. 1991;71:680–7.
Davis JM, Lamb DR, Pate RR, Slentz CA, Burgess WA, Bartoli WP. Carbohydrate-electrolyte drinks: effects on endurance cycling in the heat. Am J Clin Nutr. 1988;48:1023–30.
Bishop NC, Blannin AK, Walsh NP, Gleeson M. Carbohydrate beverage ingestion and neutrophil degranulation responses following cycling to fatigue at 75% VO2 max. Int J Sports Med. 2001;22:226–31.
Coso JD, Estevez E, Baquero R, Mora-Rodriguez R. Anaerobic performance when rehydrating with water or commercially available sports drinks during prolonged exercise in the heat. Appl Physiol Nutr Metab. 2008;33:290–8.
Ishijima T, Hashimoto H, Satou K, Muraoka I, Suzuki K, Higuchi M. The different effects of fluid with and without carbohydrate ingestion on subjective responses of untrained men during prolonged exercise in a hot environment. J Nutr Sci Vitaminol. 2009;55:506–10.
Lee JKW, Nio AQX, Ang WH, Law LYL, Lim CL. Effects of ingesting a sports drink during exercise and recovery on subsequent endurance capacity. Eur J Sport Sci. 2011;11:77–86.
Maughan RJ, Fenn CE, Gleeson M, Leiper JB. Metabolic and circulatory responses to the ingestion of glucose polymer and glucose/electrolyte solutions during exercise in man. Eur J Appl Physiol. 1987;56:356–62.
Maughan RJ, Bethell LR, Leiper JB. Effects of ingested fluids on exercise capacity and on cardiovascular and metabolic responses to prolonged exercise in man. Exp Physiol. 1996;81:847–59.
Murray R, Eddy DE, Paul GL, Seifert JG, Halaby GA. Physiological responses to glycerol ingestion during exercise. J Appl Physiol. 1991;71:144–9.
Sanders B, Noakes TD, Dennis SC. Water and electrolyte shifts with partial fluid replacement during exercise. Eur J Appl Physiol. 1999;80:318–23.
McConell GK, Burge CM, Skinner SL, Hargreaves M. Influence of ingested fluid volume on physiological responses during prolonged exercise. Acta Physiol Scand. 1997;160:149–56.
Powers SK, Lawler J, Dodd S, Tulley R, Landry G, Wheeler K. Fluid replacement drinks during high intensity exercise effects on minimizing exercise-induced disturbances in homeostasis. Eur J Appl Physiol. 1990;60:54–60.
Kingwell B, McKenna MJ, Sandstrom ER, Hargreaves M. Effect of glucose polymer ingestion on energy and fluid balance during exercise. J Sports Sci. 1989;7:3–8.
Massicotte D, Peronnet F, Brisson G, Bakkouch K, Hillaire MC. Oxidation of a glucose polymer during exercise: comparison with glucose and fructose (Oxydation d’un glucose polymere lors de l’exercice et comparaison avec le glucose et le fructose). J Appl Physiol. 1989;66:179–83.
McConell GK, Stephens TJ, Canny BJ. Fluid ingestion does not influence intense 1-h exercise performance in a mild environment. Med Sci Sports Exerc. 1999;31:386–92.
Hopkins WG. Individual responses made easy. J Appl Physiol. 2015;118:1444–6.
Jentjens RL, Underwood K, Achten J, Currell K, Mann CH, Jeukendrup AE. Exogenous carbohydrate oxidation rates are elevated after combined ingestion of glucose and fructose during exercise in the heat. J Appl Physiol. 1985;2006(100):807–16.
Pappenheimer JR, Reiss KZ. Contribution of solvent drag through intercellular junctions to absorption of nutrients by the small intestine of the rat. J Membr Biol. 1987;100:123–36.
Shi X, Schedl HP, Summers RM, Lambert GP, Chang RT, Xia T, et al. Fructose transport mechanisms in humans. Gastroenterology. 1997;113:1171–9.
Jones BJ, Higgins BE, Silk DB. Glucose absorption from maltotriose and glucose oligomers in the human jejunum. Clin Sci (Lond). 1987;72:409–14.
van Wijck K, Lenaerts K, Grootjans J, Wijnands KA, Poeze M, van Loon LJ, et al. Physiology and pathophysiology of splanchnic hypoperfusion and intestinal injury during exercise: strategies for evaluation and prevention. Am J Physiol Gastrointest Liver Physiol. 2012;303:G155–68.
Pals KL, Chang RT, Ryan AJ, Gisolfi CV. Effect of running intensity on intestinal permeability. J Appl Physiol. 1985;1997(82):571–6.
Costill D, Saltin B. Factors limiting gastric emptying during rest and exercise. J Appl Physiol. 1974;37:679–83.
Merson SJ, Maughan RJ, Shirreffs SM. Rehydration with drinks differing in sodium concentration and recovery from moderate exercise-induced hypohydration in man. Eur J Appl Physiol. 2008;103:585–94.
Shirreffs SM, Maughan RJ. Volume repletion after exercise-induced volume depletion in humans: replacement of water and sodium losses. Am J Physiol Ren Physiol. 1998;274:F868–75.
Shirreffs SM, Taylor AJ, Leiper JB, Maughan RJ. Post-exercise rehydration in man: effects of volume consumed and drink sodium content. Med Sci Sports Exerc. 1996;28:1260–71.
Verde T, Shephard RJ, Corey P, Moore R. Sweat composition in exercise and in heat. J Appl Physiol. 1982;53:1540–5.
Siegel AJ. Hypertonic (3%) sodium chloride for emergent treatment of exercise-associated hypotonic encephalopathy. Sports Med. 2007;37:459–62.
Wemple RD, Morocco TS, Mack GW. Influence of sodium replacement on fluid ingestion following exercise-induced dehydration. Int J Sport Nutr. 1997;7:104–16.
Bourdon PC, Lobigs L, Nikolovski Z, El-Gingo M, Varamenti E, Schumacher YO. Reliability and accuracy of plasma volume measures using two different analysers. Indianapolis: American College of Sports Medicine; 2015.
Beckers EJ, Rehrer NJ, Saris WH, Brouns F, Ten Hoor F, Kester AD. Daily variation in gastric emptying when using the double sampling technique. Med Sci Sports Exerc. 1991;23:1210–2.
Maughan RJ, Leiper JB. Methods for the assessment of gastric emptying in humans: an overview. Diabet Med. 1996;13:S6-10.
Brouns F, Senden J, Beckers J, Saris WHM. Osmolarity does not affect the gastric emptying rate of oral rehydration solutions. J Parenter Enter Nutr. 1995;19:403–6.
Elias E, Gibson GJ, Greenwood LF, Hunt JN, Tripp JH. The slowing of gastric emptying by monosaccharides and disaccharides in test meals. J Physiol. 1968;194:317–26.
Hunt JN. The site of receptors slowing gastric emptying in response to starch in test meals. J Physiol. 1960;154:270–6.
Sole CC, Noakes TD. Faster gastric emptying for glucose polymer and fructose solutions than for glucose in humans. Eur J Appl Physiol. 1989;58:605–12.
Shi X, Bartoli W, Horn M, Murray R. Gastric emptying of cold beverages in humans: effect of transportable carbohydrates. Int J Sport Nutr Exerc Metab. 2000;10:394–403.
Vist GE, Maughan RJ. The effect of osmolality and carbohydrate content on the rate of gastric emptying of liquids in man. J Physiol. 1995;486(2):523–31.
Sanaka M, Yamamoto T, Anjiki H, Osaki Y, Kuyama Y. Is the pattern of solid-phase gastric emptying different between genders? Eur J Clin Invest. 2006;36:574–9.
Turnberg LA. Electrolyte absorption from the colon. Gut. 1970;11:1049–54.
Grim E. Water and electrolyte flux rates in the duodenum, jejunum, ileum and colon, and effects of osmolarity. Am J Dig Dis. 1962;7:17–27.
Wapnir RA, Lifshitz F. Osmolality and solute concentration—their relationship with oral hydration solution effectiveness: an experimental assessment. Pediatr Res. 1985;19:894–8.
Shi X, Gisolfi CV. Fluid and carbohydrate replacement during intermittent exercise. Sports Med. 1998;25:157–72.
Soergel KH, Whalen GE, Harris JA. Passive movement of water and sodium across the human small intestinal mucosa. J Appl Physiol. 1968;24:40–8.
Hunt JB, Elliott EJ, Fairclough PD, Clark ML, Farthing MJG. Water and solute absorption from hypotonic glucose-electrolyte solutions in human jejunum. Gut. 1992;33:479–83.
Leiper JB. Intestinal water absorption-implications for the formulation of rehydration solutions. Int J Sports Med. 1998;19:S129–32.
O’Brien WJ, Rowlands DS. Fructose-maltodextrin ratio in a carbohydrate–electrolyte solution differentially affects exogenous carbohydrate oxidation rate, gut comfort, and performance. Am J Physiol Gastrointest Liver Physiol. 2011;300:G181–9.
Leiper JB, Broad NP, Maughan RJ. Effect of intermittent high-intensity exercise on gastric emptying in man. Med Sci Sports Exerc. 2001;33:1270–8.
Vander AJ, Sherman JH, Luciano DS. Human physiology: the mechanisms of body function. 6th ed. New York: McGraw-Hill Inc; 1994.
Acknowledgements
The authors acknowledge Prof. Will G. Hopkins for peer-review of the SAS code and meta-analysis structure.
Author information
Authors and Affiliations
Corresponding author
Ethics declarations
Author Contributions
Data extraction was performed by HK and CB and reviewed by DR. The manuscript was prepared by CB and DR, with review by HK. Meta-analysis of the extracted data was completed by DR. Review and editing of the final manuscript was completed by DR, HK and CB.
Availability of Data
Results are presented within the article. The input and processed full-analysis datasets are in Online Supplemental Material 2 and 3.
Code Availability
SAS code for the random effects meta-analysis is in given in Online Supplementary Material 1.
Funding
No external funding was provided for the completion of this meta-analysis and review.
Conflict of interest
Brigitte Hani Kopetschny and Claire Badenhorst declare no potential conflicts of interest - David Rowlands previously received funding from Frucor Ltd (NZ) and Lucozade-Ribena-Suntory (UK) to report upon hypotonic drink effects on hydration.
Registration
Initial protocol registered with CAMARADES, publication date 27 April 2017.
Supplementary Information
Below is the link to the electronic supplementary material.
Rights and permissions
Open Access This article is licensed under a Creative Commons Attribution 4.0 International License, which permits use, sharing, adaptation, distribution and reproduction in any medium or format, as long as you give appropriate credit to the original author(s) and the source, provide a link to the Creative Commons licence, and indicate if changes were made. The images or other third party material in this article are included in the article's Creative Commons licence, unless indicated otherwise in a credit line to the material. If material is not included in the article's Creative Commons licence and your intended use is not permitted by statutory regulation or exceeds the permitted use, you will need to obtain permission directly from the copyright holder. To view a copy of this licence, visit http://creativecommons.org/licenses/by/4.0/.
About this article

Cite this article
Rowlands, D.S., Kopetschny, B.H. & Badenhorst, C.E. The Hydrating Effects of Hypertonic, Isotonic and Hypotonic Sports Drinks and Waters on Central Hydration During Continuous Exercise: A Systematic Meta-Analysis and Perspective. Sports Med 52, 349–375 (2022). https://doi.org/10.1007/s40279-021-01558-y
Accepted:
Published:
Issue Date:
DOI: https://doi.org/10.1007/s40279-021-01558-y